Algebra
Level 3-4
4 Weeks
Matchstick Patterns
The unit investigates patterns made using matches and tiles. The relation between the number of the term of a pattern and the number of matches that that term has, is explored with a view to finding a general rule that can be expressed in several ways.
- Predict the next term of a spatial pattern.
- Find a rule to give the number of matches in a given term of the pattern.
- Find the member of the pattern that has a given number of matches.
These Learning Outcomes are covered in every lesson of the unit.
This unit develops the concept of a relation by using matches to demonstrate how patterns grow. A relation is a connection between the value of one variable (changeable quantity) and another. In the case of matchstick patterns, the first variable is the term, that is the step number of the figure, e.g. Term 5 is the fifth figure in the growing pattern. The second variable is the number of matches needed to create the figure.
Relations can be represented in many ways. In this context, the purpose of representations is to enable prediction of further terms, and the corresponding value of the other variable, in a growing pattern. For example, representations might be used to find the number of matches needed to build the tenth term in the pattern. Important representations include:
- Tables of values
- Word rules for the nth term
- Equations that symbolise word rules
- Graphs on a number plane
Further detail about the development of representations for growth patterns can be found on pages 34-38 of Book 9: Teaching Number through Measurement, Geometry, Algebra and Statistics.
Links to Numeracy
This unit provides an opportunity to focus on the strategies students use to solve number problems. The matchstick patterns are all based on linear relations. This means that the increase in number of matches needed for the ‘next’ term is a constant number added to the previous term.
Encourage students to think about linear patterns by focusing on the different strategies that can be used to calculate successive numbers in the pattern. For example, the pattern for the triangle path made from 9 matches can be seen as in a variety of ways:
3 + 2 + 2 + 2
1 + 2 + 2 + 2 + 2
3 + 3 X 2
1 + 4 X 2
Questions to develop strategic thinking:
- What numbers could you use to describe the way the pattern is made and how it grows?
- What do the numbers and operations tell you about the pattern?
- In what order do we perform the calculations like 3 + 3 x 2? (Note order of operations)
- Are the expressions the same in some way? For example, How is 3 + 2 + 2 + 2 the same as 3 + 3 x 2?
- Which expressions are the most efficient ways to calculate the number of matches?
Strategies for representation and prediction will support students to engage in the more traditional forms of algebra at higher levels.
The learning opportunities in this unit can be differentiated by providing or removing support to students and by varying the task requirements. Ways to support students include:
- providing matchsticks so students can build the growth patterns
- using colour to highlight repeating elements in diagrams of the growth patterns
- easing the calculation demands by providing calculators
- encouraging students to verbally share their thinking with each other
- using whiteboards, dot paper, grid paper, and digital drawing tools to represent patterns
- providing table templates
- modelling how to create tables and other ways for students to record their working and ease demands on their working memory.
Tasks can be varied in many ways including:
- reducing the ‘distance’ of the terms involved, particularly predicting the number of matches for terms that are easy to build and check
- reducing the complexity of the patterns, e.g. increasing in twos, threes, and fives rather than sixes, twelves, etc
- collaborative grouping so students can support others
- reducing the demands for a product, e.g. oral presentation rather than a lot of calculations and words.
The context for this unit can be adapted to suit the interests and cultural backgrounds of your students. Matches are a cheap and accessible resource but may not be of interest to your students. They might be more interested in other thin objects such as leaves or lines on tapa (kapa) cloth. You might find growth patterns in friezes on buildings in the community. Look for opportunities to connect learning with the everyday experiences of your students.
Te reo Māori vocabulary terms such as taurangi (algebra), pūtaketake (the base element of a pattern), and ture (formula, rule) could be introduced in this unit and used throughout other mathematical learning.
- Matches with the heads burnt, or toothpicks, ice-block sticks, nursery sticks, trimmed bamboo skewers, etc.
- Dot paper as an alternative to using matches
- PowerPoint One
Note: All of the patterns used in this unit are available in PowerPoint 1 to allow easy sharing with Smart TV or similar.
Session 1: Triangle Paths
In this session we look at a simple pattern created by putting matches together to form a connected path of triangles.
- Introduce the session by telling the students that Kiri made the following matchstick paths using 1, 2, and 3 triangles – she called them a 1-triangle path, a 2-triangle path, and a 3-triangle path. Note that 1, 2, and 3 are the term numbers in Kiri’s pattern.
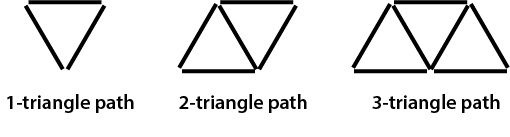
- Ask the students to use Kiri’s method to make a 4- and then a 5-triangle path.
How many extra matches would be needed to make a 6-triangle path? A 7-triangle path?
How many matches would Kiri need to make a 20-triangle path? - Let students work out the number of matches needed for the 20th term. Use think, pair, share to allow students to compare their strategies.
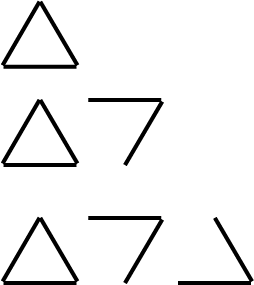
- Kiri noticed that if she rearranged the matches, she could count them quite quickly. The following picture shows how she rearranged them.
How does Kiri’s method work?.
How would Kiri rearrange a 7-triangle path?
What expression would she write to show her calculation? (1 + 7 x 2 or 1 + 2 + 2 + 2 + 2 + 2 + 2 + 2)
- Tell the class that Kiri says that using her method, she can see a shortcut way of counting the number of matches needed to make a 10-triangle path. Get them to write down, using pictures to support their explanation, what Kiri’s short cut method might be.
- Let’s call Kiri’s method, Kiri’s Rule. Ask:
Using Kiri’s Rule, how many matches will be needed to make a 20-triangle path?
Reverse the problem by asking: How big a path can Kiri make with 201 matches? - Allow students time to develop an answer and compare their strategies.
- Do students that relied on repeated addition change to multiplicative strategies with increased demand?
- Are students able to recognise that the term number is required, not the number of matches?
- Can students ‘undo’ their previous rules to find the term number?
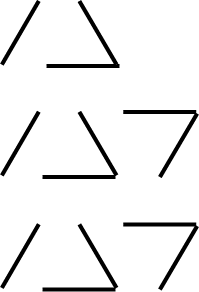
- Kiri’s friend Jamie arranged his matches differently. His pictures looked like this:
What is Jamie’s Rule?
What is Jamie’s picture for a 12-triangle path?
What expression could Jamie write for the 12-triangle path (Term 12)
How are 3 + 2 + 2 + …+ 2 and 3 + 11 x 2 the same? - Jamie says that using his method, he can see another short cut way of counting the number of matches needed to make a 10-triangle path. Get the class to explain, using written and/or verbal language, what Jamie's strategy is. Some students may benefit from, or prefer to use, pictures to support their explanations.
How many matches will be needed to make a 20-triangle path?
How big a path can Jamie make with 201 matches? - Get the students to explain how Kiri’s Rule is different and the same compared to Jamie’s Rule.
- Ask the class: How would Kiri and Jamie explain to someone else how they could find the number of matches needed to make a path consisting of any number, say 1000, of triangles?
Extension idea:
Vey-un has another way to work out the number of matches for a 10-triangle pattern. He writes 10 x 3 – 9 and gets the same number of matches as Kiri and Jamie, 21.
Ask students to explain how Vey-un’s strategy works. What do the numbers in his calculation refer to?
[Vey-un imagines ten complete triangles that require 10 x 3 = 30 matches to build. He imagines that the ten triangles join and that creates nine overlaps. He subtracts nine from 30 to allow for the overlapping matches.]
At this stage, it may be appropriate to revisit or introduce the concept of “BEDMAS”. The acronym BEDMAS signifies the order in which operations should be carried out in an equation: brackets, exponents, division and multiplication in the order that they occur, and then addition and subtraction in the order that they occur. Ask your students to solve 10 X 3 – 9 by doing the multiplication first, which is the correct way (i.e. 30 – 9 = 21), and then by doing the subtraction first (i.e. 10 X -6 = -60). If negative numbers are beyond the knowledge of your students at the time of teaching, then you should adjust the numbers in the equations you provide. The key teaching point is that BEDMAS is used to guide us when solving problems with more than one sign. This is important because the order that we carry out number operations can change the outcome of a problem.
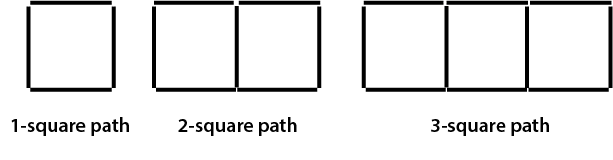
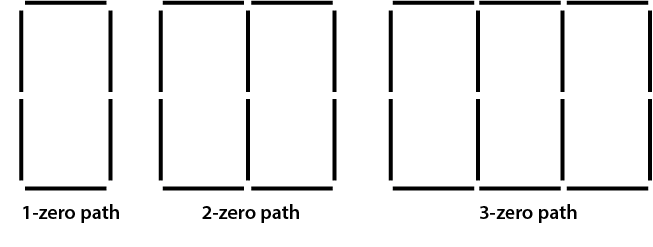
Session 2: Square Paths
Here we look at a simple pattern created by putting matches together to form a connected path of squares.
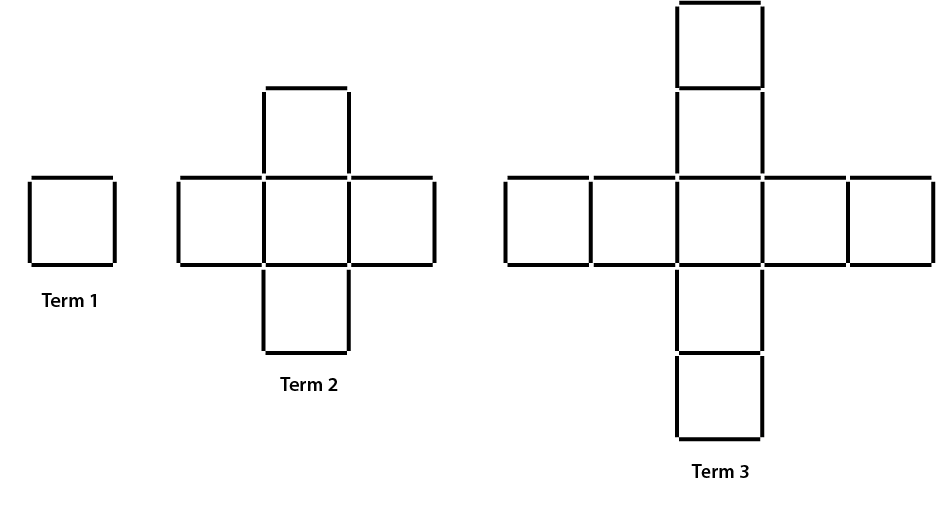
- Following the same general procedure as above, allow the students to explore ways of counting the number of matches that are needed to make square paths. Present the students with the following picture.
- Have your students construct a 4-square and 5-square path with matches or by drawing. Focus on how many extra matches were added each time. Where are the additional matches located?
- Ask your students how they could develop a quick and easy way of finding the number of matches needed to make a 20-square path.
What would Kiri, Jamie and Vey-un do for this square pattern? - Let the students work in groups of two or three. Ask the groups to make a picture showing how the 20-square path is made. They can experiment with the provided materials and draw different representations of the pattern. Prompt the students with the following questions:
Do you need to draw every square?
Is there only one possible way to look at the pattern?
What might some of the other ways look like? - Some pictures will be very helpful in counting the number of matches needed to make a 20-square path – some will not. Have the students choose the picture that they think best explains how successive square paths are made up AND gives a quick and easy method for counting the matches needed for a 20-square path. If there is a wide variety of strategies being presented in the group, ask students to share and justify their strategy with a peer who has developed a different strategy. Share the strategies back to the whole class and validate all thinking. Note the cumbersome nature of repeatedly drawing squares and repeatedly adding three matches.
What is a more efficient way to draw or calculate the total number of matches? - Have the students use their ‘best method’ to verify that 61 matches are needed to make a 20-square path.
- Compare the way the rules might be written:
Kiri [1 + 20 x 3] Jamie [4 + 19 x 3 Vey-un [20 x 4 – 19] - Students can use these methods or their own ways to predict the number of matches needed to make 14-, 36- and 100-square paths.
- Ask them to write down how they would use their method to count the number of matches needed to make a square path consisting of any number of squares, say 1000 squares. Depending on the comfort of students with their rules you might use algebraic notation to represent the word rules:
Kiri [1 + 3n] Jamie [4 + 3 (n-1] Vey-un [4n – (n-1)] - Reverse the problems so students must work out the term number for a given number of matches.
How many squares are in a square path with 31, 304 and 457 matches?
How many matches will be left over if you make the biggest square path that you can with 38, 100 and 1000 matches? - Are students able to ‘undo’ their rules to find missing terms?
Kiri calculates “One plus three times the term number” to find the number of matches.
If Kiri knows the number of matches, how should she undo her rule to find the term number? [Note that the order of undoing is important, subtract one then divide by three.]
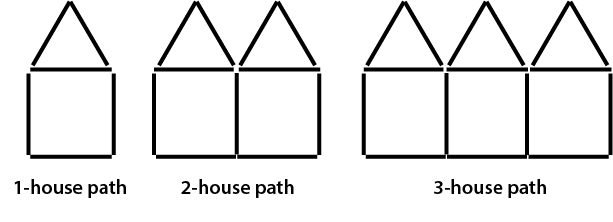
Session 3: House Paths
The ideas learnt in the last two sessions are reinforced here using ‘house paths’.
- Use the techniques developed in the last two sessions to explore the following problem:
A new matchstick path is being designed. It is called a house path. The first three terms are shown below. Develop a counting rule, that is, a short-cut way of counting the number of matches needed to make a 1000-house path. - Have the students illustrate how they developed their counting rule. They could do this, by using pictures, words or numbers (or some combination of these).
Do you need to draw every house?
Do you need to add on 999 times?
What do you think Kiri, Jamie and Vey-un might do with this pattern? - Get the class to discuss the various approaches that were used and methods that were obtained.
- Allow time for the class to write up its conclusions about the most efficient strategies.
- Latitia has 503 matches. How many houses are in her path if she uses all the matches? Will she have any matches left over?
Session 4: What’s My Path?
Next, the ideas of the first three sessions are extended and reinforced in another context. This time the problem gives a rule and the students find the pattern.
- Give students the following problem:
My friend made a picture of a pattern found in the local community that showed how her fifth matchstick path was made. She named it:
5 lots of 4 and add 2 (this was the counting rule used to make the path)
She sent it to me via email. However, I was only able to read the name of the path and not see the picture!
Make some possible pictures that she could have sent. - It is worth noting that there are many answers to this. So even if two groups get a different answer, they may still both be correct.
We have many different pictures that match the word rule. How are they different and how are they the same?
[The common property is that the pattern starts with two matches and build on using four matches for each additional shape] - Examples might include the patterns shown on the rest of PowerPoint One (shown below).
- Allow the class time both to report back and discuss their solutions, and to write up what they have discovered.
- Olika wanted to make a pattern using the n-rule. N means any number you give her, say 1000, 53 or 214.
Can you draw a pattern that matches this rule?
“n minus one then multiplied by five then add six”
What might the pattern look like?
One possible answer is:
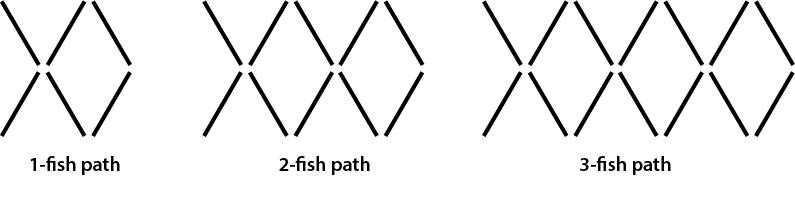
Session 5: Other Ways of Seeing Things
In this session, the concept of a relation is explored with a more complicated spatial pattern.
- Show the class the pattern below that is made up of matches. The 1st, 2nd, and 3rd terms of the sequence are shown.
- Challenge the students with this problem:
Find many different ways to work out the total number of matches in Term 10. - Remind students about the ways that Kiri, Jamie and Vey-un represented their patterns, including rules that work for any term.
- Let students work in pairs or threes. Ensure they record their thinking using diagrams and expressions. Do your students:
- Look for the growth between terms, i.e. 12 matches.
- Create tables of values to represent the number of matches for each term
- Use multiplicative strategies to predict the number of matches for term 10
- Gather the class to process the ideas. Highlight the efficiency of multiplicative strategies such as 10 x 12 – 8 and 4 + 9 x 12 compared to additive strategies like 4 = 12 + 12 + …
- Ask students to connect the numbers and operations in their expressions to the figural pattern of matches.
Why is the number of matches increasing by 12 each term?
How many groups of 12 matches will be in the 10th term?
Why does Kiri subtract 4 at the end? - How could our rules be used to predict the number of matches needed for Term 23? Term 101? Term n?
- If Taylor uses 604 matches to build a figure in this pattern, what Term does she make?
- To assess the ability of students to personally make predictions and create general rules pose this assessment task.
Here is a pattern of growing stars made with matches.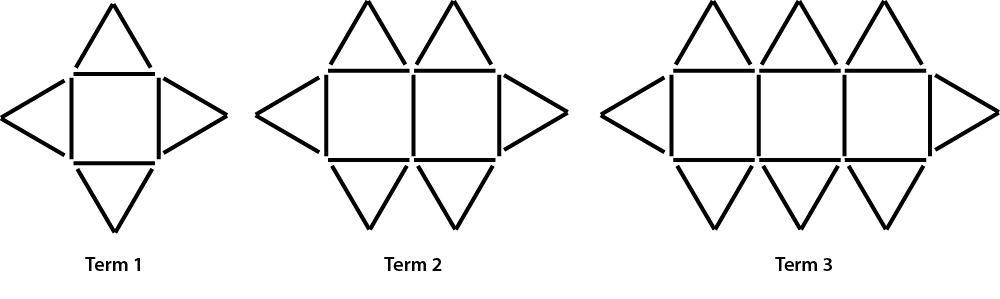
How many matches are needed to make Term 15, that has 15 stars?
Can you write a rule for the number of matches needed to make Term n, any term?
If you have 244 matches, what is biggest number of stars you can make in this pattern? - To further engage students in a real-life context asj them to research repeating patterns from other cultural backgrounds.
Dear parents and whānau,
This week in maths we have been looking at patterns made with matches. We looked at the first term, the second term, … the tenth term, … and so on and tried to find a relation between the number of matches and the number of the term. For example, we explored this pattern with matches:
Ask your students to explain how they could predict the numbers of matches in a ten-house path. What else can they share with you about the pattern?
Enjoy your exploration of this algebra problem!
Cube Signs
This is a level 3 algebra strand link activity from the Figure It Out series.
A PDF of the student activity is included.
Click on the image to enlarge it. Click again to close. Download PDF (268 KB)
use a table to find a rule for a geometric pattern
write rule to describe a relationship
FIO, Link, Algebra, Book One, Cube Signs, pages 4-5
multilink cubes
This activity further develops students’ abilities to predict patterns through the use of rules or equations. It also introduces them to the idea that the same pattern can be represented by different (but equivalent) equations.
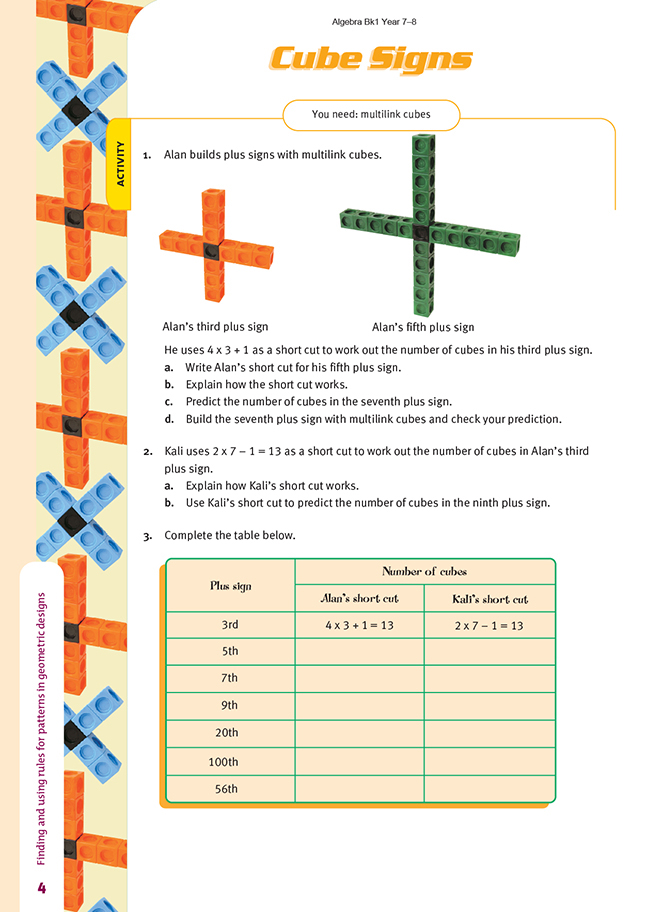
In questions 1–4, the students develop and explain different short cuts or strategies for working out the number of multilink cubes in particular plus signs. The short cuts arise from different ways of visualising the structure of the plus signs. The students use the short cuts to predict the number of cubes in plus signs of any size.
The students need to actually build the plus signs and then see if they can figure out how the physical models can be represented by the short cuts. For example, Alan’s third plus sign has 4 arms, each with 3 cubes, with 1 cube in the centre. So the short cut is 4 x 3 + 1.
The fifth plus sign has 4 arms, each with 5 cubes, and 1 cube in the centre, so the short cut is 4 x 5 + 1. The seventh plus sign has 4 arms, each with 7 cubes, and 1 cube in the centre, so the short cut is 4 x 7 + 1.
In question 2, the students should build the third plus sign with multilink cubes to match the short cut 2 x 7 – 1 = 13. As noted in the Answers, they need to take into account that the centre cube is initially counted twice.
Students who have difficulty seeing that 2 x 19 – 1 is Kali’s short cut for the ninth plus sign, where the 19 is found from 2 x 9 + 1, may need to build models with multilink cubes. They should explain how, for example, the short cut for the fourth plus sign is 2 x 9 – 1; how the short cut for the fifth plus sign is 2 x 11 – 1; and
so on. The table in question 3 provides an opportunity for the students to use the short cuts they have modelled with multilink cubes. They should also see that the different short cuts generate distinct rules that have exactly the same outcomes for particular plus signs of any size. Each rule is dependent on the way we see the cubes that make up the plus signs. As we change our point of view, we find new opportunities to express generality.
As noted in the introduction to these notes, students at this stage are not expected to use algebraic language, but there may well be students in your group or class who are ready to do so. The notes on algebraic language given here and for later pages are to help you to assist these students.
In algebraic language, the rules are 4 x x + 1 (Alan’s) and 2 x (2 x x + 1) – 1 (Kali’s), where the symbol x stands for the number of cubes in each arm of any plus sign. These rules are usually written more simply as
4x + 1 and 2(2x + 1) – 1. The multiplication sign is left out so that, for example, 4 x x becomes 4x (four times x is the same as four x). 2(2x + 1) – 1 and 4x + 1 give the same result for any value of x, so it is sensible to assume that 2(2x + 1) – 1 can be reduced to 4x + 1. The algebraic manipulation involved in this is
2(2x + 1) – 1 = (2 x 2x) + (2 x 1) – 1
= 4x + 2 – 1
= 4x + 1.
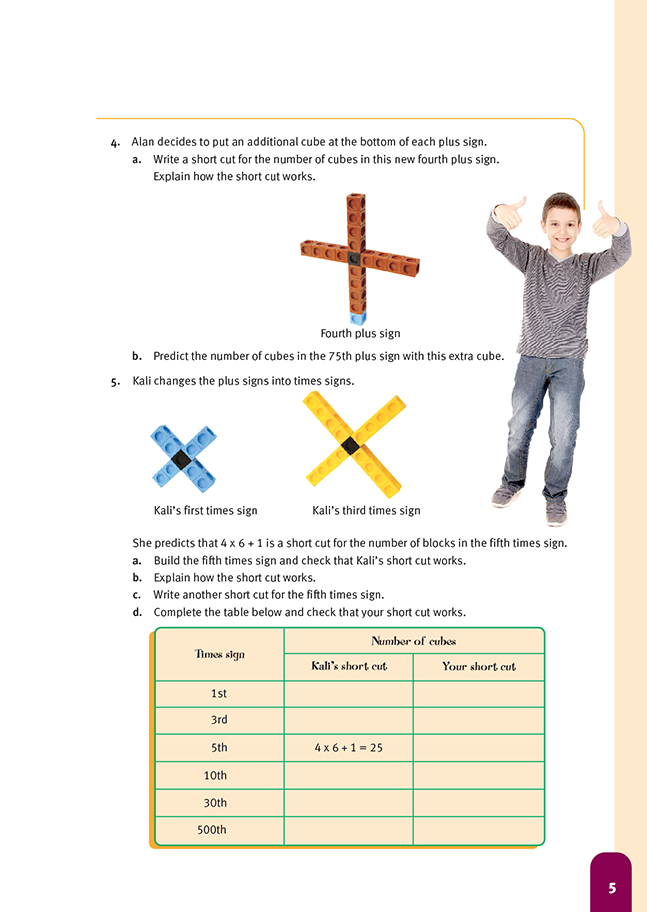
In question 4, encourage the students to look for more than one short cut. Two short cuts for the fourth plus sign are shown below.
Again, the best way for the students to identify short cuts is for them to make plus signs with multilink cubes. They need time to experiment and test the short cuts and to see if they can use them to develop a rule that in turn can be used to work out the number of cubes needed for the 75th or 123rd plus sign, and so on. Using more than one rule checks the accuracy of both the rule and the arithmetic in the calculations.
In question 5, the plus sign has been tilted and the arms extended. This means that the numbering of the plus and times signs are different. For example, Kali’s first times sign has the same number of cubes as Alan’s second plus sign. Likewise, in the fifth times sign, each arm has 6 cubes, with an additional cube for the centre of the times sign. So the fifth times sign has 4 x 6 + 1 = 25 cubes.

Another way to build the fifth times sign is:

Here, each arm has 5 yellow cubes. There are also 5 black cubes, one for the centre and one on the end of each arm. So the short cut is 4 x 5 + 5 = 25.
The table in question 5 provides an opportunity to consolidate the students’ use of the different rules that arise out of the different ways of seeing short cuts. The number of cubes for the 500th times sign can be very quickly calculated as 2 005 using either rule, and this demonstrates the power of generalisations and algebraic thinking. The algebraic rule for the xth times sign arising from the short cut 4 x 6 + 1 for the fifth times sign is 4 x (x + 1) + 1. This is the same as 4(x + 1) + 1, which simplifies to 4x + 4 + 1 = 4x + 5. The algebraic rule arising from 4 x 5 + 5 for the fifth times sign is 4 x x + 5, which is the same as 4x + 5. So the two rules are in fact equivalent.
Answers to activity
1. a. 4 x 5 + 1
b. Each plus sign has 4 arms, and there is 1 cube in the centre. In the third plus sign, there are 3 cubes in each arm. So, altogether, this sign has 4 x 3 + 1 cubes. The fifth plus sign has 5 cubes in each arm. So, altogether, the sign has 4 x 5 + 1 cubes.
c. 4 x 7 + 1 = 29
d. The seventh plus sign has 4 arms, each with 7 cubes, and there is 1 cube in the centre of the plus sign. Altogether, there are 29 cubes in this sign.
2. a. Kali sees the plus sign as a horizontal strip of 7 cubes and a vertical strip of 7 cubes, which is 2 sets of 7 cubes. But the centre cube has then been counted twice, and so 1 cube must be removed or subtracted. So the short cut is 2 x 7 – 1.
b. 2 x 19 – 1 = 37
3.
. 
4. a. One short cut is 4 x 4 + 2 = 18, and another is 2 x 9 = 18. Other short cuts are possible. In the first short cut, 4 x 4 + 2 = 18, there are 4 arms with 4 cubes, plus 1 extra cube at the bottom and another at the centre. In the second short cut, 2 x 9 = 18, there are 9 cubes in the horizontal arm and 10 – 1 cubes in the vertical arm (because the centre cube has been counted in the horizontal arm).
b. 4 x 75 + 2 = 302 cubes using the first short cut or 2 x 151 = 302 cubes using the second short cut 5. a.–b. The fifth times sign has 4 arms, each with 6 cubes. There is 1 cube in the centre of the times sign, so the short cut 4 x 6 + 1 = 25 does
work.
c. Answers may vary. One possible short cut is 4 x 5 + 5 = 25. A model that matches this short cut might have 4 arms, each with 5 identical cubes, and then a further 5 cubes, 1 for the centre and 1 on the end of each arm. Another possible short cut is 4 x 7 – 3. This is 4 arms of 7, minus 3 for the 3 arms in which the
centre cube is subtracted.
d.
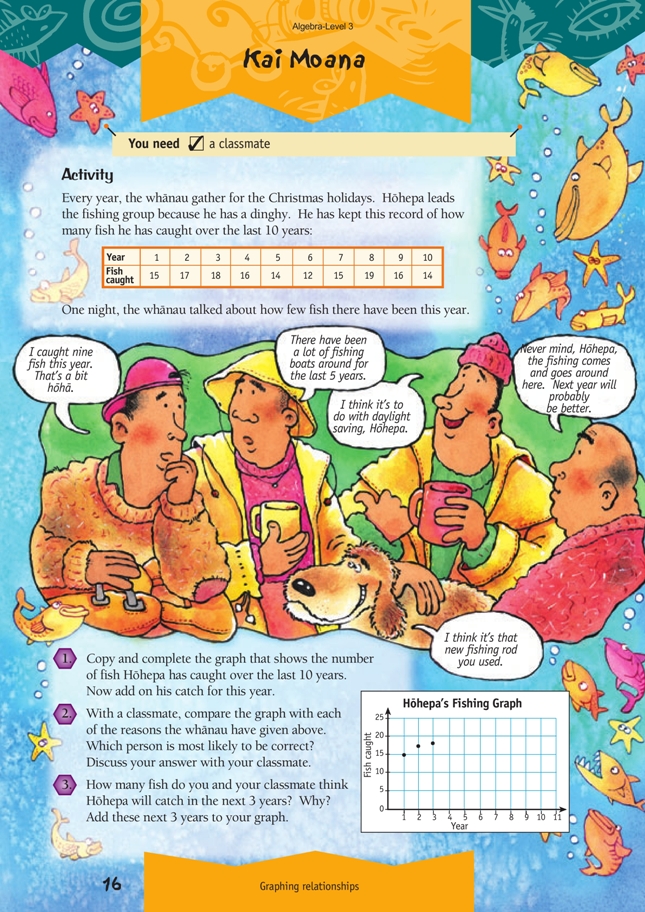
Kai Moana
This is a level 3 algebra strand activity from the Figure It Out series.
A PDF of the student activity is included.
Click on the image to enlarge it. Click again to close. Download PDF (483 KB)
use a graph to look for a pattern
classmate
Check that students can tell which person is Hōhepa. (He’s the person on the left.) They need to know this to answer question 1.
Various explanations of the graph are given in the answers. If students graphed the data in the In/Out tables on pages 10–11 and 12–13 of the students’ booklet, you could ask them to compare these graphs with their fishing graph for this page. They should notice that the points on their graphs of the In/Out tables form straight lines. This is because the relationship between the x axis values and the y axis values is constant. But the points on Hōhepa’s fishing graph are not in a straight line, and this is because the relationship between the year and the number of fish caught is not constant. If it were constant, it would have been easier for Hōhepa’s whànau and the students working on this activity to explain the pattern in the number of fish caught.
Another discussion point is the way the slope of a line that joins the points shows how quickly or slowly the number of fish caught is changing. If the line slopes down sharply, the number of fish caught is decreasing rapidly. If the line slopes up gently, the number of fish caught is increasing gradually. Graphs are often interpreted in this way in the news when organisations or politicians are trying to prove how quickly or slowly inflation or employment is changing.
From the table of data used for question 1, students should be able to add realistic data to their chart. The catch for years 11, 12, and 13 should increase if the pattern continues.
Answers to Activity
1.
2. Answers will vary. Daylight saving and the type of fishing rods used are unlikely to affect the number of fish caught. The graph does not show that the number of fishing boats around in the last 5 years has had a major impact on the number of fish caught. So it may just be that this year is low for no particular reason. (“The fishing comes and goes around here.”)
3. Answers will vary. Some students may think that it will get worse. On the other hand, the graph may be part of a pattern and the fishing could get better again. (Some students may see a pattern of an increase for 3 years and then a decrease for
3 years.)
Vege rows
The purpose of this activity is to engage students in using mathematical strategies to solve a sequence problem.
This activity assumes the students have experience in the following areas:
- Continuing a sequential pattern.
- Expressing the rule for a sequential or growing pattern.
- Creating arrays of items and finding the total number of items.
The problem is sufficiently open ended to allow the students freedom of choice in their approach. It may be scaffolded with guidance that leads to a solution, and/or the students might be given the opportunity to solve the problem independently.
The example responses at the end of the resource give an indication of the kind of response to expect from students who approach the problem in particular ways.

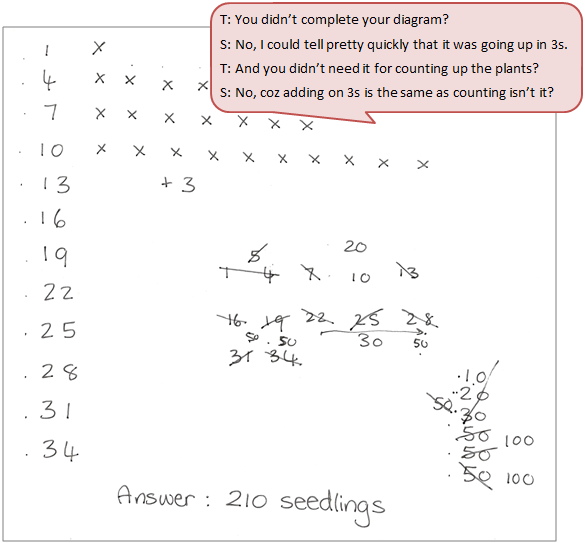
A gardener has a triangular patch of dirt that she wants to plant broccoli seedlings in.
If she spaces the seedlings correctly, she can fit twelve rows, with one seedling in the first row, four seedlings in the next, seven in the next and so on.
How many broccoli seedlings can she plant?
The following prompts illustrate how this activity can be structured around the phases of the Mathematics Investigation Cycle.
Make sense
Introduce the problem. Allow students time to read it and discuss in pairs or small groups.
- Do I understand the situation and the words? (Students may need to lay out a few rows of ‘make-believe’ seedlings to understand how the pattern grows.)
- Do I expect there to be an easy way to count the total number of seedlings? What comes to mind as an easy way?
- Have I seen a problem like this before? Where? What maths came in handy with that problem?
- What will my solution look like? (The solution will be the total number of seedlings supported by a justification that the number is correct.)
Plan approach
Discuss ideas about how to solve the problem. Emphasise that, in the planning phase, you want students to say how they would solve the problem, not to actually solve it.
- What strategies will be useful to solve a problem like this? (A diagram or physical model will be helpful but could be inefficient and not use the pattern. A table of values is likely to be very powerful in spotting patterns and relationships.)
- How will I look for a relationship between the number of seedlings in one row compared to the one before?
- Can I predict the number of seedlings in the 12th row without drawing it or continuing the table?
- What tools (digital or physical) could help my investigation?
Take action
Allow students time to work through their strategy and find a solution to the problem.
- Am I showing my workings in a step-by-step way?
- How is the pattern helping me to work more efficiently?
- How can I express the relationships I found using words and symbols? (Including tables.)
- How do my results look different or different to others? Why could this be?
- Do others have efficient ways to solve the problem? What makes those ways more efficient?
- What is my answer?
Convince yourself and others
Allow students time to check their answers and then either have them pair share with other groups or ask for volunteers to share their solution with the class.
- Can I state my solution clearly?
- Is my working clear for someone else to follow?
- Can I justify what I found using mathematical language and symbols?
- Did I try enough rows in the pattern to be confident in my rule?
- Is my rule expressed in a mathematical way?
- How would I convince someone else I am correct?
- How can I be sure that my way of adding the number of seedlings is correct?
- What tools and strategies were helpful?
Examples of work
Work sample 1
The student draws the pattern of broccoli seedlings and partitions the patch into blocks of 20 to count the total number.
Click on the image to enlarge it. Click again to close. 
Work sample 2
The student creates a table of values for the number of seedlings in each row. They notice that each row has 3 more seedlings than the previous row. They add the numbers in each row in sequence to get a total number.
Click on the image to enlarge it. Click again to close. 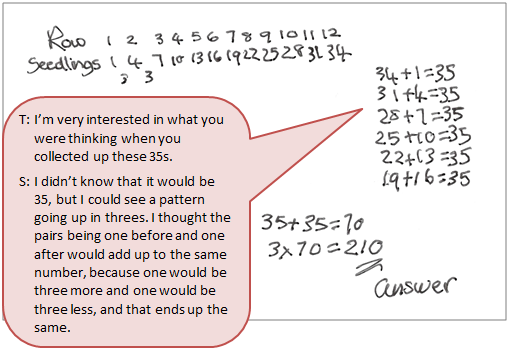
Triangular numbers
This problem solving activity has an algebra focus.
Triangular numbers are made by forming triangular patterns with counters.
Riwa has made the first four triangular numbers with blue counters.
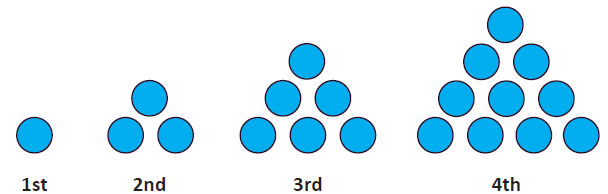
Riwa didn’t think that the first triangular number really looked like a triangle but it seemed a good place for the pattern to start.
The first triangular number is made with just one counter and so is one.
The second triangular number is 3.
The 3rd triangular number is 6 and the 4th triangular number is 10.
What is the 10th triangular number?
What is the 20th triangular number?
- Continue a pattern.
- Use a table where appropriate.
- Find a relation between successive members of a pattern.
In this problem students explore and continue patterns, and describe the rule for the recurrence of a pattern. Using a table, and incorporating number properties are valuable skills that can be used in many situations.
This problem is the first of four Algebra problems relating to triangular numbers: Counting Pills, Level 4; Triangular and Square Numbers, Level 5; and Triangular Number Links, Level 6 (Number and Algebra - Equations and Expressions). These problems develop the idea of the triangular numbers leading to an algebraic formula for the nth triangular number.
This problem is also related to the Level 3 Algebra problems Building Patterns Incrementally and Building Patterns Constantly.
The Problem
Triangular numbers are made by forming triangular patterns with counters. Riwa has made the first four triangular numbers with blue counters.
Riwa didn’t think that the first triangular number really looked like a triangle but it seemed a good place for the pattern to start. The first triangular number is made with just one counter and so is one. The second triangular number is 3. The 3rd triangular number is 6 and the 4th triangular number is 10.
What is the 10th triangular number?
What is the 20th triangular number?
Teaching Sequence
- Introduce the problem to the class. Brainstorm ideas for approaching the problem and keeping track of what has been done (e.g. by using a table).
- As the students work on the problem in pairs you might ask the following questions to extend their thinking:
What strategies might help you to find the answer?
How can you use your knowledge about numbers here?
Can you see any patterns that might help? Could you write an expression that demonstrates this? - Share the students’ answers. Ask them to explain their reasoning.
- Ask students to write up their method of solution.
- Use the extension problem for students ready for extension or as a problem on another day.
Extension
Which triangular number is equal to 120?
Solution
Many students will add new rows of counters, and make the 6th, 7th, 8th, 9th and 10th triangular numbers by construction. They will find that each new row requires one more counter than the previous one. This should lead them to see that the 10th triangular number is the 4th triangular number plus 5 + 6 + 7 + 8 + 9 + 10. That is, 10 + 5 + 6 + 7 + 8 + 9 + 10. These can be added in order to give the 10th triangular number as 55.
They may also see that the 1st triangular number has one on the bottom, the 2nd two on the bottom, the 3rd three and so on. The 4th triangular number is made up of 1 + 2 + 3 + 4 counters. So the result for the 10th triangular number can be written as 1 + 2 + 3 + 4 + 5 + 6 + 7 + 8 + 9 + 10.
There is a quick way to add consecutive numbers like this (see Algebra Information). When a string of numbers like this are added it is useful to ask yourself whether adding them in a different order makes the task more interesting. In this case, since the students will be familiar with ‘making ten’, it is natural for them to suggest adding (1+ 9) + (2 + 8) + (3 + 7) + (4 + 6) leaving only 5 and 10 to be added later. So, the 10th triangular number is 10 + 10 + 10 + 10 + 5 + 10.
Another interesting way of adding the numbers is to add the first and the last, then the second and the second to last, and so on. This leads to (1+ 10) + (2 + 9) + (3+ 8) + (4 + 7) + (5 + 6). This simplifies to 11 + 11 + 11 + 11 + 11 = 55.
Encourage the students to think like this when they work out the 20th triangular number. So they have to add 1 + 2 + 3 + … + 20 = (1 + 20) + (2 + 19) + … + (10 + 11) = 10 x 21 = 210.
Solution to the Extension
If there are 120 counters, which triangular number do they make? One approach is to take 120 counters and make up a triangle. The number of the counters in the bottom row is the number of the triangular number.
A more efficient strategy is to guess that it is the 12th triangular number. By using what has already been done, students might recognise that it must be between the 10th and the 20th triangular number. Checking with the method above shows that the 12th triangular number is 78. This is still not enough so try again.
Drawing a table, building on what is already known, shows this.
| 10 | 11 | 12 | 13 | 14 | 15 | 16 |
| 55 | 66 | 78 | 91 | 105 | 120 | … |
The 15th triangular number has 120 counters.
Consider also representing triangular numbers in the shape of a staircase.
Terrific Tiles
This is a level 3 algebra strand activity from the Figure It Out series.
A PDF of the student activity is included.
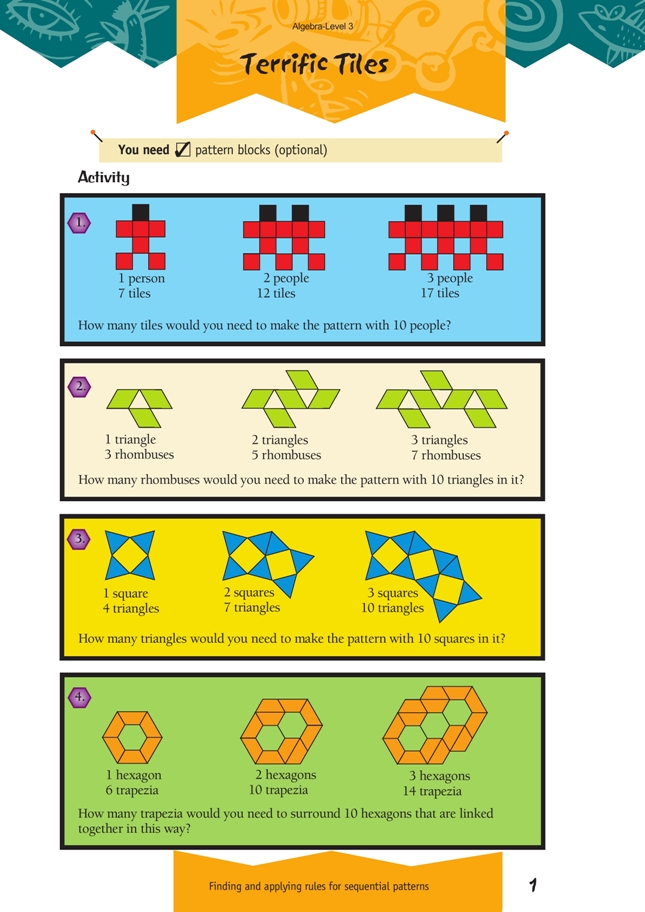
Click on the image to enlarge it. Click again to close. Download PDF (130 KB)
find and apply rules for sequential patterns
pattern blocks (optional)
If students are unsure how to begin these problems, ask them first how many tiles there are in a one-person pattern. Then ask how many extra tiles they will need for each extra person. Suggest that they record the number of tiles needed in a table.
Students should see that each time another person is added, they need five extra tiles. To find out how many tiles they need to make the pattern with 10 people, students can extend their table until they get to 10 people.
Although students are not asked to find a general rule or formula for the pattern, as an extension exercise, you could work with students to find the general rule for the pattern.
You could ask students whether they can see a quick way to count the number of tiles needed for 10 people. They know that five extra tiles are needed for each extra person, so they may say “5 + 5 + 5 + 5 + 5 + 5 + 5 + 5 + 5 + 5 + 2 = 52, which is five tiles for each of the 10 people and two more needed to make the first person”.
You could use this to show them that a shorter way of writing this is 10 x 5 + 2 = 52. So if n stands for the number of people, the general rule is: number of tiles needed for n people = n x 5 + 2.
This can also be developed further in a table:
Students can follow the same procedure to answer the other questions on this page.
Answers to Activity
1. 52 tiles
2. 21 rhombuses
3. 31 triangles
4. 42 trapezia
Building patterns
In this unit students work with growing patterns made from square tiles. Students represent the relationships between pattern number and number of tiles using tables, graphs and rules, in order to predict further terms of the pattern.
- Continue a linear growth pattern from a few examples.
- Find the recursive rule of a linear growth pattern from a table of values.
- Explain why the graph of relationships in the pattern is linear.
- Use the table and recursive rule, and/or the graph to make predictions about other terms of the pattern.
- Attempt to create a general rule that connects term number and number of tiles for any term of the pattern.
A linear number pattern is a sequence of numbers for which the difference between consecutive terms is always the same. If plotted on a number plane the graph of a linear pattern is a straight line.
A progression in the way students process linear patterns is well established in the research. That progression is as follows:
- Copy a spatial pattern with materials.
- Identify change and extend the spatial pattern with materials.
(Make the next term for the pattern). - Represent the relationship between term number and number of items and use recursive rules to predict further members.
(Find the number of items required to make the next term without needing to build it). - Use function (direct) rules to connect term numbers with number with the number of items.
(Find the number of items required to make any given term without needing to know the number for the previous term). - Reverse (direct) rules to find the term number for a given number of items.
(Given a number of items, find which term number would require that many).
Click to download a PDF with further information.
This unit is aimed at achievement of Level 3 in The New Zealand Curriculum, which requires students to develop recursive rules. Level 3 involves progression from phase 2 to phase 3 of the above progression.
The learning opportunities in this unit can be differentiated by providing or removing support to students and by varying the task requirements. Ways to support students to progress through the phases include:
- providing access to materials and restrictions on the terms for prediction. This makes the level of challenge appropriate for students that need to consolidate understanding of the first two phases. Asking for the number of items in the tenth member of a pattern is a good guideline
- providing support in representing the relationship between term numbers and the number of items, using tables, graphs and diagrams for students progressing to the third phase
- providing tasks that push beyond terms easily found with recursive rules for students progressing to the fourth phase (direct rules). Asking for the number of items for the twentieth, fiftieth, or hundredth term is a good guideline
- encouraging sharing and discussion of students’ thinking
- using collaborative grouping so students can support each other and experience both tuakana and teina roles
- encouraging mahi tahi (collaboration) among students.
The unit is based around patterns with square tiles, which is relatively context neutral. It may be that situations from real life motivate your learners. Attention could be given to growing patterns seen in Maori tukutuku panels and Samoan ngatu patterns. The patterns could be contextualised as buildings made of sections, stone paintings (kohutu peita), planting of trees, or fruit ripening in a tray. You might like to discuss situations in which everyday patterns grow in a consistent way, such as saving the same amount of money each week, planting the same number of native New Zealand trees each week, stacks of items in the supermarket, shoes related to the number of people, or chairs on a bus or aircraft.
Te reo Māori vocabulary terms such as tauira (pattern), pānga rārangi (linear relationship), and ture (rule, formula) could be introduced in this unit and used throughout other mathematical learning.
- Square tiles
- Calculators
- Copymaster 1
- Copymaster 2
- Copymaster 3
- Copymaster 4
- Copymaster 5
- PowerPoint 1
- PowerPoint 2
- PowerPoint 3
Getting started (Session One)
The unit begins by looking at the growth patterns of even and odd numbers. It is important that students ‘see’ even numbers as multiples of two, and odd numbers as multiples of two plus or minus one. The lesson also looks at generalisations about what happens when even and odd numbers are added.
- Build the ‘factories’ in the diagram below, using square tiles, drink coasters, or similar square-shaped objects (PowerPoint 1, slides one and two). They could also be constructed digitally (e.g. on a PowerPoint).
How many squares make up the first factory? The second? The third? etc.
What is changing and what is staying the same as the pattern grows?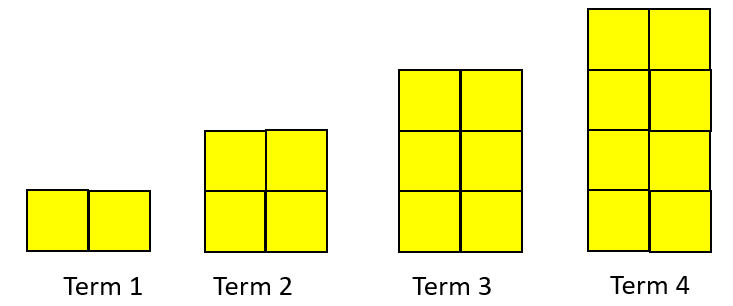
- Let students solve the next problem collaboratively using materials if need be. Their strategies will indicate their current achievement against the progression.
How many squares make up the tenth factory? - Ask the same questions for the pattern on slide two.
- Slide Three presents the two growing patterns on top of one another.
How are these two patterns related? (The terms in the second sequence (odd numbers) are one less than the first sequence.) Ask your students to create tables for the first four terms of each pattern. For example:
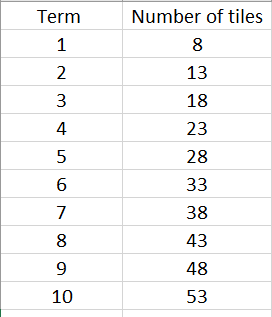
Term 1 2 3 4 10 Number of tiles 2 4 6 8 ? How could the table be used to find the number of squares in term 10?
- Students might notice that the number of tiles goes up by two for each increase of one in the term number. This recursive rule can be used to find any term in the pattern but requires a bit of work.
- If your students can use the ‘add two’ recursive rule to further the table pose the following challenge to encourage direct rules.
If you had to find the fiftieth term in the pattern would you use the ‘add two’ rule? Why not? How would you find the fiftieth term in each pattern? - Let your students collaborate in small teams. They might realise that repeated adding of twos is inefficient and suggest a direct rule, i.e. multiply the term number by two (even pattern) or multiply the term number by two then subtract one (odd pattern).
- Finally use Slides Four and Five to introduce the prediction of combining terms.
You might provide further examples for your students as scaffolding.
Can you predict the result if I join two terms?
How will you describe your method so someone else can use it? - For the even pattern the result of joining terms 3 and 5 is term 8. The general rule is “Add the term numbers and multiply by two.”
- For the odd pattern the result of joining terms 3 and 5 is term 7 in the even pattern (7 x 2 = 14). The general rule is “Add the term numbers, multiply by two, then subtract two.”
For students who develop the rule quickly provide these challenges:
- Kayla joins two terms in the even pattern and gets a total of 40 squares. What can you say about the terms she joins?
- Tipene joins two terms in the odd pattern and gets a total of 40 squares. Which terms might he join?
- Hana finds a rule for joining a term in the even pattern with the same term in the odd pattern. What is her rule?
- If an odd term is taken away from the same even term, how many squares remain? Why?
Session Two
In this session students use a spatial pattern made with square tiles to investigate how relationships that exhibit constant difference are represented with graphs.
- Show your students PowerPoint 2, slide one, which shows a growing pattern. Ask students what they notice about how the pattern grows from one term to the next.
- Ask students: Can you imagine what Term Ten looks like? Describe it to a partner.
Look for students to anticipate ten empty spaces or squares surrounded, on all sides, by square tiles. - Ask students to work with a partner to predict how many square tiles they would need to build Term Ten.
Look for students to:- Use the element of growth to extend the pattern physically (with tiles) or diagrammatically
- Use a table and notice that there is a constant growth of five tiles between consecutive terms
- Extend the repeated addition of five to calculate that 53 tiles are needed
- Use multiplicative direct rules such as 8 + 9 x 5 or 3 + 10 x 5 to find the number of tiles
- Be prepared to extend students who use direct rules with challenges like:
Why do the different rules like 8 + 9 x 5 or 3 + 10 x 5 give the same number of tiles?
How many tiles are needed to make Term 20? Is that twice as much as Term 10? If not, why not?
If you had 998 tiles, what term could you make? Explain. - Share the strategies students used to create term Ten. Discuss efficiency. Go to a spreadsheet or online graphing tool, such as Desmos. Create a table of data from the students’ earlier work. You might highlight using the drop-down capability to repeatedly add five easily.
- Ask students how they might graph the relationship.
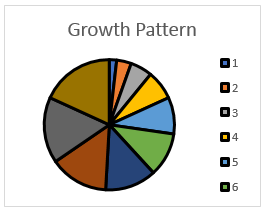
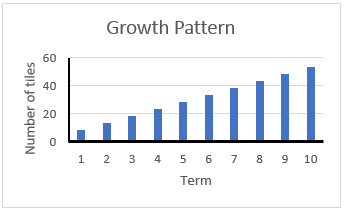
Students might suggest using a familiar type of display, like a bar graph. Use the spreadsheet to create the graphs they suggest. If they do not suggest a scatter plot then make that your choice.
Which graph best shows how the pattern grows?
What do you notice about that graph? - Note that the pie chart is not very useful. Both the bar graph and scatter plot show the constant growth.
- If your students have digital devices you might send them away to create their own graphs. There is also considerable merit in them creating the graphs by hand as they will need to attend to scale, axis labels, location of points and heights of bars.
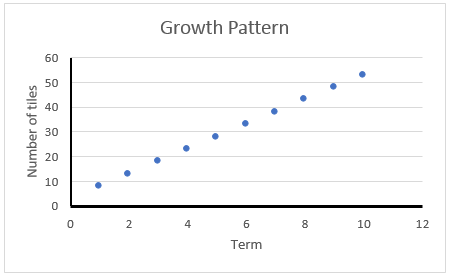
- Gather the class and focus on the scatter plot. Draw students’ attention to specific points and ask what the coordinate represents (an association between a term number and the number of tiles).
As you go up one in the term, how many tiles do you go up by? (five)
How does this “up five” rule show on the graph? (The points are in a straight line)
How could we use our graph to predict the number of tiles for Term 20? (extend the line and see what point matches Term 20- See PowerPoint 2, Slide 2)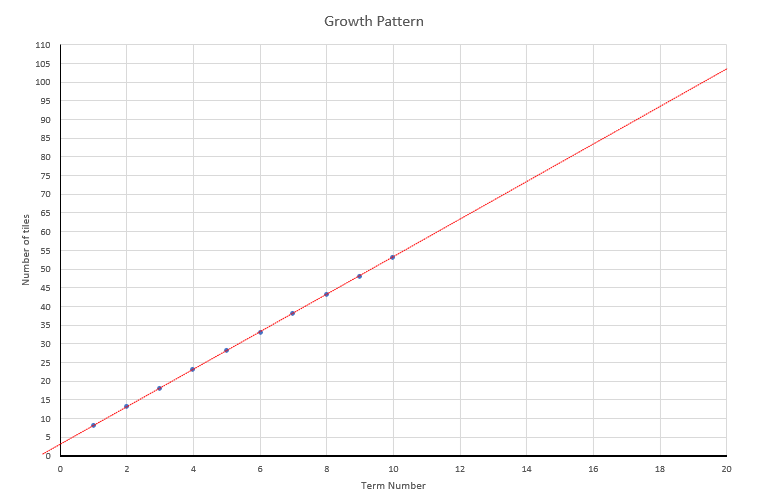
What does this point (20, 103) tell us?
How accurate is this method? Where can it go wrong? (Slope must be exact) - Ask students to find the value of Term 20 using a line on their graph.
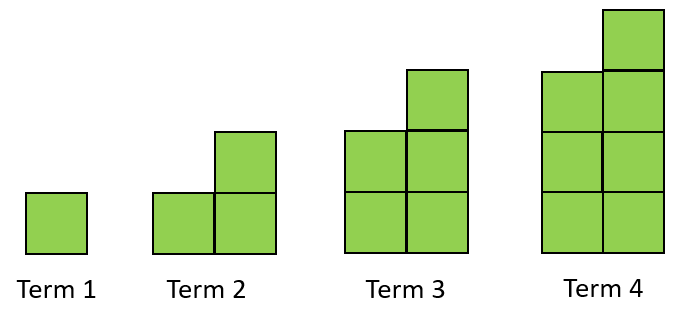
What other terms can you read off from your line? (e.g. Term 15 equals 78) - Introduce Copymaster 1. The pattern is like the previous one in that it grows in a block fashion. However, the constant difference is six rather than five. Slide Three allows you to display the ‘new’ pattern.
- Talk through the requirements of Copymaster 1 then let your students solve the problems in collaborative groups of three or four. Use Slide Four to discuss what each student, Teina, Phillip or Cameron, ‘sees’ in the pattern for Term Four (colour coded).
What would each person write for Term 10? … for Term 30? … for any term number?
Which person’s rule is the most efficient to use? Why?
Session Three
- Use Copymaster 2 to set out six stations for your students to complete. Letting them work independently, or collaboratively in small groups, provides you with an opportunity to observe what students do and interact with them to support their progression. Make sure students have access to square tiles and square grid paper (e.g. exercise book) to support them. You might choose to develop workshops for students who feel they need help with graphing, creating tables, or developing rules. Students should use online graphing packages or spreadsheets to graph the relationships, as well as manually drawing the graphs.
- The answers to each Station are given at the end of Copymaster 2. Expect your students to show agency by checking their own answers, addressing errors, and identifying areas in which they need further support. You might set up a chart for them to indicate whether, or not, they have control of the specific learning outcomes. Copymaster 3 provides an empty template for this:
● Not yet ? Maybe P Yes
| Continue a linear growth pattern from a few terms. | Make a table of values. | Draw a graph. | Use a table or graph to find a term in the pattern. | Create a rule for finding any term in the pattern. |
Annie | P | P | P | P | P |
Tariq | P | P | P | P | P |
Tipene | ? | ? | ? | P | P |
Vey-un | ● | ● | ● | P | P |
Sione | ● | ● | ? | P | ? |
Session Four
In this session you differentiate the class into two groups, those that feel they need more help with patterns, and those who think they can attempt a challenging pattern investigation independently.
- Give the more confident group Copymaster 4 to work on independently or in small groups. Note that numbers 2 and 3 provide enabling prompts for students to support their independent investigation. Students should read the prompts if they are stuck, rather than interrupt your teaching group/s.
- Use PowerPoint 3 with the other group to introduce a structured approach to predicting further terms in a growth pattern. Work through the slides progressively. Points to note are:
- Predictive rules can come from seeing patterns in tables of values and/or structure in the figures, e.g. four arms that grow
- Different ways of seeing lead to different rules
- Rules for any term can be found by looking for similarities among specific terms
- With linear relations graphs can be used to predict further terms.
- After a suitable period, bring together the two groups to share their learning. Bring out the similarity of the two problems, which are both applications of linear relationships.
- Students could work collaboratively on problems from Visual Patterns for further practice.
Session Five
Copymaster 5 provides a task that can be used to assess your students. They will need access to a calculator. You might also provide the students with square grid paper to make sketching the yacht pattern easier.
Let your students work independently and use the data to check their achievement against the criteria in Copymaster 3. Students might exchange worksheets so you can mark the task collectively.
Dear parents and whānau,
This week in algebra we have been looking at patterns made with squares tiles and how these patterns can be continued. We have looked at different ways to predict how the patterns continue. A recursive rule tells you how to go from the number of squares in one figure to the number of squares in the next. A general rule is a rule that gives you the number of squares for any term in the pattern.
Biscuit Binge
This is a level 3 algebra strand activity from the Figure It Out series.
A PDF of the student activity is included.


Click on the image to enlarge it. Click again to close. Download PDF (416 KB)
use a graph to show relationships in sequential patterns
a digit wheel
FIO, Level 3, Algebra, Biscuit Binge, pages 14-15
square grid paper
Activity One
Encourage students to use a spreadsheet to develop their charts. Some students may compare the charts and notice that if one person ate two biscuits a day and another ate three a day, then the answers are the same as if one person ate five biscuits a day. Or they may notice that the totals for two and a half biscuits a day are half the totals for five biscuits a day.
Activity Two
You may need to remind students that usually the constant variable (in this case, the days) is on the x axis (the horizontal axis) and the variable that changes is shown on the y axis (the vertical axis).
Students will need to vary the numbers on the y axis so the graphs are a manageable size.
Activity Three
This activity shows different ways of recording patterns. Because they are on a base of 10, the patterns can be explained as multiples of the rate per day, for example, 0, 3, 6, 9, 12, 15, 18, 21, 24, and 30. The pattern has gone around the digit wheel three times before each digit is visited.
The number visited is the ones digit of the total number of biscuits eaten.
Make sure that students understand how the digit wheel works. You could work through question 1 with them. First, complete Sigmund’s three-biscuit-a-day chart.
Ask students to identify the ones digits in the biscuit totals. The ones digit pattern is: 0, 3, 6, 9, 2, 5, 8, 1, 4, 7, 0.
You could suggest that students use this method to complete the digit wheel: “Start at the 0 on the digit wheel. Draw a line to the next digit in the pattern (3). Draw another line to the next digit (6). Continue until you reach the end of the digit pattern.”
Encourage students to explain the process in their own words and compare the patterns they have developed on the digit wheel for question 2. Useful questions include:
“How many times do you have to go around each digit wheel before you have touched each digit?”
“What do you notice about the wheels for even numbers of biscuits eaten each day? Can you explain why this happens?”
“Which biscuit-a-day patterns eventually touch all the numbers?”
“Can you explain the five-biscuit-a-day pattern?”
Answers to Activity
Activity One
1.
2. Answers will vary. A possible answer is: The total of the biscuits increases evenly in each chart by the number of biscuits eaten that day. To find the total number of biscuits eaten, multiply the number of days by the number of biscuits eaten each day.
Activity Two
1. 3 biscuits each day
2. Numbers along the vertical axis will vary. Some
possible graphs are:
3. Answers will vary. A possible answer is: The points on the graphs are evenly spaced according to the number of biscuits eaten that day. The points lie on a straight line. This is because the difference between points is the same (for example, in b, 4 up for every 1 across).
Activity Three
1.
The 3-biscuits-a-day pattern creates a star polygon.
You may see other patterns.
2. Answers will vary. Some examples (using the ones digit of the biscuit numbers):
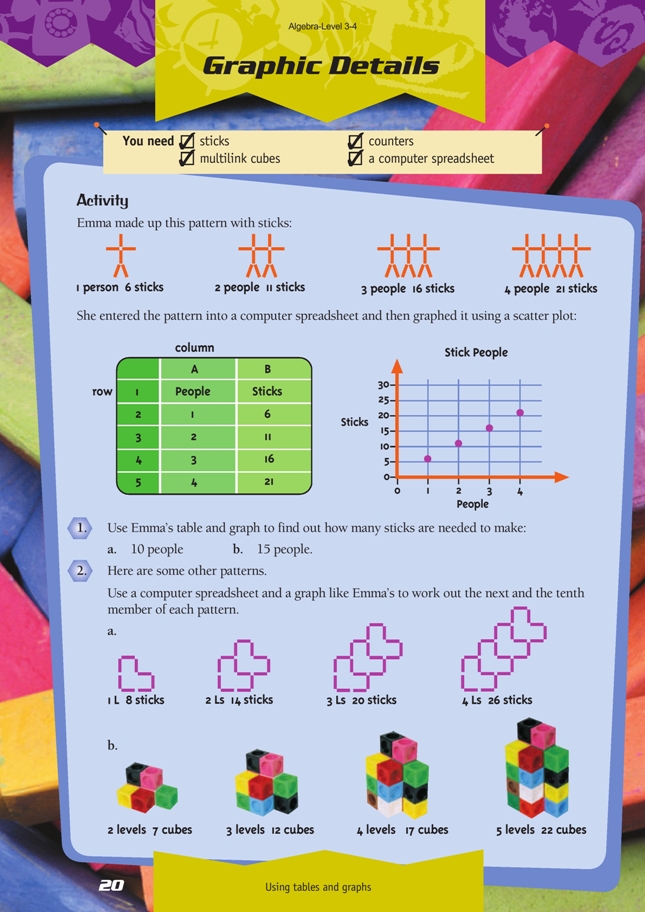
Graphic Details
This is a level 3 algebra strand activity from the Figure It Out series.
A PDF of the student activity is included.
Click on the image to enlarge it. Click again to close. Download PDF (374 KB)
continue a sequential pattern
sticks
multilink cubes
FIO, Level 3-4, Algebra, Graphic Details, page 20
computer spreadsheet
The students can use both the tables and the graphs to predict the values of further terms in each pattern.
The table below shows Emma’s problem extended to the tenth and the fifteenth person.
The graph of the first four terms is a straight line (hence, the relationship is linear). This line can be extended to predict the values for the tenth and fifteenth terms.
The students can use formulas on a spreadsheet to find further values of a sequence. The spreadsheet table for Emma’s sequence shows that when the number of people increases by one, the corresponding increase in the number of sticks is five. Instead of writing “2” in cell A3, the students could input the formula (rule) =A2+1 and fill it down for as many cells as desired. Similarly, they could input the formula =B2+5 in cell B3 and fill it down to give the matching number of sticks.
These rules can be adapted for the spreadsheets for question 2. For example, for 2a, the formula for the number of sticks in cell B3 is =B2+6 and for 2b, the formula in cell B3 is =B2+5.
Answers to Activity
1. a. 51 sticks
b. 76 sticks
2. a. The computer spreadsheet should look like this:
The graph could look like this:
The next member of this pattern is 32 sticks and the tenth member is 62 sticks.
b. The computer spreadsheet should look like this:
The graph could look like this:
The next member of this pattern is 27 cubes, and the tenth member is 52 cubes.