This activity gets students to represent fractions as percentages and to find percentages of money amounts using double number lines and 10 by 10 grids.
Decimals and percentages are special cases of equivalent fractions. For example, 75 percent is equivalent to 75/100, which is equivalent to 3/4 and many other fractions, such as 6/8, 15/20, and 30/40. Percentages can be used either as operators (scalars), to enlarge or reduce an amount by a given proportion, or as proportions in their own right. Just like fractions, they are used as both operators and numbers. For example, “20 percent of 35” treats 20 percent as an operator, and “6/24 is equivalent to 25/100 or 25 percent” treats 25 percent as a number.
The first part of the activity treats percentages as numbers. It uses the hundredths grid to convert common fractions like 1/5, 1/4 , and 1/10 to percentages. The students can draw 10 by 10 grids in their exercise books and shade the appropriate fraction of the grid. Alternatively, you could give them cut-out squares to fold into the fractional parts.
Encourage the students to look for connections between the fractions and the corresponding percentages. Consider these connections:
From their experiences with percentages in contexts such as test marks and sports statistics, many students believe that percentages cannot be larger than 100, since 100 percent represents 1 or the whole. However, there are many real-life contexts, like lambing and calving rates and investment growth, in which percentages greater than 100 do occur. (If a farmer gets twice as many lambs as he has ewes, the lambing percentage is 200 percent.) Encourage the students to generalise this:
1 = 100 percent, so 2 = 200 percent, so 4 = 400 percent, and so on.
Question 2 involves using percentages as operators. The students’ book uses a hundredths grid to show this. If, for example, 30 percent of a grid is shaded, the grid can be used to find 30 percent of any amount:
Note that with the hundredths grid, the value of each small square, or hundredth, of the amount can be calculated if necessary and is equivalent to 1 percent. For example, 1 percent of $65 is 0.65 (65 cents) because 65 ÷ 100 = 0.65. So 32 percent of $65 could be calculated by 0.65 x 32 or by adding 0.65 + 0.65 to 30 percent of $65.
A double number line can also be used to find a percentage of any amount. For example, 30 percent of $48 can be shown as:

Double number lines allow the students to solve difficult percentage problems by connecting and co-ordinating more manageable calculations. The double number line reflects the multiplicative relationship between the fraction and the percentage. For example, consider the problem “35 percent of $56”. The order of calculation might be: 10 percent of 56 is 5.60, so 30 percent of 56 is 3 x 5.60 = 16.80, and 5 percent of 56 is 1/2 of 5.60 = 2.80. 35 percent is 30 percent + 5 percent = $19.60.
For more ideas on how to develop double number lines to solve percentage problems, refer to pages 31–34 of Book 7: Teaching Fractions, Decimals, and Percentages in the Numeracy Project series.
Extension
To challenge the students further, pose problems where the conversions to percentages are not tidy and the students need to approximate the answer. You can do this by making the percentage and the money amount untidy, for example, “find 67 percent of $47.95”. In real-life situations, it is often enough to estimate the answers to such problems. 67 percent is about two-thirds, $47.95 is about
$48.00. 2/3 of 48 is 32. So $32 is a close estimate.
Encourage the students to use rounding and their knowledge of percentage to fraction conversions to help them estimate the answers to percentage problems.
Answers to Activity
1. Yvette. 1/5 is 2/10. 1/10 = 10%, so 1/5= 20%.
.gif)
Leonie
1/2 = 50%, and 1/4 is half of 1/2 , so 1/2 of 50% must be 25%.
Andrew
Yes, you can. 110% would be 1 more than 1.
2. a. Answers and a possible method for each (based on one of the ideas shown) are:
i. $11. 10% or 1/10 of 55 is 5.50. So 20% is 2 x 5.50 = $11.00
ii. $12. 10% of 80 is 8. 5% is 4. 8 + 4 = $12
iii. $52
iv. $21
v. $38. 95% is 100% – 5%. 10% of 40 is 4, so 5% is 2. 40 – 2 = $38.
vi. $60. 100% of 48 is 48. 25% of 48 is 12. 48 + 12 = $60.
b. Discussion and opinions will vary. (All the methods will work.)
c. Answers and a possible method for each (based on one of the ideas shown) are:
i. $14.40. 50% of 36 is 18;
10% of 36 is 3.60; 18 – 3.60 = $14.40
ii. $28. 10% of 35 is 3.50;
3.50 x 8 = $28
or 35 – 3.50 – 3.50 = $28
iii. $15.60. 50% of 24 is 12;
10% of 24 is 2.40; 5% of 24 is 1.20;
12.00 + 2.40 + 1.20 = $15.60
iv. $12

Pondering Percentages
This is a level 4 number activity from the Figure It Out series. It relates to Stage 7 of the Number Framework.
A PDF of the student activity is included.
Click on the image to enlarge it. Click again to close. Download PDF (449 KB)
find a percentage of a whole number
Number Framework Links
Students will need to be able to use advanced multiplicative strategies (stage 7) or higher to work on this activity independently.
FIO, Levels 3-4, Number Sense and Algebraic Thinking, Book One, Pondering Percentages, pages 12-13
This activity gets students to represent fractions as percentages and to find percentages of money amounts using double number lines and 10 by 10 grids.
Decimals and percentages are special cases of equivalent fractions. For example, 75 percent is equivalent to 75/100, which is equivalent to 3/4 and many other fractions, such as 6/8, 15/20, and 30/40. Percentages can be used either as operators (scalars), to enlarge or reduce an amount by a given proportion, or as proportions in their own right. Just like fractions, they are used as both operators and numbers. For example, “20 percent of 35” treats 20 percent as an operator, and “6/24 is equivalent to 25/100 or 25 percent” treats 25 percent as a number.
The first part of the activity treats percentages as numbers. It uses the hundredths grid to convert common fractions like 1/5, 1/4 , and 1/10 to percentages. The students can draw 10 by 10 grids in their exercise books and shade the appropriate fraction of the grid. Alternatively, you could give them cut-out squares to fold into the fractional parts.
Encourage the students to look for connections between the fractions and the corresponding percentages. Consider these connections:
From their experiences with percentages in contexts such as test marks and sports statistics, many students believe that percentages cannot be larger than 100, since 100 percent represents 1 or the whole. However, there are many real-life contexts, like lambing and calving rates and investment growth, in which percentages greater than 100 do occur. (If a farmer gets twice as many lambs as he has ewes, the lambing percentage is 200 percent.) Encourage the students to generalise this:
1 = 100 percent, so 2 = 200 percent, so 4 = 400 percent, and so on.
Question 2 involves using percentages as operators. The students’ book uses a hundredths grid to show this. If, for example, 30 percent of a grid is shaded, the grid can be used to find 30 percent of any amount:
Note that with the hundredths grid, the value of each small square, or hundredth, of the amount can be calculated if necessary and is equivalent to 1 percent. For example, 1 percent of $65 is 0.65 (65 cents) because 65 ÷ 100 = 0.65. So 32 percent of $65 could be calculated by 0.65 x 32 or by adding 0.65 + 0.65 to 30 percent of $65.
A double number line can also be used to find a percentage of any amount. For example, 30 percent of $48 can be shown as:
Double number lines allow the students to solve difficult percentage problems by connecting and co-ordinating more manageable calculations. The double number line reflects the multiplicative relationship between the fraction and the percentage. For example, consider the problem “35 percent of $56”. The order of calculation might be: 10 percent of 56 is 5.60, so 30 percent of 56 is 3 x 5.60 = 16.80, and 5 percent of 56 is 1/2 of 5.60 = 2.80. 35 percent is 30 percent + 5 percent = $19.60.
For more ideas on how to develop double number lines to solve percentage problems, refer to pages 31–34 of Book 7: Teaching Fractions, Decimals, and Percentages in the Numeracy Project series.
Extension
To challenge the students further, pose problems where the conversions to percentages are not tidy and the students need to approximate the answer. You can do this by making the percentage and the money amount untidy, for example, “find 67 percent of $47.95”. In real-life situations, it is often enough to estimate the answers to such problems. 67 percent is about two-thirds, $47.95 is about
$48.00. 2/3 of 48 is 32. So $32 is a close estimate.
Encourage the students to use rounding and their knowledge of percentage to fraction conversions to help them estimate the answers to percentage problems.
Answers to Activity
1. Yvette. 1/5 is 2/10. 1/10 = 10%, so 1/5= 20%.
Leonie
1/2 = 50%, and 1/4 is half of 1/2 , so 1/2 of 50% must be 25%.
Andrew
Yes, you can. 110% would be 1 more than 1.
2. a. Answers and a possible method for each (based on one of the ideas shown) are:
i. $11. 10% or 1/10 of 55 is 5.50. So 20% is 2 x 5.50 = $11.00
ii. $12. 10% of 80 is 8. 5% is 4. 8 + 4 = $12
iii. $52
iv. $21
v. $38. 95% is 100% – 5%. 10% of 40 is 4, so 5% is 2. 40 – 2 = $38.

vi. $60. 100% of 48 is 48. 25% of 48 is 12. 48 + 12 = $60.
b. Discussion and opinions will vary. (All the methods will work.)
c. Answers and a possible method for each (based on one of the ideas shown) are:
i. $14.40. 50% of 36 is 18;
10% of 36 is 3.60; 18 – 3.60 = $14.40
ii. $28. 10% of 35 is 3.50;
3.50 x 8 = $28
or 35 – 3.50 – 3.50 = $28
iii. $15.60. 50% of 24 is 12;
10% of 24 is 2.40; 5% of 24 is 1.20;
12.00 + 2.40 + 1.20 = $15.60
iv. $12
Numeracy Project materials (see Numeracy Books page)
Using double number lines or percentage strips:
• Book 4: Teaching Number Knowledge
Equivalent Fractions, Decimals, and Percentages
• Book 7: Teaching Fractions, Decimals, and Percentages
Fractional Blocks
Deci-mats
Hot Shots
Scaling our school
In this unit we estimate the length and height of buildings at our school. We compare these estimates with the actual heights or lengths and build scale models. Students select appropriate scales using ratio to translate the real dimensions into the dimensions for the scale model.
Estimation is about getting an approximation of the size of something that is appropriate for a purpose. For example, a painter might estimate the wall area of a school building for the purpose of buying paint or quoting for a job. They might measure the length and width of the building or use stride lengths to approximate the dimensions. A key feature of estimation is the use of trusted benchmarks that are used to estimate with. The painter might know that their stride is about 60cm so 10 strides are equivalent to 6 metres. Measurements of length can also be determined by accurate use of tape measures. In this unit, students estimate the height and length of buildings within their school grounds and then use indirect methods of measurement to determine the actual height.
To build a scale model of the school students need to understand the concept of ratio. A ratio compares two measures. For example, a scale model that uses the ratio 1:10 can mean that 1 metre on the scale model is equivalent to 10 metres in real life. That would mean a building that is 15 metres long will be 1.5 metres long in the scale model. Obviously, a model that is 1.5 metres long is too big so choosing a useful ratio is important. A 1:100 scale would mean that 15 metres becomes 15 centimetres in the scale model. That seems a more useful size. In this unit students gain a sense of the size of measurement units to create accurate estimates and build functional models.
The learning opportunities in this unit can be differentiated by providing or removing support to students and by varying the task requirements. Ways to differentiate include:
The context for this unit is to create a model of the students’ own school. You might choose accessible building complexes that are significant to your students, such as a Marae or community centre. You could also create scale models of important buildings from around the world. Alternatively, consider what links this might encourage to learning from other curriculum areas - if you are currently learning about the history of your local area, perhaps you could build models of heritage buildings or local pā.
Te reo Māori kupu such as ōwehenga (ratio), āwhata (scale), ine (measure), mahere āwhata (scale map), and hoahoa āwhata (scale drawing) could be introduced in this unit and used throughout other mathematical learning.
Getting Started
Can someone explain what a scale model is?
How can we create a scale model?
What will we need to make it?
I want you to take photographs of the building you have been assigned. You will need enough photographs to construct several views of the building so you can make a scale model. What might you need to consider before you go out?
Students might make a list of considerations such as:
Exploring
Get students, in groups, to choose an appropriate method to measure the actual length, width, and height of their building. Once the measurement is complete put the data in a table. You might stop students after a few minutes, and get them to share their thinking with another group, in order to check that all student groups are on track.
Was there a large difference between the estimated dimensions of your building from your photographs and the actual measurements? Why may that have happened?
What does ‘in proportion’ mean? (The corresponding lengths of the real building and the model are in the same ratio)
What is the length, width, and height of this building?
Use the squares in your book to draw a scale drawing.
Using the table of actual building dimensions, ask:
Architects usually use ratios of 1:100, 1:150, 1:300, etc.
Why do you think they do that?
The scale needs to allow for easy conversion of lengths and the scale model has to be the right size for viewing.
What scale can we use for our models that will work for these dimensions?
If we use a scale of 1cm:1m (1cm:100cm) how long will out model of the Admin Block be?
1:100 is feasible as a 44m long building will need a model that is 44cm long.
1cm:2m is also feasible as it means a 44m long building will need a model that is 22cm long.
Record the selected ratio symbolically, e.g., 1:200.
Create a table of referent measures to support students to make their models. For example:
Are the proportions correct?
Will your building fit with the other buildings in the school model?
Sharing
Convince another group that your scale model is in proportion to their model.
What things would you change if you were going to create the model over again?
How can we locate each model in the correct place? (Using a co-ordinate system is useful way to do that.)
How might we use the Google Map image to guide where we locate each model building?
Dear family and whānau,
This week we have been looking at estimating the length and height of buildings at school. We have compared these estimates with the actual heights or lengths and are building a scale model of the school.
Ask your child to draw a scale drawing of one room at home. Discuss with them what measurements they will need and how they will do this. They could turn their scale drawing into a 3-D model using cardboard recycled from empty packages or boxes.
This is to That
This unit focuses on ratios that illustrate relationships between two different measures with the same unit, for example, 100g almonds for every 200g of hazelnuts. Part-whole fractions in ratios are also explored.
Ratios, proportions, and fractions are all related concepts that appear in both real life and mathematical situations. This unit is an introduction to ratios, and relates ratios to proportion and fractions. In mathematics, ratios and proportions are fundamental to trigonometry, coordinate geometry and calculus.
Ratio can be applied to contexts such as preparing meals for large gatherings at a Marae, interpreting the scale on a map, mixing substances like paint, fertiliser and cement, and looking for patterns and differences between groups in statistics.
Simply put, a ratio is a relationship between two measures with the same unit. For example, in making cement a worker puts in 1 measure of cement for every 4 measures of builders’ mix. The ratio is 1:4. The dry mix has a total of 5 measures, 1/5 is cement and 4/5 is builders’ mix.
The learning opportunities in this unit can be differentiated by providing or removing support to students and by varying the task requirements. Ways to differentiate include:
The contexts for this unit involve collections of discrete objects. The unit uses contexts like mixing fruits and nuts, and scale models. These contexts might be supplemented by, or enhanced with, other contexts involving ratios of discrete objects that are of special interest to your students. Examples might include ratios in cooking, ratios of positions in sports teams or genders in a class, ratios of colours in a smarties packet, and ratios of animals at a waterhole. Consider how you can utilise the learning in this unit as a way to make connections between mathematics and your students' 'real-world' contexts.
Te reo Māori kupu such as ōwehenga (ratio), hautanga (fraction), whakarea (multiplication, multiply), and pāpātanga (rate) could be introduced in this unit and used throughout other mathematical learning.
Session 1
In this session we look at the idea of ‘twice as many’ and its variations. There are several ways to demonstrate the idea of scaling using multiplication. Adapt the contexts reflected in these problems to situations that work with the resources in your classroom, and that appeal to the interests of your students.
Look for students to identify that all four problems involve “twice as many.”
What operation did you use to solve the problems?
Record the operations using multiplication:
2 x 6 = 12 2 x 9 = 18 2 x 3 = 6 2 x 43 = 86
Record the ratio 1:2
What does this ratio mean? How is it related to the problems?
Take an example, For every dollar that Laslo earns, Martine earns two dollars.
There are 7 boys. How many girls are there? (21)
How many dancers are in the troupe altogether? (28)
What fraction of the troupe is made up of boys? (7/28)
What fraction of the troupe is made up of girls? (21/28)
What ratio is there of boys to girls? (1:3)
Can you simplify the fractions for boys and girls? (1/4 and 3/4).
Players take turns to roll the dice and nominate which cell they will fill in. Suppose a player rolls four and nominates 6 x then they put ‘six times as many as four’, 24, on their score card.
Play continues until both players fill their scoreboard. Once a ‘times as many’ option is used it cannot be used again. The player with the highest total wins.
Session 2
In this session, the concept of ratio is applied in more depth. Continue to adapt the contexts reflected in this session's problems to better suit the interests, cultural backgrounds, and current learning foci that are relevant to your students.
If I have 10 blocks and you have 5 blocks I have twice as many as you and we say that the ratio of the number of blocks I have, to the number you have, is 2:1 – two to one.
Examples might be mixing apple juice and orange juice in a 3:1 ratio or a boy to girl ratio of 2:1 in the football team.
In the punch bowl are 8 litres of apple juice and 4 litres of orange juice.
What is the ratio of apple to orange?
Hone kicked over 9 goals but missed 3. What was the ratio of goals to misses?
“There is twice/three times as many of one thing than the other.”
Can you use more than ten squares in each ratio picture?
Secondly, ask students to make up their own ratios and draw yellow and red squares in that ratio.
Is it possible to have ratios 3:2?
What does this mean?
Give me some examples.
Suppose that Hare has apples to oranges in the ratio of 2:1 and oranges to bananas in the ratio of 2:3.
If Hare has 15 bananas, how many apples does he have?
Let students attempt the problem in pairs.
A solution looks like this:
Look at the ratio of oranges to bananas:
2:3 = □:15 meaning that 2:3 and □:15 are equivalent ratios.
□ = 10 because 15 ÷ 3 = 5 and 2 x 5 = 10. Hare has 10 oranges.
Now consider the ratio of apples to oranges:
2:1 = □:10 meaning 2:1 and □:10 are equivalent ratios.
There are twice as many apples as oranges, so the number of apples equals 20.
A ratio table can be used to track the steps. Model the construction of this, and allow students the opportunity to contribute to the filling out of the table.
Pose a similar problem with other ratio for students to work out. For example:
Monkey has apples to oranges in a ratio of 1:3 and oranges to bananas in a ratio of 2:5.
If monkey has 12 oranges, how many apples and bananas does she have?
A ratio table of the problems is shown below. Continue to model the construction of this, whilst gradually releasing responsibility and asking students to fill out an increasing amount of the table.
Ask your parents or caregiver when they use ratios.
Session 3
In this session we look at more situations with ratios.
Suppose that Hare had apples to oranges in the ratio of 2:1 and oranges to bananas in the ratio of 2:1.
What is the ratio of apples to bananas?
How can you convince me of this?
Is the ratio the same no matter how many apples Hare has? Yes.
Show this by example.
If Hare has 12 apples, how many bananas does he have? (3)
If Hare has 20 apples, how many bananas does he have? (5)
If Hare has 16 apples, how many bananas does he have? (4)
How can you explain this?
Use a ratio table to show why the number of bananas is always one quarter of the number of apples. Model some of the construction of this, or ask students to complete in independently or with a partner.
In general, this can be shown algebraically as:
The ratio connecting the number of apples, oranges, and bananas can be written as 4:2:1.
Session 4
In this session students investigate the link between ratios and part-whole fractions.
Bring the class together with their drawings.
Choose an example of a simple ratio (2:1 would be ideal).
How many squares are red?
How many squares are blue?
How many coloured squares are there altogether?
What fraction of the squares is red?
What fraction of the squares is blue?
Note with the last two questions there are different ways to express the part-whole fractions. For example, in the ratio 8:4 the fraction that is red is 8/12 or 4/6 or 2/3 and the fraction that is blue is 4/12 or 2/6 or 1/3.
Start to draw up a table like the one below.
What patterns do you see? (There are always twice as many red squares as blue squares. The same simplified fractions occur. There can be different total numbers of squares)
What patterns do you see?
I have a mixture of black and white marbles in a ratio of 3:5.
There are 64 marbles in total. How many marbles are there of each colour?
Session 5
In this session students consider how part-whole fractions can be expressed as ratios.
If someone was sick this week and needed to catch up, what would you tell them about ratios?
Leah takes a packet of mixed nuts from the pantry.
She notices that one fifth of the nuts are brazil nuts, one third are hazelnuts, and seven fifteenths are cashews.
There are 30 nuts in the packet. What is the ratio of brazil nuts to hazelnuts to cashews?
Make sure the word version of the problem is visible and let students work in small teams to solve the problem. Provide materials, like counters if needed.
The solution is a ratio of Brazil:Hazelnut:Cashew of 6:10:14 that can be simplified to 3:5:7.
Show the students a table containing important information in the problem but with some omissions to complete.
If you had this information about Leah’s bag of nuts, how would you complete the cells?
Students should comment that 1/3 of 30 equals 10 and 7/15 of 30 equals 14. They should also notice that 10/30 = 1/3.
Tell students that you are going to "go nuts" and give them another problem. They will need a blank table to keep track of the clues and find the answer.
Three fifths of the nuts are hazelsnut.
There are 15 brazil nuts.
The total bag of nuts holds 100.
What is the ratio of brazils:hazelnuts:cashews?
Let students work in groups to solve the problem. Roam the room to see if the students are explaining ideas to each other and justifying those ideas. For example:
The number of hazelnuts is 3/5 of 100. That is 60 hazelnuts because 1/5 of 100 equals 20.
That means the number of cashews equals 100 – 15 – 60 = 25.
The fractions are 15/100 = 3/20 (brazil nuts) and 25/100 = 1/4 (Cashews).
The ratio of Brazil: Hazelnut: Cashew is 15:60: 25 = 3: 12: 5.
Drawing a diagram will illustrate that the total of the numbers forms the denominator, and the fractions are formed by using each number as a numerator.
In the 2:3:5 ratio the denominators are 2 + 3 + 5 = 10.
The fractions are 2/10, 3/10, and 5/10. 2/10 and 5/10 can be simplified to 1/5 and 1/2.
Family and whānau,
This week we have been investigating ratios. For homework this week students are looking for examples of ratios around their homes and reporting back. It would be appreciated if you could help your child find examples of ratios and share examples of how you may use them in your home and work (for example mixing things like cement or liquids, in cooking, or measuring). Sometimes things such as Matchbox cars or trains models will have a ratio recorded on the underside, or scales on maps, or packaging for plant fertiliser etc. Ask your child to explain what the different ratios they find mean. Students will bring their examples back to class to create a display. Thank you for your support.
Choices
This unit is about making best option decisions in real-life situations based on cost. Common examples of such decisions are explored, including the cost of taxis, cooking times, hire cars, and mobile phones.
The mathematics in this unit involves relationships between variables. A variable is a measure that can take up different values. For example, when making decisions about rental cars, customers relate two variables, number of kilometres or days (distance or time) and amount of money (cost).
Most situations define the roles that the variables take. When hiring a car, it is the distance or time, that is the independent, or explanatory variable. An explanatory variable is the variable that explains changes in the other variable, cost. You expect that travelling more kilometres will cost more. Cost is the dependent, or response, variable.
In this unit the relationships are mostly linear. That means there is a constant growth in the response variable, as constant growth occurs in the explanatory variable. For example, Booma Rentals hires cars at $30 per day plus $0.10 per kilometre. The relationship between cost and kilometres is linear, since you pay 10 cents more for every kilometre. If a linear relation is graphed the ordered pairs (co-ordinates) lie on a straight line.
The learning opportunities in this unit can be differentiated by providing or removing support to students and by varying the task requirements. Ways to support students include:
Tasks can be varied in many ways including:
The context for this unit can be adapted to suit the interests and cultural backgrounds of your students. Most students nowadays own a mobile phone or know someone who does. Rental cars and taxis are a more familiar context for urban students so be aware that other forms of rental or journey may be more appropriate to rural students, e.g. delivery fees for products. Cooking times of meats can easily be changed to include cooking times of roasting vegetables or other foods. There may be contexts involving rates that are more relevant to your students. Examples might include hire-to-buy schemes, money earned for jobs such as serving at a café or dairy, cost of shipments of hay (delivery charge + cost per bale), water and electricity charges (line + amount per kilowatt hour).
Teachers’ Notes
Encourage your students to choose appropriate forms of calculation, depending on the complexity of the operations and numbers involved. Mental calculation, recording in written form, and digital devices are all legitimate options. In your discussions ask the class how they got the answers and what methods they used to do the calculations.
Session 1
Who has ridden in a taxi recently? Why did you go in a taxi? (Slide One)
How did the taxi driver calculate the fare? (Slide Two)
Why was there a dollar amount on the meter before you even started off?
Tiki Taxis charge $5 flag fall and $3.00 per kilometre. (Slide Three)
Discuss the meaning of “per kilometre” as a rate “for every kilometre travelled.”
Use Slide Four to show the problems:
Work with a partner to solve the problems together.
How much would it cost you to travel 25 kilometres in the cab?
How much would it cost you to travel 32 kilometres in the cab?
How far could you go for $41?
How far could you go for $77?
Share and korero about your thinking with another pair or group.
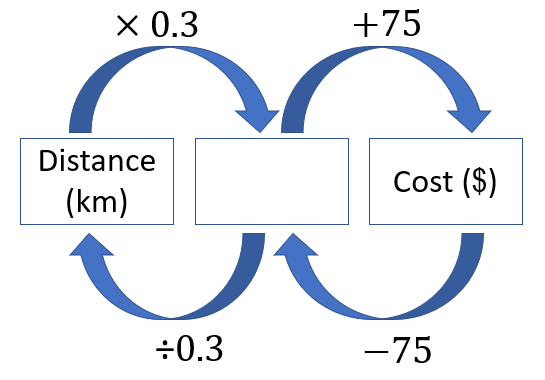
You might use a flowchart like this:
Ask:
Why is the order that we carry out the operations important?
How do we find the distance if we are given a fare?
You might decide to record equations for the flowchart processes. Define the variables; f represents the fare in number of dollars, and d represents the distance in number of kilometres.
If we start an equation, f=, what do we include to show how the fare is calculated, what fare is equal to? (f = 3d + 5)
If we start an equation, d=, what do we include to show how the distance is calculated, what distance is equal to? (d = (f – 5)/3). In this case pay special attention to the vinculum in a fraction also being a symbol for division.
Do you see any pattern? (Student might notice that the graph is linear)
Why do you think the points lie on a line? (Same rate of $3 per kilometre)
What do you notice?
Can we work out fares and distances using the graph? How?
What would the fare for 30 kilometres be? ($95)
What is the distance of a fare that costs $65? (20 km)
Animating Slide 7 shows how the answers can be read off the axes.
Tiki Taxis find they are not making enough money to cover their costs, and to give their drivers a decent wage.
Which option is better, if they want to make more money?
Raise flagfall to $10.00
or
Increase the rate to $3.50 per kilometre
What does the graph show? (An increase in flagfall of $5 gives more income than an increase in rate of $0.50 per kilometre up to 10 kilometres)
How far do you think most taxi trips are? (Create some make-believe trips online using Google Maps and use the distance function)
What recommendations would you make to the owners of Tiki Taxis?
Session 2
What does 43 kilograms per capita mean? (An average of 43 kilograms for every person)
Discuss the fact that this might include bones as well as meat, but every person includes little children and elderly people who eat relatively little.
How many whole chickens make up 43 kilograms? (invite predictions then move to Slide Two)
What operation should we perform? (43 ÷ 1.2 = 35.83)
Therefore, kiwis average nearly 36 whole size 12 chickens per year. That’s three chickens every month!
How long should you cook a size 12 chicken?
What calculation should you perform? (1.2 x 55 + 20 = 86)
How long should you roast a size 18 chicken for? 1.8 x 55 + 20 = 119
If a chicken should be roasted for 97 minutes, what mass is the chicken? (97 – 20) ÷ 55 = 1.4
If a chicken should be roasted for 75 minutes, what mass is the chicken? (75 – 20) ÷ 55 = 1.0
What pattern do you notice? (Linear)
Why does this pattern occur? (Constant rate of 55 minutes per kilogram)
How is this situation the same as the rental car situation? (A constant rate and fixed time. The fixed time has a similar effect as flagfall in the rental car situation). Share and korero about your thinking with another pair or group.
Students may be able to relate roasting a chicken to their knowledge of cooking chicken in a hāngi. How long should chicken be cooked for in a hāngi? Does cooking time increase if more chickens are being cooked? Why or why not?
In the Aotearoa New Zealand, it is becoming more common to cook a turkey to celebrate Christmas with whānau. Commercial turkeys are much larger than chickens and have a mass of between 3.6 and 10.8 kilograms, etc.
Let students work on the problems collaboratively with support from digital graphing tools and calculators. Solutions are below:
The relationship is close to linear.
The amount of cooking time goes up by a little over 15 minutes for each extra kilo. For example, between the point (8, 210) and (10, 240), mass increases by 2 kilograms and cooking time increases by 30 minutes. That is 15 minutes per extra kilogram. Students may recognise that their rule should begin as t = 15m but a fixed amount of time needs to be added. They might take any point, say (8, 210), and use it to work out the extra fixed amount.
8 x 15 = 120
120 + 90 = 210
The rule is t = 15m + 90 and can be tested using other known masses and times. For example, 15 x 10 + 90 = 240 minutes.
15 x 7 + 90 = 195 minutes
Why might that be?
Chickens take an extra 55 minutes per kilogram compared to 15 minutes extra for turkeys. Mostly that is because a much larger bird takes way longer in the oven to reach a cooking temperature (90 minutes vs 20 minutes) but having reached that temperature cooks more quickly. There is little difference in the density of chicken and turkey though turkey is a little leaner, has less fat proportionally.
Kiwis eat about 24 kilograms of pork, per capita, each year.
Here are the recommended roasting time details for a shoulder roast.
Put in the oven for 30 minutes at a temperature of 220⁰C.
Turn the oven down to 180⁰C.
Cook the roast for 20 minutes per 500 grams.
Create a graph to help people work out the roasting time for pork.
Slide Eleven provides a model graph.
Ask students to write an equation for the relation between mass and cooking time. (t = 40m + 30)
Have students share and korero about their thinking with each other.
Session Three
Has anyone’s family or friends ever hired a car?
Why did you need to hire a car rather than use your own?
How many days did you hire the car for?
How far did you travel?
Do you know how much it might have cost?
What different things did you have to pay for?
Question 1: Suppose that Rent-A-Bomb charges $25 a day and 30c per kilometre.
How much does it cost for a two-day hire if you travel 300 kilometres?
2 x 25 + 300 x 0.3 = $160
If you use the car for three days, and the hire costs $291 in total, how many kilometres do you travel?
(291 – 3 x 25) ÷ 0.3 = 920km
If you travel 900 kilometres, in total, and the hire costs $650, how many days do you hire the car for?
(645 – 900 x 0.3) ÷ 25 = 15 days
After suitable time, gather the class to discuss the answers.
What different ways did you use to solve these problems?
Which strategies are the most efficient? Have students share and korero about their thinking with each other.
Note that students are likely to use trial and improvement strategies, particularly to problems b) and c). These strategies can be made more efficient by organising data systematically in tables. For example, b might be approximated by choosing likely numbers of kilometres.
The equations given represent an efficient solution that comes from recognising a rule for working out the number of kilometres from the cost or the inverse of that.
A flowchart for a 3-day hire might support students to see the relationships:
To solve problem 1b put $291 into the cost box and work backwards to find the distance.
4 x 40 + 400 x 0.15 = $220
{197 – (2 x 40)} ÷ 0.15 = 780km
{480 – (800 x 0.15)} ÷ 40 = 9 days
You might use tables again to organise data and flowcharts to suggest the most efficient ways to calculate the answers.
To simplify things let’s hire the car for one day.
Which company is the cheapest to use?
Can you explain your thinking?
Students might offer ideas like:
Rent-a-bomb charges less to hire the car but Rent-a-dent charges less per kilometre.
How might we graph the deals from both companies on the same graph?
What are the variables? (Distance and cost)
What rule connects kilometres and cost for each company?
What is the equation for that rule?
Collectively develop a graph that looks like this (PowerPoint 3, slide 1):
Session 4
In this session students look at mobile phone plans. For many people mobile phones are also their source of emails, music and internet. Plans are developed by companies to attract consumers who meet patterns of phone use. The best plan for one person is not necessarily the best for another. Variables to consider are time in phone calls, number of texts, and amount of data.
Who has their own mobile phone? What do you use your phone for?
How many times a week would you use it to phone someone?
How many text messages would you send in a day?
What does it cost to use your phone?
Who pays for it?
The discussion should show that use of mobile phones is variable and that they cost money.
How do you select the best deal for your phone?
What details do you usually look for in mobile phone plans?
Generally, plans include the amount of data, minutes of calls, and number of texts. Sometimes they include special deals like extra data, memberships to entertainment providers or music channels, and interest free purchase of phones.
Mobile phone plans contain a lot of variables. Let’s simplify the situation by looking at just one variable, data volume.
What is meant by data? (Pieces of information)
Slide Three shows the commonly used file sizes.
A gigabyte equals 1000 x 1000 x 1000 = 1 000 000 000 = 1 billion bytes. To put things into perspective:
1 GB of data is equivalent to about 210 000 text only emails, or 250 3-minute MP3 videos, or 600 high resolution images. A standard movie DVD contains about 4.5 GB of data.
Terabytes (TB) are another common unit of data. For example, if you buy an external hard drive for your computer it is likely to be several terabytes in size. One terabyte equals 1 000 GB, which equals 1 000 000 000 000 bytes (1 trillion).
What is the same and what is different about these plans?
Students should notice that everything is the same except the volume of data.
Is there a relationship between the amount of data and the price of the plan?
If a plan is exactly the same, but allows 8GB of data, how much should you pay per month?
All of these plans cost the same, but which one is best?
Justify your choice of plan.
Let students discuss the plans. They should notice that the relationship between data and call time is negative. That is, when one goes up the other goes down. Choosing one of the plans is likely to be dependent on usual phone usage, preference for internet browsing versus making calls to friends and family.
Is the relationship linear?
How is the relationship different from the others we have seen?
Imagine a plan with same cost that has only call time. How many minutes would you get?
Imagine a plan with same cost that has only data. How many gigabytes would you get?
Find a rule that relates call time to data. Let t represent call time, in minutes, and d represent amount of data, in gigabytes. (t = 240 – 40d)
Is there a best deal? Explain.
Session 5
In this session we give the students a chance to operate a hire car company.
The Hire Car Game: Students work in teams of three to operate their own hire car company. Each team has overheads of $20 a day per small car, $25 a day for a medium car, and $35 a day for a large car, whether the car is used or not. Overheads cover the cost of the vehicle, insurance, building rental, cleaning staff, etc. Costs occur each day irrespective of whether the car is hired or not.
Small Car $35 per day + 0.25c per kilometre
Medium Car $40 per day + 0.30c per kilometre
Large Car $45 per day + 0.35c per kilometre
Each company choses its stock level of cars from a minimum of 4 cars to a maximum of 10 cars. The company nominates the size of each car and assigns each car an identification code, e.g. Car 1.
Family and whānau,
This week we have been investigating the cost of hiring taxis, renting cars, and operating a mobile phone. We've used mathematics to make decisions about the best option to choose, and justified the choices we made when selecting a service or plan. Students have been asked to do some research at home related to the costs of phone plans. It would be helpful if you could discuss your family phone plans and why you have made the choices you have. Ask your student to identify the important considerations when deciding on a phone plan. Looking online for sites that compare phone plans would help to support your discussions. Thanks for your help.
Figure it out
Some links from the Figure It Out series which you may find useful are:
Choices
This unit is about making best option decisions in real-life situations based on cost. Common examples of such decisions are explored, including the cost of taxis, cooking times, hire cars, and mobile phones.
The mathematics in this unit involves relationships between variables. A variable is a measure that can take up different values. For example, when making decisions about rental cars, customers relate two variables, number of kilometres or days (distance or time) and amount of money (cost).
Most situations define the roles that the variables take. When hiring a car, it is the distance or time, that is the independent, or explanatory variable. An explanatory variable is the variable that explains changes in the other variable, cost. You expect that travelling more kilometres will cost more. Cost is the dependent, or response, variable.
In this unit the relationships are mostly linear. That means there is a constant growth in the response variable, as constant growth occurs in the explanatory variable. For example, Booma Rentals hires cars at $30 per day plus $0.10 per kilometre. The relationship between cost and kilometres is linear, since you pay 10 cents more for every kilometre. If a linear relation is graphed the ordered pairs (co-ordinates) lie on a straight line.
The learning opportunities in this unit can be differentiated by providing or removing support to students and by varying the task requirements. Ways to support students include:
Tasks can be varied in many ways including:
The context for this unit can be adapted to suit the interests and cultural backgrounds of your students. Most students nowadays own a mobile phone or know someone who does. Rental cars and taxis are a more familiar context for urban students so be aware that other forms of rental or journey may be more appropriate to rural students, e.g. delivery fees for products. Cooking times of meats can easily be changed to include cooking times of roasting vegetables or other foods. There may be contexts involving rates that are more relevant to your students. Examples might include hire-to-buy schemes, money earned for jobs such as serving at a café or dairy, cost of shipments of hay (delivery charge + cost per bale), water and electricity charges (line + amount per kilowatt hour).
Teachers’ Notes
Encourage your students to choose appropriate forms of calculation, depending on the complexity of the operations and numbers involved. Mental calculation, recording in written form, and digital devices are all legitimate options. In your discussions ask the class how they got the answers and what methods they used to do the calculations.
Session 1
Who has ridden in a taxi recently? Why did you go in a taxi? (Slide One)
How did the taxi driver calculate the fare? (Slide Two)
Why was there a dollar amount on the meter before you even started off?
Tiki Taxis charge $5 flag fall and $3.00 per kilometre. (Slide Three)
Discuss the meaning of “per kilometre” as a rate “for every kilometre travelled.”
Use Slide Four to show the problems:
Work with a partner to solve the problems together.
How much would it cost you to travel 25 kilometres in the cab?
How much would it cost you to travel 32 kilometres in the cab?
How far could you go for $41?
How far could you go for $77?
Share and korero about your thinking with another pair or group.
You might use a flowchart like this:
Ask:
Why is the order that we carry out the operations important?
How do we find the distance if we are given a fare?
You might decide to record equations for the flowchart processes. Define the variables; f represents the fare in number of dollars, and d represents the distance in number of kilometres.
If we start an equation, f=, what do we include to show how the fare is calculated, what fare is equal to? (f = 3d + 5)
If we start an equation, d=, what do we include to show how the distance is calculated, what distance is equal to? (d = (f – 5)/3). In this case pay special attention to the vinculum in a fraction also being a symbol for division.
Do you see any pattern? (Student might notice that the graph is linear)
Why do you think the points lie on a line? (Same rate of $3 per kilometre)
What do you notice?
Can we work out fares and distances using the graph? How?
What would the fare for 30 kilometres be? ($95)
What is the distance of a fare that costs $65? (20 km)
Animating Slide 7 shows how the answers can be read off the axes.
Tiki Taxis find they are not making enough money to cover their costs, and to give their drivers a decent wage.
Which option is better, if they want to make more money?
Raise flagfall to $10.00
or
Increase the rate to $3.50 per kilometre
What does the graph show? (An increase in flagfall of $5 gives more income than an increase in rate of $0.50 per kilometre up to 10 kilometres)
How far do you think most taxi trips are? (Create some make-believe trips online using Google Maps and use the distance function)
What recommendations would you make to the owners of Tiki Taxis?
Session 2
What does 43 kilograms per capita mean? (An average of 43 kilograms for every person)
Discuss the fact that this might include bones as well as meat, but every person includes little children and elderly people who eat relatively little.
How many whole chickens make up 43 kilograms? (invite predictions then move to Slide Two)
What operation should we perform? (43 ÷ 1.2 = 35.83)
Therefore, kiwis average nearly 36 whole size 12 chickens per year. That’s three chickens every month!
How long should you cook a size 12 chicken?
What calculation should you perform? (1.2 x 55 + 20 = 86)
How long should you roast a size 18 chicken for? 1.8 x 55 + 20 = 119
If a chicken should be roasted for 97 minutes, what mass is the chicken? (97 – 20) ÷ 55 = 1.4
If a chicken should be roasted for 75 minutes, what mass is the chicken? (75 – 20) ÷ 55 = 1.0
What pattern do you notice? (Linear)
Why does this pattern occur? (Constant rate of 55 minutes per kilogram)
How is this situation the same as the rental car situation? (A constant rate and fixed time. The fixed time has a similar effect as flagfall in the rental car situation). Share and korero about your thinking with another pair or group.
Students may be able to relate roasting a chicken to their knowledge of cooking chicken in a hāngi. How long should chicken be cooked for in a hāngi? Does cooking time increase if more chickens are being cooked? Why or why not?
In the Aotearoa New Zealand, it is becoming more common to cook a turkey to celebrate Christmas with whānau. Commercial turkeys are much larger than chickens and have a mass of between 3.6 and 10.8 kilograms, etc.
Let students work on the problems collaboratively with support from digital graphing tools and calculators. Solutions are below:
The relationship is close to linear.
The amount of cooking time goes up by a little over 15 minutes for each extra kilo. For example, between the point (8, 210) and (10, 240), mass increases by 2 kilograms and cooking time increases by 30 minutes. That is 15 minutes per extra kilogram. Students may recognise that their rule should begin as t = 15m but a fixed amount of time needs to be added. They might take any point, say (8, 210), and use it to work out the extra fixed amount.
8 x 15 = 120
120 + 90 = 210
The rule is t = 15m + 90 and can be tested using other known masses and times. For example, 15 x 10 + 90 = 240 minutes.
15 x 7 + 90 = 195 minutes
Why might that be?
Chickens take an extra 55 minutes per kilogram compared to 15 minutes extra for turkeys. Mostly that is because a much larger bird takes way longer in the oven to reach a cooking temperature (90 minutes vs 20 minutes) but having reached that temperature cooks more quickly. There is little difference in the density of chicken and turkey though turkey is a little leaner, has less fat proportionally.
Kiwis eat about 24 kilograms of pork, per capita, each year.
Here are the recommended roasting time details for a shoulder roast.
Put in the oven for 30 minutes at a temperature of 220⁰C.
Turn the oven down to 180⁰C.
Cook the roast for 20 minutes per 500 grams.
Create a graph to help people work out the roasting time for pork.
Slide Eleven provides a model graph.
Ask students to write an equation for the relation between mass and cooking time. (t = 40m + 30)
Have students share and korero about their thinking with each other.
Session Three
Has anyone’s family or friends ever hired a car?
Why did you need to hire a car rather than use your own?
How many days did you hire the car for?
How far did you travel?
Do you know how much it might have cost?
What different things did you have to pay for?
Question 1: Suppose that Rent-A-Bomb charges $25 a day and 30c per kilometre.
How much does it cost for a two-day hire if you travel 300 kilometres?
2 x 25 + 300 x 0.3 = $160
If you use the car for three days, and the hire costs $291 in total, how many kilometres do you travel?
(291 – 3 x 25) ÷ 0.3 = 920km
If you travel 900 kilometres, in total, and the hire costs $650, how many days do you hire the car for?
(645 – 900 x 0.3) ÷ 25 = 15 days
After suitable time, gather the class to discuss the answers.
What different ways did you use to solve these problems?
Which strategies are the most efficient? Have students share and korero about their thinking with each other.
Note that students are likely to use trial and improvement strategies, particularly to problems b) and c). These strategies can be made more efficient by organising data systematically in tables. For example, b might be approximated by choosing likely numbers of kilometres.
The equations given represent an efficient solution that comes from recognising a rule for working out the number of kilometres from the cost or the inverse of that.

A flowchart for a 3-day hire might support students to see the relationships:
To solve problem 1b put $291 into the cost box and work backwards to find the distance.
4 x 40 + 400 x 0.15 = $220
{197 – (2 x 40)} ÷ 0.15 = 780km
{480 – (800 x 0.15)} ÷ 40 = 9 days
You might use tables again to organise data and flowcharts to suggest the most efficient ways to calculate the answers.
To simplify things let’s hire the car for one day.
Which company is the cheapest to use?
Can you explain your thinking?
Students might offer ideas like:
Rent-a-bomb charges less to hire the car but Rent-a-dent charges less per kilometre.
How might we graph the deals from both companies on the same graph?
What are the variables? (Distance and cost)
What rule connects kilometres and cost for each company?
What is the equation for that rule?
Collectively develop a graph that looks like this (PowerPoint 3, slide 1):
Session 4
In this session students look at mobile phone plans. For many people mobile phones are also their source of emails, music and internet. Plans are developed by companies to attract consumers who meet patterns of phone use. The best plan for one person is not necessarily the best for another. Variables to consider are time in phone calls, number of texts, and amount of data.
Who has their own mobile phone? What do you use your phone for?
How many times a week would you use it to phone someone?
How many text messages would you send in a day?
What does it cost to use your phone?
Who pays for it?
The discussion should show that use of mobile phones is variable and that they cost money.
How do you select the best deal for your phone?
What details do you usually look for in mobile phone plans?
Generally, plans include the amount of data, minutes of calls, and number of texts. Sometimes they include special deals like extra data, memberships to entertainment providers or music channels, and interest free purchase of phones.
Mobile phone plans contain a lot of variables. Let’s simplify the situation by looking at just one variable, data volume.
What is meant by data? (Pieces of information)
Slide Three shows the commonly used file sizes.
A gigabyte equals 1000 x 1000 x 1000 = 1 000 000 000 = 1 billion bytes. To put things into perspective:
1 GB of data is equivalent to about 210 000 text only emails, or 250 3-minute MP3 videos, or 600 high resolution images. A standard movie DVD contains about 4.5 GB of data.
Terabytes (TB) are another common unit of data. For example, if you buy an external hard drive for your computer it is likely to be several terabytes in size. One terabyte equals 1 000 GB, which equals 1 000 000 000 000 bytes (1 trillion).
What is the same and what is different about these plans?
Students should notice that everything is the same except the volume of data.
Is there a relationship between the amount of data and the price of the plan?
If a plan is exactly the same, but allows 8GB of data, how much should you pay per month?
All of these plans cost the same, but which one is best?
Justify your choice of plan.
Let students discuss the plans. They should notice that the relationship between data and call time is negative. That is, when one goes up the other goes down. Choosing one of the plans is likely to be dependent on usual phone usage, preference for internet browsing versus making calls to friends and family.
Is the relationship linear?
How is the relationship different from the others we have seen?
Imagine a plan with same cost that has only call time. How many minutes would you get?
Imagine a plan with same cost that has only data. How many gigabytes would you get?
Find a rule that relates call time to data. Let t represent call time, in minutes, and d represent amount of data, in gigabytes. (t = 240 – 40d)
Is there a best deal? Explain.
Session 5
In this session we give the students a chance to operate a hire car company.
The Hire Car Game: Students work in teams of three to operate their own hire car company. Each team has overheads of $20 a day per small car, $25 a day for a medium car, and $35 a day for a large car, whether the car is used or not. Overheads cover the cost of the vehicle, insurance, building rental, cleaning staff, etc. Costs occur each day irrespective of whether the car is hired or not.
Small Car $35 per day + 0.25c per kilometre
Medium Car $40 per day + 0.30c per kilometre
Large Car $45 per day + 0.35c per kilometre
Each company choses its stock level of cars from a minimum of 4 cars to a maximum of 10 cars. The company nominates the size of each car and assigns each car an identification code, e.g. Car 1.
Family and whānau,
This week we have been investigating the cost of hiring taxis, renting cars, and operating a mobile phone. We've used mathematics to make decisions about the best option to choose, and justified the choices we made when selecting a service or plan. Students have been asked to do some research at home related to the costs of phone plans. It would be helpful if you could discuss your family phone plans and why you have made the choices you have. Ask your student to identify the important considerations when deciding on a phone plan. Looking online for sites that compare phone plans would help to support your discussions. Thanks for your help.
Figure it out
Some links from the Figure It Out series which you may find useful are:
Extending Mixing Colours
Solve problems involving ratios.
Number Framework Stage 8
Unilink cubes (red, blue and yellow)
Calculators
Using Materials
In Mixing Colours, a sequence was provided for introducing the part-whole relationships in ratios and expressing them as fractions and percentages. The lesson for Extending Mixing Colours should initially follow the same sequence. The notes below show how the Number Properties phase of the lesson can be made more complex.
It is important for students at the Advanced Proportional stage to have multiplicative strategies to compare ratios without needing to replicate the ratios until a common part or whole is found, e.g., at earlier stages, to compare 2:4 with 3:5, both are duplicated (2:4 = 4:8 = 6:12 … and 3:5 = 6:10 …) until a common part of 6 measures of A is found.
Using Imaging
Follow the steps on the next page to create a computer spreadsheet that allows ratios to be displayed simultaneously as a table and connected graph. This spreadsheet can be accessed online by downloading Material Master 7–10. Create a table like this:
2. For each mixture, create a pie graph and embed it in the spreadsheet rather than save it as a separate file. This means that any changes made to the cell entries are transferred to the pie chart.
The spreadsheet can then be used to compare mixtures visually and numerically. In the example above, the proportion of blue changes while the actual amount of it stays constant (two units).
Ask the students how the percentage of each colour was calculated and why this made the comparison easier. Percentages provide a common denominator of 100 for the equivalent fractions. In Mixture A, there are 2 units of blue out of a total number of 2 + 5 = 7 units. 2/7 = 2 ÷ 7 = 0.2857 = 28.57%.
Pose other problems requiring students to compare ratios. Ask the students to anticipate which mixture gives the darkest shade of green before the spreadsheet is used to confirm. (A blue and yellow mixture produces green. The greater the proportion of blue, the darker the green will be.)
Good examples are (blue:yellow):
Using Number Properties
Provide similar problems but allow students access only to their calculators rather than to any visual display. If confusions arise, the spreadsheet can be used to check solutions. Expect students to justify their calculation steps and encourage estimation and use of leveraging from known benchmark fractions, e.g., 5/11 > is slightly less than one-half or 50%.
Further problems are:
Sharing in Ratios
Solve problems involving ratios.
Number Framework Stage 8.
Using Number Properties
Problem: “Mrs Norris hires students to work on her garden. She agrees to pay them $400 total.
Diane, Sonya, and Mere work 13 hours, 10 hours, and 17 hours respectively on the garden. How much pay will Sonya receive?”
Discuss why the ratio of hours 13 : 10 : 17 leads to Sonya receiving $100.
(Answer: 13 + 10 + 17 = 40. 10/40 x 400 = 100.)
Problem: “Two friends buy a house that costs $193,500. Bernie contributes $89,500, and Bronwyn contributes $104,000. Five years later, they sell it for $234,000. How much money should each of them receive?
(Answer: Bernie should receive 89500/193500 x 234 000 = $108,233 (to the nearest dollar), so Bronwyn should receive 234 000 – 108 233 = $125,767.)
Examples: Worksheet (Material Master 8–29).
Understanding Number Properties:
John and June buy a house together. John contributes $g, and June contributes $h. When they sell the house, they receive $t altogether. How would you work out how much John should receive as his share? (Answer: $(g/g+h?) x t.)