Area is an attribute, a characteristic of an object. The attribute of area is the space taken up by part of a flat or curved surface. Usually, we begin by helping students think of area as an attribute before formally measuring it. Use contexts in which students compare flat spaces by size such as comparing pancakes or footprints. Note that “biggest” may be perceived in different ways. The most common confusion is between area (the space covered) and perimeter (the distance around the outside).
Different contexts can be used to explore the attribute of area. In these lessons, the main context used is around measuring land. Suppose some students think that a playing field is bigger than another because they spend longer walking across one field. “How many steps would it take to cross each field?” is an example of an enabling prompt. Partitioning and combining shapes are also useful ways to promote understanding of conservation of area and can lay groundwork for ideas about the areas of triangles, rectangles, trapezia, parallelograms and other polygons in later years.
Formal measuring of area with units will only make sense to students if they relate their methods to the process of measuring other attributes such as length and mass. Students need to see the need for units and identify the qualities of units that are appropriate. They also need to realise that a number alone does not convey a measure unless the unit is stated as well.
Units require the following properties:
- Units are all the same. You can mix units but that makes it harder to be precise and compare measures.
- Units fill a space with no gaps or overlaps. This explains the convention for using squares that tessellate, by equal measure in height and length, in arrangements of rows and columns.
- More smaller units fit into the same space as larger units. Smaller units tend to give a more precise measure. Note that if the smaller units are one quarter of the size of the larger units then four times as many fill the same space.
- Units can be partitioned and joined. Note the connection to fractions, e.g. two half units can make a whole unit.
The standard units of area in real life are the square centimetre (cm2), square metre (m2), hectare (ha.) and square kilometre (km2). While the proportional difference between metres and centimetres is manageable with length, the proportional difference between square centimetres and square metres makes size comparison difficult.
Consider the relationship between square centimetres and square metres. There are 100 x 100 (i.e. 10 000) square centimetres in one square metre. That is the same relationship as between square metres and hectares. A hectare is 10 000 m2. Hectares are used to measure areas of land. Think of a hectare as an area that is 100m by 100m. That means that 10 x 10 = 100 hectares are in one square kilometre. Square kilometres are used to measure large areas of land. For example, Rakiura/Stewart Island has an area of 1 746 km2 or 174 600 hectares.
Specific Teaching Points
Sessions One and Two
A suitable unit for measuring area must have these qualities:
- Be a piece of area (two dimensional)
- Units must be the same size
- Units should fit together with no gaps or overlaps
- Units should be of a size that gives adequate precision (accuracy).
Session Three
The area of a flat shape is conserved (stays constant) as parts of it are moved to different places on the shape. Any shape can be ‘morphed’ into a shape with the same area by ‘giving and taking’.
Session Four
Area is the amount of flat space enclosed by a shape. Perimeter is the distance around the outside of a shape. Shapes with the same area can have different perimeters, and shapes with the same perimeter can have different areas.
Session Five
A growing pattern can be structured by looking at how the figures are organised. Noticing structure helps with counting the area of a figure, and with predicting further figures in the pattern. Identifying sameness and difference in figures can help in creating a rule (generalisation) for all figures in the pattern.
Observations of students during this unit can be used to inform judgments in relation to the Learning Progression Frameworks. Click for tables of guidelines.

Fill it up - flat space
This integrated unit combines measurement of area with multiplication, and algebraic thinking.
Area is an attribute, a characteristic of an object. The attribute of area is the space taken up by part of a flat or curved surface. Usually, we begin by helping students think of area as an attribute before formally measuring it. Use contexts in which students compare flat spaces by size such as comparing pancakes or footprints. Note that “biggest” may be perceived in different ways. The most common confusion is between area (the space covered) and perimeter (the distance around the outside).
Different contexts can be used to explore the attribute of area. In these lessons, the main context used is around measuring land. Suppose some students think that a playing field is bigger than another because they spend longer walking across one field. “How many steps would it take to cross each field?” is an example of an enabling prompt. Partitioning and combining shapes are also useful ways to promote understanding of conservation of area and can lay groundwork for ideas about the areas of triangles, rectangles, trapezia, parallelograms and other polygons in later years.
Formal measuring of area with units will only make sense to students if they relate their methods to the process of measuring other attributes such as length and mass. Students need to see the need for units and identify the qualities of units that are appropriate. They also need to realise that a number alone does not convey a measure unless the unit is stated as well.
Units require the following properties:
The standard units of area in real life are the square centimetre (cm2), square metre (m2), hectare (ha.) and square kilometre (km2). While the proportional difference between metres and centimetres is manageable with length, the proportional difference between square centimetres and square metres makes size comparison difficult.
Consider the relationship between square centimetres and square metres. There are 100 x 100 (i.e. 10 000) square centimetres in one square metre. That is the same relationship as between square metres and hectares. A hectare is 10 000 m2. Hectares are used to measure areas of land. Think of a hectare as an area that is 100m by 100m. That means that 10 x 10 = 100 hectares are in one square kilometre. Square kilometres are used to measure large areas of land. For example, Rakiura/Stewart Island has an area of 1 746 km2 or 174 600 hectares.
Specific Teaching Points
Sessions One and Two
A suitable unit for measuring area must have these qualities:
Session Three
The area of a flat shape is conserved (stays constant) as parts of it are moved to different places on the shape. Any shape can be ‘morphed’ into a shape with the same area by ‘giving and taking’.
Session Four
Area is the amount of flat space enclosed by a shape. Perimeter is the distance around the outside of a shape. Shapes with the same area can have different perimeters, and shapes with the same perimeter can have different areas.
Session Five
A growing pattern can be structured by looking at how the figures are organised. Noticing structure helps with counting the area of a figure, and with predicting further figures in the pattern. Identifying sameness and difference in figures can help in creating a rule (generalisation) for all figures in the pattern.
Observations of students during this unit can be used to inform judgments in relation to the Learning Progression Frameworks. Click for tables of guidelines.
The learning opportunities in this unit can be differentiated by providing or removing support to students and by varying the task requirements. Ways to support students include:
Task can be varied in many ways including:
The contexts for this unit can be adapted to suit the interests and cultural backgrounds of your students. Look for everyday examples when your students encounter area. Examples might involve spaces that are meaningful to them, such as their own bedroom, lounge, or section at home. Portions of food, such as pancakes or pies, can be compared by area. Students interested in environmental issues might be motivated by contexts such as the areas covered by drift nets or oil spills. Students might find comparing the size of land areas interesting, e.g. How many times does Rarotonga fit into the North Island? Which is larger Upolo (Samoa) or Espiritos Santos (Vanuatu)? Students may wish to share iwi and hapū connections and compare the size of areas that they whakapapa back to. For example, children living in the South Island may whakapapa back to Taranaki iwi. High achieving students might be interested in population density.
Prior Experience
Students are expected to have some experience with measurement of other attributes, such as length, using informal units. They should also have some knowledge of multiplication facts and understanding of how to apply multiplication to finding the number of items in arrays. Consider what multiplication strategies your students are confident using. Your students might benefit from revisiting multiplication strategies at the beginning of these sessions, or might benefit from visual reminders of the strategies.
Session One: Three Islands
Session Two: Measuring Flat Space
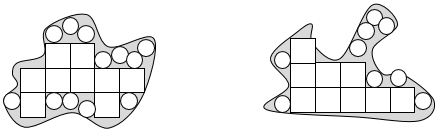
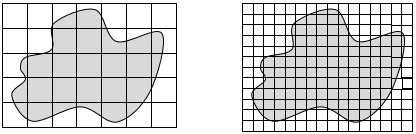
This will raise issues of precision. Small squares are more precise than large squares. Why?
Session Three: Megabites
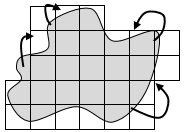
Note that by giving and taking, the overlapping triangles can fill the missing space, transforming the trapezium into the square. The biscuits are the same area.
Students may suggest other strategies involving units. The fourth slide of the PowerPoint 2 has an overlay of square units.
The diagrams show that the triangle is one half the area of the surrounding rectangle. For example, if a triangle is 36 squares in area then the rectangle must be twice that area, 72 squares.
Session Four: Yap’s Run
Session Five: Farmer Joe’s Garden
In this lesson students apply their understanding of area to a growing pattern. The task can be used to assess several aspects of mathematics, including multiplicative thinking, measurement, algebraic thinking and equations and expressions.
Slide 2 presents the shape of the garden in Year Four. Ask the students what they notice. Look for them to identify properties of the shape and sections of the garden that will be useful structures for finding area. Ask the students to collaborate (mahi tahi) in pairs to decide on the area of the Year 4 garden. You may need to remind them that each small brown square represents one square metre (1m2). Ensure all students explain their thinking and experience both tuakana and teina roles in this task.
If they look for patterns in the differences students might notice that those differences grow by two each year
Māori had neat māra kūmara (kūmara gardens), about 0.5–5 hectares in area, on sunny, north-facing slopes. Remember, a hectare is 10 000 m2. We can think of a hectare as an area that is 100m by 100m.
Māra kūmara consisted of puke (mounds) formed from loosened soil, arranged either in rows or in a recurring quincunx pattern (the shape of a ‘5’ on a dice). Kūmara tubers were planted in the mounds.
Farmer Joe would like to plant a māra kūmara. Ask the students to collaborate (mahi tahi) in pairs or groups of three to plan what Farmer Joe’s māra kūmara could look like and help decide how the kūmara could be arranged. The garden should be between 0.5–5 hectares in area. Students could use the 1 cm grid to design a scale model of their gardens on, this time imagining each square as 1m2. This image could be shown to students so they have an idea of what a traditional māra kūmara could look like. They may also like to see the modern māra kūmara at the Hamilton Gardens.
Dear parents and whānau
This week we are investigating problems about area, the amount of flat space. We will look at suitable units to measure area so that no gaps or overlaps occur. We will learn to use multiplication to count the number of units in an area efficiently and how to record measurements of area using numbers and units, like 24m2 (twenty-four square metres).
We will also investigate a growing pattern with area and predict further members in the pattern.
Starting from Scratch
In this unit students use a digital programming platform, Scratch, to learn about polygons, and use the language of direction and distance.
The mathematics in this unit is primarily about geometry though aspects of measurement and number are applied.
Specific Teaching Points
To have their Sprite facing the correct direction students can use this command:
To make sense of this command students need to understand bearings, in a simple way. Bearings are measured in a clockwise or anti-clockwise direction from due North (vertical). Here are some examples.
Note that in Scratch the bearing that is an anti-clockwise turn from the vertical of 40° is written as -40°.
To work on the length required students need to apply iterative use of a unit or equal partitioning. One way to solve the problem is to realise that 200 is about two-thirds of the distance. Each third must be 100 steps so the whole distance must be three thirds, 3 x 100 = 300 steps. In working with Scratch students may encounter more difficult proportions. They may need to rely on iteration. In the red line example, they might realise that the line can be equally cut into four parts. One part is 50 steps and can be used as a unit to measure the whole length that is needed. That measurement process of placing units end on end without gaps or overlaps is called iteration.
Students' experiences with digital technology are likely to vary considerably. The learning opportunities in this unit can be differentiated by providing or removing support to students and by varying the task requirements. Ways to support students include:
Task can be varied in many ways including:
The context for this unit is engaging. Capture students' interest in robotics by exploring non-fiction examples, and science fiction stories. There are many videos of films and television shows online. Students will enjoy personalising the movements of a Sprite to create a figure that is of significance to them. Can they train the Sprite to draw a koru, or nutukaka (kakabeak) flower, or write their signature? Can they create a shape or emblem that is important in their culture? Use collaborative partnerships (tuakana/teina relationship) to motivate your students. Most coding is completed in teams (mahi tahi model) which reflects the collaborative nature of work in digital technologies.
Te reo Māori vocabulary terms such as taparau (polygon), taha (side), koki (angle) and ahu (direction) could be introduced in this unit and used throughout other mathematical learning.
Prior Experience
Students should have a concept of an angle as a measure of turn and be able to use a protractor to measure angles. Some experience with co-ordinate planes would be an advantage but is not strictly needed. Students will also need to know the properties of simple polygons like triangles, squares and hexagons. Support the development of these understandings as necessary.
Session One
In this lesson students investigate giving directions with sufficient clarity that a robot or sprite can carry them out. You may like to play a short video from YouTube showing the portrayal of robots in science fiction, e.g. Star Wars or Lost in Space. Begin by discussing this question:
Students need to understand that robots are really computers that are programmed by humans to carry out tasks. This avoids the thorny issue of whether robots will become self-thinking in the future.
A programme is composed of a set of instructions that the robot can interpret. It only makes sense to tell a robot to “Go forward three steps” if it understands the meanings of “Go forward” and “Steps”. Computers are very good at counting if they understand what “three” means.
You may need to clarify the meaning of perimeter. Let the students work for a few minutes to work through their instructions. Some recording will be necessary. When you gather the class ask a few pairs to model the instructions. These issues should surface.
How can the commands be altered to create other regular polygons?
You may need to discuss the meaning of ‘regular’ as having equal sides and angles. The prefixes of the polygons (many angles) indicate the number of angles, e.g. octa refers to eight, hexa- refers to six. Let the students explore how to create other polygons.
You may need to draw a diagram of what the angle is referring to:
"Angle as a turn" is one of the most fundamental concepts in Geometry and Measurement. To support students to understand that the sum of exterior angles of a polygon is always a full turn (360°) get a student (robot) to act out walking various polygons.
In general, to create a regular polygon of n sides the angle needs to be 360° ÷ n. For example, to create a hexagon the angle of turn is 360° ÷ n = 60°.
What values for the variables side length, angle and number of sides do you enter so the beetle draws a circle? Is that possible?
Maximising the repetitions to 360, and minimising the distance and angle to one, creates a polygon that looks like a circle. In fact, the shape is a 360-gon. Some students might wonder how many sides and angles a circle has.
Session Two
In this session students apply their knowledge of programming in Scratch to create paths. There are seven challenges which vary in difficulty as indicated by the number of stars on the cards (See Copymaster 1).
The solution codes for the challenges are provided in Copymaster 1 solutions PDF. Note that there are often many different programmes that produce the same outcome. Also, remind the students that they are trying to get as close as they can to the target paths. It is difficult to get the coding identical to the original.
What did you first look for when you saw a path?
How did you figure out which lengths to put in? (Relative length is important in some paths)
How did you figure out which angles to put in? (Discuss turns greater than 90°)
What features of some paths told you that a repeat loop was possible? (This involves partitioning the path into several identical parts)
Session Three
So far students have worked from a shape to create code. In this lesson they are given the code and expected to anticipate the shape that will be drawn. After anticipating they can always recreate the code on Scratch to see what happens but that is not the aim. Pre-made codes for use in sessions three and four are available in the Scratch Codes zip file.
The key idea is that students attend to the code in ‘chunks’ and anticipate the effect of each chunk. Recording the information in pieces before assembling the whole figure is very useful. You can find the code saved as ScratchCode-LetterA.sb2.
How did you separate the whole code into parts?
What features did you look for first? What did repeats suggest to you?
How did you deal with blocks and variables?
What effect did random variables have on the design a code created?
Session Four
In this session students explore the use of Scratch to create directions for movement on a map. Training a robot to move is more complex than the instructions that you might give to another human being. Robots cannot interpret instructions like “Follow Smith Street down to the corner.” They can use their GPS system to travel in a compass direction like North or East but rely on simpler instructions like distance to move and angle to turn.
How did you know how many steps to take on each section of the journey?
How did you know which direction to face?
Did you use any repetition? Where? How did you know that would work?
Alternatively pose an even harder challenge by using ScratchCode-City.sb2. The layout is more regular which may enable use of repetition and block, but the journeys are longer.
Dear family and whānau,
This week we are working with a programming language called Scratch. We will use Scratch to tell a robot how to travel along paths. Some of the paths will be shapes like triangles and squares but other paths will be more complicated.
While we are solving problems, we will learn about sequencing steps to create programmes that work. Some programmes will need us to repeat actions over and over, to build blocks of commands, and to use variables to control what the robot does. Ask your children to explain some of the activities they have been working on.
Eggs and a little bacon
This unit explores situations that involve multiplication and division using an equal sets model. Students learn to apply the properties of whole numbers under multiplication, to derive new answers from basic facts, and apply inverse operations to division.
In te reo Māori the word for multiplication is whakarea. Whaka means “to happen” and rea means “grow or make plentiful” like the offshoots of a plant. The word whakarea captures the scaling nature of multiplication, meaning the creation of many copies of equal sets.
The simplest form of multiplication problem involves finding the total of a given number of equal sets. Consider this problem:
There are eight cartons of eggs. Each carton contains four eggs.
How many eggs are there altogether?
The problem can be represented mathematically as 8 x 4 = □. Eight represents the number of sets (the multiplier). Four is the number in each set (multiplicand) and represents the unit rate of “four eggs per carton.” The x symbol represents “of” in the sense of connecting eight sets of four. The empty box is the product or total and the equals sign represents sameness of quantity or balance.
Division with equal sets takes two forms depending on which factor is unknown. The te reo Māori word for division is whakawehe which means “to make separation happen”. The separation into equal sets happens in two different situations.Sharing division comes for equally distributing a total number of objects, the dividend, into a given number shares (the divisor), which results in an amount per share (the quotient). For example:
There are 32 eggs and eight cartons of the same size.
How many eggs go into each carton?
Note that 32 ÷ 8 = 4 represents the sharing of 32 (the dividend) into 8 equal sets (the divisor) which results in a quotient of “4 eggs per carton.” Division also applies to measurement contexts such as:
There are 32 eggs. Four eggs go into each carton.
How many cartons are needed?
Note that the rate is known, “4 eggs per carton”, and that becomes the unit of measure. “How many fours are in 32?” answers the problem. That can be written as 32 ÷ 4 = 8.
Both equal sharing and measuring problems are common in the real world. Developmentally, students tend to build up solutions to these problems using addition at first, progressing to multiplication. With appropriate opportunities to learn, students later come to treat division as an operation in its own right.
The learning opportunities in this unit can be differentiated by providing or removing support to students and by varying the task requirements. Ways to differentiate include:
The context used for this unit is bacon and eggs, simply to provide everyday situations that students are likely to be familiar with. You may wish to change the contexts to situations more relevant to your students’ everyday lives, interests, or cultural identities. For example, eggs in cartons might become kumara in kete, players per team, rowers in a waka ama, or students in mini-buses. Encourage students to be creative by accepting a variety of strategies, and asking them to create their own problems for others to solve, in contexts that are meaningful.
Session 1
There are 12 eggs in one dozen.
How many eggs are in eight dozen?
What ways can you find to solve this problem?
Which way is the most efficient? (takes the least effort)
Some students may use additive thinking. An example might be:
12 + 12 = 24 (That’s two cartons), 24 + 24 = 48 (That’s four cartons), 48 + 48 = 96 (Possibly using 50 + 50 = 100, that’s eight cartons).
You might record the strategy using multiplication, like this:
2 x 12 = 24 → 4 x 12 = 48 → 8 x 12 = 96
Repeated doubling can be a useful strategy for multiplying by 4, 8, and 16.
Additive thinking gets the job done but it is an inefficient process. Look for multiplicative strategies to highlight and share. These strategies might include:
12 is made up of ten and two. 8 x 10 = 80 (That’s the tens) and 8 x 2 = 16 (That’s the twos). 80 + 16 = 96.
Or (less likely):
10 x 12 = 120 (That’s two dozen too much) 2 x 12 = 24 (That’s two dozen)
120 – 24 = 96
Both strategies use the distributive property which means one factor is ‘distributed’. In this case 12 is distributed into 10 and 2, and 10 is distributed into 8 and 2.
There are 15 rashers of bacon in each pack.
How many rashers are in six packs?
What different ways can you find to solve this?
Good examples of using the distributive property are:
15 = 10 + 5, 6 x 10 = 60 and 6 x 5 = 30. Therefore, 6 x 15 = 60 + 30 = 90.
6 = 5 + 1, 5 x 15 = 50 + 25 = 75 and 1 x 15 =15. Therefore, 6 x 15 = 75 + 15 = 90.
An example of using the associative property is:
6 = 2 x 3, 2 x 15 = 30, 3 x 30 = 90. Therefore, 6 x 15 = 90.
Session Two
What was the same about these problems? What was different?
Where is the collection or set in this problem?
Where is the multiplier?
Eighteen hens lay four eggs each in one week.
How many eggs is that in total?
Be aware that students might think that the multiplier is always less than the size of the equal collections. Share some strategies for solving 18 x 4 = 72.
Imagine you trained a robot to solve problems like these ones. Make up a set of instructions for the robot. What actions should the robot take? Put the actions in order.
You might end up with a sequence that looks like this:
Step 1: Find the number of things in the equal collections, call that number [c]
Step 2: Find the number of equal collections, call that number [n]
Step 3: Multiply [n] and [c] by:
There are 144 eggs on each pallet.
You have 4 pallets. How many eggs is that altogether?
Be open to other ways that students might solve 4 x 144, particularly repeated doubling, i.e. 2 x 144 = 288, 2 x 288 = 576. You might try writing an algorithm for the doubling strategy. That will require a first step of deciding whether, or not, the numbers are suitable.
The rules are:
Players play in pairs. Each person has their own sheet of paper (Copymaster 1)
Here is an example of a partly completed scoresheet.
Session Three
In this session students transfer the strategies they developed for multiplication to problems involving division. Understanding that asking themselves the question, “How many x’s fit in y?” structures division problems and supports students’ fluency in calculation. By connecting division to multiplication students learn to apply their multiplication strategies and connect multiplication and division as inverse operations.
Henrietta gathers 52 eggs one morning.
How many half-dozen cartons (six-packs) can she fill?
How much of a six-pack are four eggs? (two-thirds)
52 ÷ 6 = 8 r4
Henrietta gathers __ eggs one morning.
How many __ cartons can she fill?
How do your strategies change as the numbers in the problem change?
Observe how students approach the task. Challenge students who ‘play safe’ to try more difficult numbers.
What numbers do you think would make the problem more challenging?
Why do the problems become more difficult with those numbers?
What strategies do you use with more challenging problems?
What makes a problem easy? (small numbers, no remainder, access to basic facts)
What makes a problem hard? (bigger numbers, remainders, tricky divisors such as three or seven, or outside the range of basic facts)
How will we use that knowledge?
Session Four
What is the same about these problems? (all the problems are about measurement, i.e. How many x’s fit into y?)
Three hens laid 48 eggs altogether over two weeks.
Each hen laid the same number of eggs.
How many eggs did each hen lay?
Note that the problem semantics suggest multiplication, i.e. 3 x □ = 48.
Can someone explain how that works? The problem is about sharing not measuring.
How many eggs have I shared so far?
Students should notice that three eggs are used up each time a round of dealing is complete.
Why are three eggs used up each time?
Session Five
In this session students explore an open-ended problem that allows them to demonstrate their multiplication and division strategies. The problem requires them to impose or find some information, i.e., the number of hens, how many eggs hens lay per week, and the size of the trays. Invite them to research online if they need to and use their knowledge of everyday context, e.g., trays that eggs commonly come in.
On Happy Chook poultry farm there are about 80 free range hens.
Each Saturday all the eggs for the week are sold at the Farmers’ Market.
How many trays are needed each week?
Was there enough information to solve the problem?
If not, where did you get your information?
Were your strategies efficient?
How might you have solved your problem differently?
Dear family and whānau,
This week at school we are learning to solve multiplication and division problems. The problems are all about eggs with a little bacon.
Here is an example:
Henrietta has 72 eggs that she wants to put into six-packs.
How many packs can she make?
We encourage children to use multiplication knowledge rather than adding on because multiplication is more efficient. For example, it is more efficient to work out how many sixes are in 72 than to keep adding six until 72 is found.
What's in the bag?
In this unit we experiment with cubes to make predictions about likelihood based on our observations. Students find out that with probabilistic situations there is no certain way to predict exactly what will happen.
Probability is a measure of chance or likelihood of an event occurring. In this unit bags of cubes are used to provide the sample space, that is the set of all possible outcomes. The chance of selecting a cube of a particular colour obviously depends on what is in the bag. Suppose there are 5 red, 3 blue and 2 yellow cubes in the bag.
The probability of selecting a red cube equals 5 out of 10 which can be written as 5/10, or 1/2, or 0.5 or 50%. Note that there are five outcomes (ways to select one cube) that result in the selection of a red cube. The probability of getting a blue cube with one selection equals 3 out of 10 (30%) and the probability of selecting a yellow cube equals 2/10 or 1/5 or 20%.
Probabilities can be used to predict what event is most likely to occur. Selecting a red cube is more likely than selecting a blue cube, which is more likely than selecting a yellow cube. That order assumes the cube is selected randomly which means that each cube has an equal chance of being selected. The prediction of the colour of the cube, especially for small samples, cannot be certain. In fact, all three colours might occur if one cube is selected. If enough selections are made, with replacement each time, the distributions of colour will more closely reflect the probability fractions.
The learning opportunities in this unit can be differentiated by providing or removing support to students and by varying the task requirements. Ways to support students include:
Task can be varied in many ways including:
The contexts for this unit can be adapted to suit the interests and cultural backgrounds of your students. Many students are interested in kaitiakitanga, guardianship of the environment, so using a context about endangered species may be motivating. Aotearoa has many species in danger of extinction, and scientists conduct regular, ongoing surveys to monitor population numbers. Some example could be Maui or Hector’s dolphin, takahe, Chatham Island robin. Cubes in a bag can be a metaphor for a wide range of sampling contexts, from predicting the outcomes of games, to the likelihood of the weather being fine for Sports Day.
Te reo Māori vocabulary terms such as tūponotanga (probability/chance), hautau (fraction), hautanga ā-ira (decimal fraction), ōwehenga (ratio) could be introduced in this unit and used throughout other mathematical learning. Te reo Māori numbers and colours can be interchanged for English throughout the unit.
Session 1
Today we make predictions about the cubes that are hidden in a bag. We find out that even when we can’t peek in the bag we can still make a good prediction about what is in it. Think of cubes in the bag like all the people in New Zealand or fish in our seas. We cannot know exactly about all of them but we can use statistics to get an idea.
Here is a bag with four cubes. The cubes are either red or blue and we’re going to try to find out how many of each colour there are selecting cubes one at a time.
This is called sampling with replacement. Replacement means we put it back – like a fish.
(Note: Each time a student takes a cube it must be returned before the next student draws a cube. Otherwise, the probabilities will change.)
What colour have you got?
If it is the same colour as the one previously drawn ask:
Do you think that it is the same cube? Why or why not?
If it is a different colour ask:
Does that mean that half the cubes are red and half are blue?
The important idea is that students acknowledge that such conclusions are speculative. There is no certainty except that at least one red (same colour drawn), or at least one red and one blue (different colours drawn) are in the bag.
Why did you guess that? How certain are you?
Has that changed your mind about what is in the bag? Why? Why not?
Do you think that we have seen all the cubes?
Do we know what the colours of the four cubes are? Why or why not?
Would we find out more if we had more turns?
Record your best prediction about the colours of the four cubes in the bag.
Before we look in the bag, discuss all the possible combinations for the colours of the four cubes.
Record these combinations on the board. Students might forget the four of one colour, zero of the other colour possible combinations.
How could we have improved the prediction before checking?
Students might suggest that more selections might have improved the reliability. Larger samples tend to be more representative than smaller samples
I am going to draw a cube. Which colour do you think it will be?Why?
Can we be sure that I will get that one? Why?
How could we record your chance of success?
If students choose red their chance of success is 3 out of 4 or 3/4.
If they choose blue their chance of success is 1 out of 4 or 1/4.
Though there is a greater chance that the cube drawn will be red, there is still a 1/4 chance that it might be blue.
Exploring
Over the next three days we work in pairs to make our own bags of cubes. We swap them with our friends to see if they can guess "What’s in the bag?"
Session 2
Ask the students to 'think aloud' so other students can build on their understanding.
Session 3
I want you to create a data display of the colours. You are free to use whatever display you want. What display might you use? (Students might suggest bar graphs, pie charts, frequency tables, pictographs, etc.)
You can make as many trips as you need up here to view the data but you must create your display back at your desk. Give your students adequate time to create their displays.
Explain the rules of the game to your students.
I am putting all the cubes back into the paper bag. Nothing in the set of cubes has been changed.
With each turn, one person from the class will take out a cube, tell you what colour it is, show you the cube then put it aside. It will not be put back into the bag.
Before the cube is taken out you need to make a prediction about what colour it will be. Record your predictions like this:
There will be 24 rounds. At the end of the game the +5 and -1 scores will be combined. The player with the highest score wins.
How might your display be useful?
Watch for the following behaviour from your students:
In the bag are 6 yellow, 4 blue, and 2 red cubes. What coloured cube do you think will be drawn next?
Session 4
In this session students explore the impact of ‘tag and release’ methods of sampling. Such methods are common to biological research in which animals need to be returned to their habitat. The lake in this session could be named as a local lake to relate to students' experiences.
Suppose you are a scientist. The fish in the lake are precious so you want to return each fish after you have tagged it. How can you get an accurate picture of:
Types of freshwater native fish.
What is the advantage of tagging the fish?
Students will know if a tagged fish is caught that it is already represented in the data.
I have a lake full of fish here. You are the scientist and I am your fish catching assistant. Our aim is to find out the fraction of each species and get an estimate of the total number of fish.
Take some time to think about how you will record the data.
You might need to suggest using a tally chart and to indicate with an asterisk if the cube is tagged (caught before).
Do their fractions match the distribution of cube colours in the sample?
Do they acknowledge that the predictions are very uncertain, given the small sample size?
Is it better to think about each sample as separate or treat the combined results as one big sample?
Pay particular attention to the issue of the total number of cubes.
For example, suppose five of the 20 cubes selected in the last sample are tagged.
What can this tell us about the total number of cubes in the bag?
About one quarter of all the cubes in the bag are tagged.
How might we predict the total number of fish from that?
If the ten cubes we tagged at first make up one quarter of all the cubes in the bag, how many cubes might be in the bag?
Students might realise that four quarters make the whole population so 4 x 10 = 40 is the best prediction they can make.
How certain are you? What could we do to improve the reliability?
Students might say that tagging as many fish as possible would improve the reliability of the prediction. In fact, if we keep tagging fish we might reach a stage when every fish we catch is tagged.
Why is 'tag until every fish is tagged' not feasible in real life? (Population may be very large, the more animals that you tag the harder it is to find an animal that isn’t tagged.)
Tell them to record the data in an organised way and justify the predictions of fractions and total number.
How do they deal with fish that get selected but are already tagged? Do they tag them again? Does double or triple tagging improve the data? How? Monitor for any students who may need further support and provide as required.
Session 5
In this final session, pose the following problem to your students (Copymaster 1). Use their response to consolidate learning and to assess achievement of your students on the probability outcomes.
Look for the following:
Question One: Does the next sample of ten reflect the previous sample but also show variation from that sample? Students should show that the two samples will vary.
Question Two: Can students represent the part-whole relationships as fractions?
Question Three: Do students acknowledge that a green jelly bean could still be in the bag, but it has not been selected in the two samples? A sophisticated response will state something about the likelihood of a green being in the bag.
Question Four: Does the sample of five reflect proportions similar to those in the collected samples, with some variation?
After the students complete the task independently gather the class to discuss the ideas above. Students might reflect on how they might change their answers following the discussion.
Dear parents and whānau
This week in maths we have been making predictions about "What’s in the bag?" by drawing cubes from the bag (and then returning them). We found out that the more turns we had the more we knew about what was inside the bag. This knowledge helped us make predictions about what cube we might draw out next. However we also found out that with chance involved you can never know the outcome for sure. At home this week we want you to play "What's in the bag?" with your child.
What’s in the bag?
Put a total of six buttons (or counters) of two colours in a paper bag or container that you can’t see into. Your child might like to give the colours a context such as tennis balls and cricket balls, or kowhai flowers and mānuka flowers. Ask your child to try to work out what colours the six buttons are by drawing out the buttons one at a time. It is important that the button is put back into the bag each time. Let your child select one button as many times as they want until they are ready to predict the colours. Ask them to explain their prediction and then let them look in the bag.
Next time let your child make up a bag for you to work out.
Enjoy making your predictions and seeing if you are right!
Matariki - Level 3
This unit consists of mathematical learning, at Level 3 of the New Zealand Curriculum, focused around celebrations of Matariki, the Māori New Year. The sessions provide meaningful contexts that highlight Māori culture and provide powerful learning opportunities that connect different strands of mathematics.
Session One
Session Two
Session Three
Session Four
Session Five
Session one involves students working cooperatively on two puzzles. To solve both puzzles they will need to evaluate which clues are most important and the best order in which to deal with the clues. They will need to organise their information, possibly using the Copymaster, and check to see that their solution satisfies all of the clues.
In the final part of the lesson a dice is used to simulate which stars will be bright and which stars will be dull in order to predict the year ahead. As a class students will collect experimental data and look at which outcomes are most likely. While it might be expected that three bright stars and three dull stars is most likely, students should note variation in the number of stars and how brightness and dullness are distributed. This activity may provoke students to consider theoretical probability , for example, all the ways three bright and three dull stars might occur or the likelihood of all six stars being bright.
Session two uses tukutuku designs as a stimulus for continuing and finding rules for linear patterns. Students are encouraged to think spatially to ‘chunk’ each design into parts to structure how a given pattern might be ‘seen’ and how the pattern grows as a new layer is added. Examples of how hypothetical students might see a layer are introduced to encourage flexibility in the way students structure the pattern. They are asked to use recursive thinking (one term to the next) to imagine how the pattern of layers will grow. They apply their structuring to further layers and may even develop a general rule for any layer in the tukutuku design.
Session three uses pōtaka (spinning tops) as a vehicle for thinking about geometry and measurement. Students find ways to locate the centre of a circle to position the spindle of their top correctly. They also use measurement to vary the length of spindle and weighting of their tops and time the spin time. Data is gathered about the tops, including spin time, diameter, spindle length and weighting. The multivariate data is used to look for relationships between these variables. Graphs are drawn to detect and communicate any relationships.
Session four looks at the mathematics of kōwhaiwhai patterns. Examples of frieze patterns can be seen in some kōwhaiwhai patterns. These are created by combinations of translation, reflection and rotation of a repeating element. Students create an element using ideas like closure of spaces and properties of spirals. They use the element to create a kōwhaiwhai pattern by choosing a transformation to move the element. Other students try to figure out what transformation another student has used to generate their pattern.
Session five looks at the traditional game of Kī-o-Rahi to consider the properties of circles and scale drawings. Students use geometry and measurement ideas to work out how best to mark out the field. They need to recognise that a circle is a set of points of equal distance from the centre. They also need to use a scale of 1 square to 1 square metre on grid paper to mark the field in correct proportions. The scale is used to work out how far players run in a move within the game.
The learning opportunities in this unit can be differentiated by providing or removing support to students, or by varying the task requirements. Ways to support students include:
Although the context of Matariki should be engaging and relevant, for the majority of your learners, it may be appropriate to frame the learning in these sessions around another significant time of year (e.g. Chinese New Year, Samoan language week). This context offers opportunities to make links between home and school. Consider asking family and community members to help with the different lessons. For example, members of your local marae may be able to share local stories and traditions of matariki with your class.
Te reo Māori language is embedded throughout this unit. Relevant mathematical vocabulary that could be introduced in this unit and used throughout other learning include āhua (shape), shape names (e.g. whetū - star), hangarite (symmetry, symmetrical), whakaata (reflect, reflection), huri (rotate, rotation), tātai (calculate, calculation), tāpiri (add, addition), tūponotanga (chance, probability), and ine (measure).
Prior Experience
The activities are mostly open ended, meaning they cater for a range of achievement levels. It is expected that students have some experience with naming and classifying basic geometric shapes, with measuring lengths in centimetres and metres, and with translating, reflecting and rotating shapes.
Session One
In this session students apply their geometry knowledge to solve two puzzles about the stars in the Matariki cluster. They will find out how the brightness of each star was used to predict the coming year, such as when to plant crops, and apply probability to estimate the chances of a ‘perfect year’.
The first new moon after the rising of Matariki in June signals the middle of winter and the beginning of a new year. It is a time to celebrate life and remember those who died in the previous year.
Students might say that the year will be windy and sea fishing will be poor. However fishing for freshwater food, like eels, will be plentiful. The crops will do well and rain will be balanced, not too much and not too little. The forest will have a lean year so don’t count on lots of birds to eat.
Do students notice that there is a one half (50%) chance of getting each option on a dice roll?
Session Two
In this session the students look for patterns in tukutuku patterns. In particular they find ways to count the number of tuinga (cross stitches) in a given pattern and use their counting strategy for one member of the pattern to predict further members. They are also encouraged to look for relationships between variables in each tukutuku pattern.
The session is driven by two resources:
Session Three
Matariki was a time when food was stored, and the weather was not always pleasant outside. So whānau (families) spent time together engaging in cultural pursuits such as storytelling, arts and games. A popular game for tamariki (children) was to make spinning tops. The tops were carved from hardwood like mataī. A whip made from a stick and flax fibre was used to guide the top over obstacles and keep it spinning. A picture of a traditional top can be found at:
There are cheap and accessible materials available to create tops. This video takes a scientific approach to making different tops:
Some students might notice changes to the measurement from the point to where the ruler crosses the other side.
If the measurement changes how will I know when I have a diameter?
The ruler marks a diameter when the measure is at its greatest. The measure declines as the ruler is rotated from that position.
The centre is at the midpoint of the diameter (C).
In fact much specific detail will be lost as the top rotates so encourage your students to keep the design simple. They could decorate directly onto the plastic with spirit based pens by cutting a circle of paper the size of the top, decorating that and putting it inside the top is a safer option.
How accurate do we want to be?
Will each person get only one spin or will they be allowed many spins?
If many spins are allowed, which time is counted? (best, worst, middle, average, total)
Students might come up with summary questions, like “What is our average spin time?”.
Since most of the variables are numeric you might use dot plots or stem and leaf graphs to display the data. For example, to make a dot plot use a skipping rope to make a long line and ask the students to order their cards along the line by time. Identical times can be arranged vertically on the same spot.
Do tops with weights spin longer than tops without weights?
Comparison questions can be investigated by creating a graph for each group (Yes and No) and comparing the distributions of times.
Is a shorter spindle point best for improving spin times?
You could put the data from both variables into a spreadsheet (e.g. using Microsoft Excel or Google Sheets) and graph the relationship using a scatter plot.
Session Four
In this session students investigate kōwhaiwhai patterns. One of the basic units of kōwhaiwhai is the koru or fern frond. Nowadays kōwhaiwhai refers to any figure generated using the koru but your students will investigate some of the designs found in wharenui (meeting houses). These designs are used on the tāhū (ridgepole) and heke (rafters). Tāhū and heke are the spine and ribs of the tipuna (ancestor) embodied in the wharenui so kōwhaiwhai is a way to acknowledge the mana of that important person.
Ask: How big are the circles? The small circle is located inside the smallest square. Let’s call that a one "square".
Students might notice that the squares grow in a sequence, 1 x 1, 1 x 1, 2 x 2, 3 x 3, 5 x 5 (this is an interesting leap – Why five?).
Session Five
In this session students investigate the geometry and measurement associated with the traditional game of Kī-o-Rahi. The game is based on the intrepid struggles of Rahi-tutaka-hina (Rahi for short) to rescue his wife Ti Ara-kura-pake-wai who was captured by the patupaiarehe (fair-skinned fairies). You can read the legend, and an article about the game, in School Journal, Part 2, Number 3, 2010. Click to download a literature unit based on the legend.
The rules for Kī-o-Rahi vary a bit from place to place but those variations are relatively minor. There is now a national championship for the game where teams from all over Aotearoa gather to compete. An instructional video is available from the link below:
Quarters of 15 minutes each would allow little time for setting up, rest stops, and packing up, so quarters of ten minutes are the usual practice.
Look for students to:
Imagine a Kioma player who runs in straight lines and touches all the seven pou. How far does she run in metres to do that?
Dear parents and whānau,
This week we are exploring some mathematical ideas with activities to celebrate Matariki, the Māori New Year. We will be finding out the geometry of the Matariki star cluster, looking at algebra in tukutuku patterns, making spinning tops and testing them, creating kōwhaiwhai patterns, and marking out a field to play Kī-o-Rahi.
These activities involve algebra, geometry, measurement and statistics so we will be very busy and doing a lot of mathematical thinking.