Session 1
The purpose of this session is to learn how to make and represent equal parts and to read and write words and symbols for fractions. The formal language of ‘unit fraction’ and ‘proper fraction’ is also introduced.
Activity 1
- Begin by placing a length of play dough and a plastic knife in a place where all students in the group (class) can see. Distribute word cards (only) from Copymaster 1 to each pair of students.
- In their pairs ask students to discuss how they would make the equal part on their word card, if they were to use the play dough. Choose several students to explain their strategy to the group. Look for two main strategies:
- Equal partitioning by halving (symmetry), e.g. Halving halves to get quarters
- Iterating, estimating the part size and mapping it end on end to see if it works
- Listen for, and highlight a description of, the number of cuts that will be made and the language of equal parts, e.g. Three cuts creates four equal parts called quarters.
- Make sure each play dough length is the same so there is a uniform whole. Use the fraction cards to compare two fractions. Discuss which fraction is largest. You might cut play dough lengths to confirm predictions.
Is there a way to look at unit fractions like these and know which fraction is larger?
Do students recognise that a smaller denominator means the whole is cut into less parts so the parts are larger? - Use the play dough fractions to make non-unit fractions as well, such as three quarters and five eighths. Non-unit fractions have a whole number more than one as the numerator.
Activity 2
- Randomly distribute symbol cards (Copymaster 1) to the student pairs. You will need to split the class into two groups of pairs and provide each group with a full set of cards. Have students discuss the symbol and, if possible, agree about how to read it.
- Pairs display, and read, their word cards aloud to the group, one at a time. As they do so, the pair that has the matching symbol card offers it to the holders of the word card. The donor pair must explain why they are giving the symbol to the word holder pair. Can they give clear explanations of the symbolic representation of the fractional part? Model this if necessary.
Highlight the fact that each of the symbols is known as a unit fraction because it has 1 as the top number and it tells that there is just 1 of the equal parts being referred to (highlight the fact that one quarter and one fourth are different names for the same part).
Activity 3
- Make a range of shapes, made from coloured paper, available to the students. Copymaster 2 could be used if you prefer.
- Explain that they are to select a paper shape each and fold it to make a fractional part matching their word and symbol, then write the word and symbol on each of the equal parts. Encourage them to consider which shape would be the best to choose, given their fraction. For example thirds of equilateral triangles are easy to fold. Fifths of pentagons, eighths of octagons, etc. are easy to find after the centre of the polygon is located. Seventh and ninth parts are challenging. Choosing a paper strip might be wise and a strip in halves can be used to simplify the challenge.
- After students select, fold, and label their fractions of a shape, ask them to consider what they would do if the shape was different.
Can a triangle be folded into quarters when each part must be equal? - Encourage those who finish quickly (for example those with 1/2 or 1/4) to complete the task with a different shape, or, try a more difficult unit fraction.
- Let your students pair share their results, then have a korero as a class/group about why some fractions were easier to fold than others. Discuss how students approached the ‘trickier’ fractions. Highlight halving as a useful way to simplify the challenge.
- Ask your students to cut the shapes into their fraction parts. Put the pieces into an empty box and give the pieces a solid shake. Use monitors to deliver a collection of pieces to each pair.
Your job now is to reconstruct what the whole looked like for each piece you have.
What information do you have to help you?
Let students work out the appearance of the original whole for each fraction piece they have. Be aware that there are multiple possible answers depending on how the pieces are arranged. It is an excellent challenge to create as many different wholes as possible for a given fraction piece.
Activity 4
- Ask all your students to fold a paper strip into tenths, and write 1/10 on each of the equal pieces. Cut the strips into tenths.
Why are these pieces called tenths? (ten equal parts make one whole)
Where have you encountered tenths? (Students may connect to money and decimals in general) - Count in tenths with students laying the pieces down end on end as they count, ”One tenth, two tenths, … ten tenths.”
What comes next?
How might we write eleven tenths? (11/10 or 1 1/10) - Write ‘unit fraction’ on the class/group chart. Repeat and write the explanation that any fraction with a top number of 1 is called a unit fraction because it is a single piece. Add the words ‘proper fraction’ to the group chart, explaining and recording that a fraction in which the top number is smaller than the bottom number is called a ‘proper fraction’. Record “Improper Fraction”.
If 11/10 is an improper fraction I wonder what that means? (numerator is greater than denominator) - Write 3/10 on the class chart. Ask students to take 3 of their tenth pieces and write the words and symbols for these three parts. Discuss and model the fraction symbol as appropriate, highlighting the fact that the bottom number tells us how many equal parts make one (ten), and the top number (3) tells us how many of those equal parts we have chosen.
Also point out that often we see the flat line separating these numbers (this line is called the vinculum) shown with a horizontal or sloping line like this, 1/2, 1/4. - Write other non-unit fractions with tenths on the chart, having students take that many tenths and recording the appropriate words and proper fraction.
What parts would we get if we folded tenths in half?...in quarters? …in tenths? The last fold produces hundredths.
Activity 5
Conclude this session by writing the words and symbols for common unit fractions and some other proper fractions. Brainstorm on the class chart/book what has been learned about fraction symbols. Explicit links can be made here to Kupu Māori.
Session 2
The purpose of this session is to introduce the language of numerator and denominator and practise using and interpreting fraction symbols. Students work from whole to part and part to whole. An understanding of different ways of showing one whole is also developed.
Activity 1
- Distribute the cards from Copymaster 1 and have each student read out their card. As they listen they should identify the person with a matching card. This person becomes their partner for this session.
- Introduce a Fraction Dictionary.
Write 'numerator' in the dictionary. Explain that it is the top number in a fraction. Have several students come up and write their favourite fraction and circle in a different colour the top number.
Ask student pairs to discuss what the job of the top number is and to suggest a definition of 'numerator'. Numerator means the counter so that number represents the number of parts that are chosen.
Write 'denominator'. Read the word together, and discuss the meaning. It is important that students know that denominator represents the size of parts, how many of those parts make one.
Have several students again write their favourite fractions, this time writing over the denominator number in a different colour (not the same as that used for the numerator).
Activity 2
- Make sets of Fraction Pieces available to the students.
Pose and write on a chart the question:
Can the numerator in a fraction be the same as the denominator? - Use the fraction pieces.
Who can make fractions where the numerator and denominator are equal? - Let students make fractions like 2/2, 3/3, 4/4, etc. Do students notice that the fractions are equivalent to one (whole)?
Explain why any fraction where the numerator and denominator are equal is another name for one.
Can the numerator be greater than the denominator? - Ask students to make improper fractions, such as 3/2, 5/3, 7/4, etc…
What is true of all fractions where the numerator is greater than the denominator? (All improper fractions are greater than one [whole]).
Activity 3
Have students play Roll for 3 in pairs.
(Purpose: To make one from equal parts and recognise the equivalent fraction notation) Students each need a Fraction Pieces page. The game is played in pairs or threes.
- The players take turns to roll a standard dice and colour in that many parts of one of the circles they have selected. For only one roll they can nominate the number they get on the dice (1-6). It is best to keep that option until the last roll as they must complete each circle exactly.
- The winner is the player who is first to complete their circles and has correctly recorded each one (whole) as a fraction, e.g. 3/3, 8/8, once each circle is complete.
The important rule is that they can colour fewer parts and keep building to make one whole, but they must, at some point, roll the exact number needed to complete a whole.
For example, Player One rolls 6. She colours 6/8 of her circle divided into eighths. On her next turn she rolls 3. She cannot use this to complete her eighths circle because 6/8 + 3/8 is more than 8/8 (1 complete circle). She must roll 2 or two 1s in different rolls to compete 1 exactly. She can however work on her tenths circle and take 3/10 and add this to her 1/10. - Emphasise that the students should record their fraction additions.
Activity 4
Introduce the game Fraction Snap. (Copymaster 3).
- Hold up selected pairs of cards from Fraction Snap asking the students to decide for themselves if the two cards match. If so they slap the ground as if playing Snap. Discuss examples of correct ‘Snaps’ so the game is well understood.
For example:
 is a pair, and so is
- Play Fraction Snap with a full set of cards (Copymaster 3).
- Each player takes a turn to turn up a card from their pile and place it face up in the centre of the group. As a student adds their card to the pile of face up cards, all players watch closely and are ready to say ‘Snap’, quickly putting their hand on the pile if the played card matches the one that was top of the face up pile. The first player to say ‘Snap” collects the pile and adds it face down to the bottom of their existing pile.
- The game continues until one person has all the cards or until players decide to stop.
Session 3
The purpose of this session is to use materials to develop an understanding of fractions of sets. Equal sharing of sets is linked to regions models of fractions. Children make connections with equal sharing experiences in their own lives.
Connections between repeated addition and multiplication are made as part-to-whole fraction problems are explored.
Activity 1
- Make recording material available to the students.
Distribute a shape from Copymaster 4 to each student.
This activity requires students to work from part to whole rather than the usual whole to part requirement. - Explain that each shape is a fraction or part of a whole shape. Ask students to show, with drawings, what each whole shape might look like. Model an example and show they can cut out each shape then draw around it. (Alternatively attribute blocks or foam geometric shapes can be used. The students will need to be told what fraction of the whole they are working with.)
- Give the students the opportunity to explore the problems before prompting with questions like, “If that is 1/4 of the shape, how many pieces like that will be in the whole shape?” or, “Do you think that there might be another way to show the whole shape?”
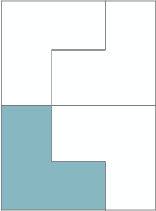
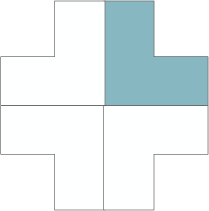
- Have students complete their drawings, writing the unit fraction in each part and an equivalent fraction for 1 beside their drawing (eg. 4/4, 2/2). Have them buddy share their results. Challenge the students to see how many ‘1’ shapes they can make for any single fraction piece.
For example if this is 1/4:
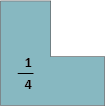
the whole shape might look like any of these:

Have students find multiple solutions with the other shapes, writing the fraction in each part and the one whole fraction (4/4, 8/8 etc.) beside the whole shapes.
Activity 2
- Make plastic beans available to the students.
Have the students each take up to 4 beans and place them on their coloured fraction piece.
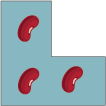
- Explain that these beans, like their shape, are just a fraction of a set of beans. It’s the same fraction as the fraction shape they have (1/4, 1/3, 1/2 etc.). Pose the question:
If this is a fraction of the set, how many beans are in the whole set?
- Give the students the opportunity to explore the problem before prompting with questions like, “How many quarters are in a whole set?” “How can you use your shape pictures to help you work out how many beans would be in the whole set?” If the students' exploration is unsuccessful, stop the class/group and model an example, by putting the same number of beans on each of the fraction parts in the drawing of the whole shape and skip counting (or if appropriate multiplying) to reach a total.
- Model and record several examples on the class/group chart.
For example : 1/4 of a whole set is 3 beans, 4/4 make 1 whole, so 4 lots of 3 beans will make 1 whole set.
“3, 6, 9, 12” or “4 x 3 = 12” - Discuss efficiency, that is which method of calculation requires the least amount of work. Have students explore and record at least 3 more examples using different fractions and shapes and different small amounts of beans.
Activity 3
- Conclude this session by asking students to give examples of when someone has shared with them and they had received an equal part of a whole set of something.
- In the class book record some of the students’ story examples: For example:
Mia’s friend Amy gave her 1/2 of her jellybeans. Mia had 5. How many did Amy have altogether before she shared?
Tony received 6 pretzel sticks from Tama who told him he’d given him 1/3. How many did Tama have to start with?
Encourage the students to picture these fractional amounts and what the whole amount might look like. Ask students to describe what they pictured in their minds.
Session 4
The purpose of this session is to use materials to reinforce the whole to part relationship and to continue to use fractions of regions to build an understanding of fractions of sets. The key connection is made with the operation of division. One view is to see how many equal sets can be made from the starting set, and to work out the number of items in each equal set. This is called partitive division.
Activity 1
- Begin this session by reviewing Session 2, posing some fractional part to whole contextual problems.
For example: You were given 6 cherries. This was one third of the total in the bag. How many were in the bag to start with?
Your whānau were given 4 kūmara. This was one sixth of the total kūmara in the hāngi.
How many were in the hāngi to start with? - Encourage students to image the problem and solution, but if appropriate, have a student model with an appropriate drawing.
- Repeat with several examples, highlighting repeated addition and multiplication as strategies for reaching a solution. Discuss and emphasise the efficiency of multiplicative strategies that are expected at Level 3.
Activity 2
- Have the students collaborate (mahi tahi) in pairs with recording materials available.
- Pose the problem: Here is a container of strawberries. There are 12 berries in the container. You share the 12 berries equally between the two of you. How many strawberries will you each get? What is 1/2 of 12?
Show and write how you work out your share, using pictures, words and symbols. - Pose several more examples with different numbers in the container: What is half of: 14, 20, 21, 25?
- Give the students time to draw, record and write about their sharing. Explain that these will be shared with other students and displayed.
Change the number of shares and starting number of strawberries to add more challenge. For example:
1/3 of 24 1/5 of 30 1/8 of 64 1/6 of 42 1/7 of 42
Activity 3
- Have students share their work and comment on any examples where they use fractions of regions (a shape divided into halves) to support their calculations. Imaging of sharing, or simply calculating with numbers are signs of increasing sophistication.
- On the class chart write:
Half of twelve
12 shared between 2
12 ÷ 2
12/2 - Take time to discuss the important connections between these ways of recording. Highlight:
- half of twelve is a two-way equal share of 12
- when 12 is shared with two people we can write 12 ÷ 2 = 6
- ÷ is the sign for division. It looks a bit like a fraction itself
- 12/2 also means twelve shared between two. It also means 12 halves which makes a total of 6 ones.
- In sharing both 21 and 25 between them, the student pairs will have had to share 1 of the strawberries and will have written 1/2. Highlight that we read this as ‘one half’ and that this symbol is also showing 1 ÷ 2, or 1 shared between 2.
The symbol is an expression of both the problem itself and the quotient (resulting share).
These key ideas about mathematical notation should be regularly reviewed. - Transfer these ways of recording to the more complex example, such as 1/3 of 21 or 1/8 of 24
Activity 4
- Remind students how they used shapes (regions) in Session 3 to help solve problems. They may find the shapes useful now.
- Now pose equal sharing word problems such as:
12 strawberries shared between 3 people, 1/3 of 12 (or 12/3)
16 shared between 4, or 1/4 of 16 (or 16/4)
20 ÷ 5, or 1/5 of 20 (or 20/5)
21 ÷ 4, or 1/4 of 21 (or 21/4) - Have students use pictures, words and symbols to record their solutions to the problems. Have students pair share their work.
Activity 5
Pairs of students can be challenged to write their own fraction problems for their partner to solve.
Session 5
The purpose of this session is to develop a conceptual understanding of finding a non-unit fraction of a set. The language introduced in this unit is consolidated.
Activity 1
- Begin this session by highlighting strengths of some of the student work from Session 4, noticing the way they have drawn their diagrams and recorded their ideas using words and symbols.
Make coloured beans or other objects to be shared, and paper available to pairs of students. - On the class chart write and pose this problem:
There are 25 beans in a packet. You plant 2/5 of the beans. How many beans do you plant? - Ask students to solve this problem in pairs, using equipment as required. Require them to record their strategies and share their methods and answers (solutions) with another pair.
Do students recognise that finding one fifth of 25 is needed first?
Do they build two ‘iterations’ (copies) to make two-fifths?
Are their strategies only equipment based or do they use numbers and operations to anticipate the result? - Record on a chart students’ methods for solving the problem.
For example: First you have to find one fifth so you divide 25 by five. You’re asked for two fifths so you have to add two fifths together or times one fifth by two. You write this 25 ÷ 5 = 5, 5 + 5 = 10 or 2 x 5 = 10
Notice who uses equal sharing (into regions) and who uses their knowledge of multiplication (and division) to solve the problem. - Ensure that equipment is available and pose further problems, having students show and record their solutions in their preferred ways.
For example:
There are 16 beans in a packet. You plant 3/8 of the packet. How many beans is that?
There are 18 beans in a packet. You plant 5/9 of the packet. How many beans is that?
There are 18 beans in a packet. You plant 5/6 of the packet. How many beans is that? - Summarise finding a non-unit fraction of a set to support students to generalise the operation. Encourage explanations like “When you are finding more than a unit fraction of a set, you divide the number in the set by the denominator of the fraction. This gives you the unit fraction of the set. Then you multiply by the numerator of the fraction because this tells you how many of these equal parts are needed.”
For example: To find 3/8 of 16:
Find 1/8 first by solving 16 ÷ 8 = 2.
Find 3/8 by solving 3 x 2 = 6.
Give the answer as 6 is 3/8 x 16 = 6.
Activity 2
Have students play Telling the Truth (Copymaster 5) in pairs.
(Purpose: to identify the correct fractions of sets)
- The aim of the game is to be the player to collect the most pairs of questions with correct answers. Five cards are dealt to each player who must firstly decide which of the cards in their hand do not tell the truth. They discard these cards, turning them upside down and placing them to one side (they may need to be checked later in the game). They then find any matching pairs in their hand and place these face up in front of them.
- The players then take turns to ask for an answer card to any of the question cards in their hand, or to ask for a question card that matches an answer card in their hand.
- Upon Player One’s request for a card, if Player Two gives an untrue card, Player Two must miss a turn. Player One may immediately make another request.
- If Player Two has no suitable cards he or she tells Player One to pick up from the pile. Each time a player picks up or receives a card they must check it for accuracy.
- The player with the most correct matching pairs when all the cards are used, is the winner.
Activity 3
Conclude this session with a discussion of the game and summary of learning.
Session 6
Remind students of their learning from Activity 1 of Session 5 about finding a non-unit fraction of a set. The difference in this session is that there is no longer a predetermined number in each set.
It will be helpful to model solving a challenge with the group/class first. As students will need to find a number of cubes/tiles that can be equally split into each fraction in the challenge, a way to support students with this is to explain the following:
For the challenge ‘Build a design that is 1/3 blue and 1/4 yellow’, the number of cubes/tiles in the set has to be able to be split equally into thirds and into quarters. The simplest way to do this is to find a common multiple of the denominators involved, which in this case is 12.
Note: 12 is not the only number of cubes/tiles that could work for this challenge. In fact, any common multiple of 3 and 4 will work for this challenge.
Fraction Mosaics
You will need a bunch of cubes or square tiles in at least four colours (red, yellow, green, blue), or small square pieces of paper. The task is to build a mosaic design that matches the description in your challenge. Collaborating in pairs (mahi tahi), build your mosaic design and be ready to have a korero about it with the rest of the group/class. These mosaic designs could be combined to create a large siapo or tukutuku design, or a design for a new school garden. Links could be made with designs you have recently seen in your community (e.g. at the marae). Lay a transparent grid over an image of relevant art, and as a class come up with a list of fraction statements that describe the use of colour (e.g. 3/4 of this art uses the colour blue). This could be framed within the context of looking at how early Māori people used pigments derived from natural materials (e.g. clay deposits, iron oxide) to create paint.
Challenge list:
- Build a design that is 1/3 blue and 2/3 red
- Build a design that is 1/2 red and 1/4 green
- Build a design that is 1/5 yellow and 3/10 green
- Build a design that is 1/3 blue and 1/4 yellow
- Build a design that is 1/4 red and 1/4 blue
- Build a design that is 1/5 red, 4/10 green, and 2/5 blue
- Build a design that is 5/12 blue, 1/6 red, and 2/6 yellow
- Build a design that is 1/3 yellow, 1/6 red, and 1/2 blue
- Build a design that is 1/3 red and 1/8 green
- Build a design that is 2/3 yellow and 1/7 red
- Build a design that is 3/5 blue and 1/4 yellow
Students could create their own challenges for another pair to solve. What is the same and what is different about the way you solved it and the way another pair solved it?
Questions you could use for group korero:
- How did you get started?
- How did you decide what to do?
- How did you decide how many cubes/tiles to use?
- Is there another way to complete your challenge? How do you know?
- Can you prove that your design matches your challenge?
Areas of Rectangles
In this unit students learn to use the multiplication formula to find the area of a rectangle. Using proportional reasoning students explore what happens to the area when the length and/or height of a rectangle is doubled.
Area is the amount of flat surface enclosed within a shape. Commonly used standard units for area are cm2 (square centimetres), m2 (square metres), and km2 (square kilometres). Squares are used to introduce this context, because they are an example of a two-dimensional shape that iterates. This means the shape can be repeated over and over again, without any gaps or overlaps.
Rectangles are the easiest shapes to find the area of, because the array structure of repeating units (squares) is most obvious. Consider this rectangle filled with square units:
The units are arranged in three rows of five squares. The total number of units can be found by multiplication, 3 x 5 = 15. Similarly, the rectangle contains five columns of three squares, so 5 x 3 = 15 also gives the total area. This is an example of the commutative property - you can multiply numbers (e.g. 3 and 5) in any order and get the same result (15).
The learning opportunities in this unit can be differentiated by providing or removing support to students, or by varying the task requirements. Consider using these strategies to support students:
The context for this unit can be adapted to suit the interests, cultural backgrounds, and experiences of your students. Students could be challenged to find the area of a room in their own home, a community or school garden, their classroom, a community sports ground, skate park, or marae. A diagram with measurements could be provided if the area is not readily accessible during school time.
Te reo Māori vocabulary terms such as mehua (measure), mitarau (centimetre), and tapawhā rite (square) could be introduced in this unit and used throughout other mathematical learning.
Session 1
In this session students are introduced to the idea of using multiplication to find the area of a rectangle.
How many square tiles will cover this area?
Modelling these processes on a whiteboard, interactive whiteboard, or with the use of materials could support students to develop their thinking.
Do students recognise the array structure in the arrangement of square units?
Can we count the squares even more efficiently?
Look for students to:
Recognise that much will depend on their knowledge of multiplication facts and strategies. Smaller rectangles that utilise simpler times tables could be drawn and used by pairs of learners.
Answers: A (3 x 7 = 21), B (6 x 6 = 36), C (4 x 11 = 44), D (11 x 3 = 33), E (7 x 7 = 49), F (8 x 6 = 48), G (10 x 2 = 20).
What do the answers tell us about these rectangles?
How big are the little squares? Students might measure with a ruler to check that the units are square centimetres.
Ask students to include the unit in their answers, e.g. 21cm2. Recording the notation for each rectangle is good practice.
Sessions 2 and 3
What do we mean by a formula?
Do students explain that a formula is like an algorithm, or rule, that we can follow to get the same result each time?
Record W x L = A. This is a mathematical formula written as an equation.
I wonder what the letters W, L and A might represent?
For example, Rectangle B had seven rows of five squares.
The row gives the length of the rectangle. In the case of B length equals 5. (rub off L in the formula and write 5 in its place)
The number of rows gives the width of the rectangle. In the case of B width equals 7. (rub off W in the formula and write 7 in its place).
The formula now reads 7 x 5 = A. I wonder what A equals. What value for area makes the equation true and matches the formula?
A systematic approach involves starting with 1 as a factor then increasing the smallest factor by one and testing 72 for divisibility.
1 x 72, 2 x 36 (72 ÷ 2 = 36), 3 x 24 (72 ÷ 3 = 24), 4 x 18 (72 ÷ 4 = 18), 5 x (72 is not divisible by 5), 6 x 12 (72 ÷ 6 = 12), 7 x (72 is not divisible by 7), 8 x 9 (72 ÷ 8 = 9).
If the process continues the factors will appear in reverse order, e.g. 9 x 8 = 72. 8 x 9 and 9 x 8 are essentially the same rectangle though they may appear differently if the direction of the label is considered.
Discuss criteria for eliminating labels. For example, a label with a width of less than 5cm might be considered too ‘skinny.’
Discuss the best options, cut them out at real size, then use a real jam jar (or object that is relevant to the context of the learning) to consider how well each label/array design will work.
Do they apply the W x L = A formula?
Session 4
In this session students explore using proportional reasoning to find areas of rectangles.
Session 5
In the session students demonstrate their ability to apply measurement of area independently. Consider what culturally relevant contexts can be incorporated into this task, to increase the engagement of your learners.
The following links provide pages from Figure It Out books that are suitable:
Students might also create a mat design and provide the dimensions and areas of the rectangular pieces that compose it. An example is given below:
Family and whānau,
This week at school we have been calculating the area of rectangles using the multiplication formula of length x width. We have been working out the areas of composite shapes by marking the shapes into rectangular shapes. For example,
At home this week your child is to draw 5 different composite shapes that each have a 20cm2 area. The lengths of the sides should be marked. Ask them to explain to you how they worked out the area for each one.
For extension, your child could measure the area of different rooms around the house, and then calculate the total area by treating the house as a composite shape.
Figure it out
Some links from the Figure It Out series which you may find useful are:
Cuisenaire Rod Fractions: Level 3
This unit introduces the idea that fractions come from equi-partitioning of one whole. Therefore, the size of a given length can be determined with reference to one whole. When the size of the referent whole varies, then so does the name of a given length.
‘Fractions as measures’ is arguably the most important of the five sub-constructs of the concept of rational number (Kieren, 1994) since it identifies fractions as numbers, and is the basis of the number line. Fractions are needed when ones (wholes) are inadequate for a given purpose (e.g. division). In measurement, lengths are defined by referring to some unit that is named as one. When the size of another length cannot be accurately measured by a whole number of ones, then fractions are needed.
For example, consider the relationship between the brown and orange Cuisenaire rods. If the orange rod is defined as one (an arbitrary decision) then what number is assigned to the brown rod?
Some equal partitioning of the one is needed to create unit fractions with one as the numerator. For the size of the brown rod to be named accurately, those unit fractions need to fit into it exactly. We could choose to divide the orange rod into tenths (white rods) or fifths (red rods). By aligning the unit fractions we can see that the brown rod is eight tenths or four fifths of the orange rod.
Note that eight tenths and four fifths are equivalent fractions and the equality can be written as 8/10 = 4/5. These fractions are different names for the same quantity and share the same point on a number line. The idea that any given point on the number line has an infinite number of fraction names, is a significant change from thinking that occurs with whole numbers. For the set of whole numbers, each location on the number line matches a single number. Some names are more privileged than others by our conventions. In the case of four fifths, naming it as eight tenths aligns to its decimal (0.8) and naming it as eighty hundredths aligns to its percentage (80/100 = 100%).
Specific Teaching Points
Understanding that fractions are always named with reference to a one (whole) requires flexible thinking. Lamon (2007) described re-unitising and norming as two essential capabilities if students are to master fractions. Re-unitising enables students to flexibly define a given quantity in multiple ways by changing the units they attend to. Norming enables students to operate with the new unit. In this unit of work, Cuisenaire rods are used to develop students’ skills in changing units and thinking with those units.
Consider this relationship between the dark green and blue rods. Which rod is one? Either could be defined as one and the other rod could be assigned a fraction name.
If the blue rod is one then the dark green rod is two thirds, as the light green rod is one third. If the dark green rod is one then the blue rod is three halves since the light green rod is now one half.
Re-unitising and norming are not just applicable to defining a part to whole relationships like this. In this unit students also consider how to use re-unitising to find the referent one and to name equivalent fractions. For example, below the crimson rod is named as two fifths. Which rod is the one (whole)? If the crimson rod is two fifths, then the red rod is one fifth. Five fifths (red rods)form the whole. Therefore, the orange rod is one.
What other names does two fifths have? If the red rods were split in half they would be the length of white rods, and be called tenths since ten of them would form one. The crimson rod is equal to four white rods which is a way to show that 2/5 = 4/10. If the red rods were split into three equal parts the new rods would be called fifteenths since 15 of them would form one. The crimson rod would be equal to six of these rods which is a way to show 2/5 = 6/15. The process of splitting the unit fraction, fifths in this case, into equal smaller unit fractions, produces an infinite number of fractions for the same quantity.
The learning opportunities in this unit can be differentiated by providing or removing support to students, by varying the task requirements. Ways to support students include:
Tasks can be varied in many ways including:
The contexts for this unit can be adapted to suit the interests and cultural backgrounds of your students. Cuisenaire rods (rakau) are often used in the introduction of te reo Māori, meaning they may be familiar to some students. Knowing the relationships between rods of different colours, without having assigned number names to the rods, is very helpful in easing cognitive load. Other contexts involving fractions of lengths might also be engaging for your students. For example, the fraction of a race or journey that has been covered at different points is practically useful. This could be linked to the early journeys of Māori and Pasifika navigators to Aotearoa, or to current journeys your students have experienced (e.g. a bus ride to camp, running a lap of the playground). Consuming foods that are linear, such as submarine sandwiches, bananas, or sausages, might motivate some learners. Board games that have a particular number of steps from start to finish provide opportunities to look at a fraction as an operator.
Te reo Māori vocabulary terms such as hautau (fraction), hautau waetahi (unit fraction), hautau waetahi-kore (non-unit fraction), rākau Ātaarangi (Cuisenaire rods), hautau ōrite (equivalent fractions), rārangi tau (number line), and the names for individual fractions could be introduced in this unit and used throughout other mathematical learning.
Prior Experience
Students may have mixed experiences with using Cuisenaire rods. When introducing the Cuisenaire rods, ask students to think about what they could be used to represent in mathematics. Value the contributions of all students.
Session One
Relative to the orange rod, how long is the yellow rod? How do you know? Justify
The relationship between the yellow and orange rods can be expressed in two ways:
“The yellow rod is one half of the orange rod.”
“The orange rod is two times the length of the yellow rod.”
If the orange rod was one, then the yellow rod would represent one half.
What fraction would the red rod and dark green rod represent? Justify.
“The red rod is one fifth of the orange rod because five of it fit into the whole (one)”
“The orange rod is five times longer than the red rod.”
“So the dark green rod must be three fifths of the orange rod because three red rods make one dark green rod.”
A more complex question is “How many dark green rods (three-fifths) fit into the orange rod (one)?” While the correct answer is five-thirds, or one and two thirds, students will be unlikely to name the relationship that precisely. Expect answers like “Almost two but not quite.”
Session Two
If the blue rod is one what do we call the light green and white rods? Justify your answers.
What statements can you make about the relative size of the rods?
Are there equivalent fractions in the picture (1/3 = 3/9)? So what fraction is equivalent to… two thirds? (2/3 = 6/9), … to three thirds? (3/3 = 9/9).
Students might notice some patterns in the symbols such as the same multiplier between numerators and denominators in the equalities.
Thinking that fractions are restricted to less than one is a common constraint students learn. Therefore, opportunities to name fractions greater than one (i.e. mixed or improper fractions) is important. This thinking could be supported by making links to different ‘whole’ items that are different sizes (e.g. two different waka). Linking this learning to contexts that are relevant to your students will increase the level of meaning they can see within this unit. Just like the Cuisenaire rods, they are different sizes, but can still be classified as ‘one whole’. Students might recognise that the white rod fills the gap between the blue and orange rods.
Useful questions are:
How much more three quarters is than two thirds?
How much less one half is than two thirds?
Session Three
In this session the purpose is to reconstruct the one rod. Students connect from part to whole as opposed to whole to part.
The students might use the white rod as a reference to say, “The yellow rod is five sevenths of the black rod.” It is more difficult to recognise that “The black rod is seven fifths of the yellow rod.” The key idea is to establish the referent one. If a comparison ‘of a given rod’ is being made then that rod becomes the one.
If you were told that the black rod was seven fifths of the one rod, what colour would the one rod be? (yellow)
Students might easily recognise that two halves make one so the rod colour of one is brown. This is an easy scenario as a unit fraction is given. Therefore, ask a harder problem like this:
If you were told that the dark green rod was two thirds of the one rod, what colour would the one rod be?
The dark green rod does not fit exactly into the mystery one but half of it does. That half of the green rod is the light green rod (one third). So the one rod must be blue.
Session Four
The aim of this session is to develop students’ mental number line for fractions. Inclusion of fractions with whole numbers on the number line requires some significant adjustments. Activities using a number line could be completed digitally (e.g. on a PowerPoint or flipchart), or with the use of a whiteboard or paper chart. These adjustments include:
If the brown rod is one (mark zero and one on the number line) where would one quarter be?
Students may now know that the red rod is one quarter of the brown rod. Ask: What fractions could be marked on the number line using one quarter? Look for them to explain that quarters can be ‘iterated’ (place end on end) to form non-unit fractions. Make sure you push the iteration past one and include the fraction and mixed number ways to represent the amount (see below). Also encourage renaming in equivalent form where this is sensible, for example, 2/4 = 1/2, 4/4 = 1.
Dear family and whānau,
This week students will be learning about fractions, like three quarters and two thirds. We will be using some materials called Cuisenaire rods which are lengths of plastic or wood. They look like this:
Your child should be able to name fractions of a given rod. For example, they might say that the light green rod is three fifths of the yellow rod.
There is an online tool that lets you play with Cuisenaire rods on this page:
https://mathsbot.com/manipulatives/rods
Data cards: Level 3
This unit provides a way of looking at multivariate data (i.e. data that includes many variable, such as gender, age, height, eye colour, bedtime, etc.) that comes from a group of individuals. Data cards hold several pieces of information about individuals, and by sorting and organising a set of data cards, things can be found out about the group. This unit uses secondary data (data collected by others) as well as primary data (data collected by the class).
The key idea of statistical investigations at level 3 is telling the class story with supporting evidence. Students are building on the ideas from level two and their understanding of different aspects of the PPDAC (Problem, Plan, Data, Analysis, Conclusion) cycle – see Planning a statistical investigation – level 3 for a full description of all the phases of the PPDAC cycle. Key transitions at this level include posing summary investigative questions and collecting and displaying multivariate and simple time series data.
Summary or time series investigative questions will be posed and explored. Summary investigative questions need to be about the group of interest and have an aggregate focus, meaning the questions can be used to, find out about the whole group. For example, What position in the family are the students in our class? What are the reaction times of students in our class?
Data displays build on the frequency plots from level two and can be formalised into dot plots and bar graphs. Students should have opportunities to work with multivariate data sets, data cards are a good way to do this. Data cards allow students to flexibly sort their data and to correct errors or make adjustments quickly.
Students will be making summary statements, for example, the most common reaction score for our class is 13 cm, five people have a reaction score of 12 cm (read the data), or most students (16 students out of the 27 in our class) have a reaction score between 13 and 14 cm (read between the data). Teachers should be encouraging students to read beyond the data by asking questions such as: “If a new student joined our class, what reaction score do you think they would have?”
The learning opportunities in this unit can be differentiated by providing or removing support to students and by varying the task requirements. Ways to support students include:
The context for this unit can be adapted to suit the interests and experiences of your students. Preparing data cards with other information on them (sourced from Census At School New Zealand) that will be of interest to your students is one way to do this. Students will be interested in questions they can ask their classmates that are of significance to them, such as “How fluent are you at speaking te reo?”, “What is your marae, maunga, iwi, etc.?”, “Should fireworks only be seen in public displays?”, or “Does your whānau grow their own vegetables at home?” Māori can also be used alongside English on the data cards to develop students’ use of te reo Māori. Consider how you can use the data discussed, and found, throughout these lessons to inform learning in other curriculum areas (e.g. persuasive writing).
Te reo Māori vocabulary terms such as tirohanga tauanga (statistical survey), kāri raraunga (data card), taurangi (variable) and kohikohi raraunga (data collection) could be introduced in this unit and used throughout other mathematical learning.
Session One
Part One – Introducing Data Set One
Part Two – Making Class Data Cards
Part Three – Working with data set one
Session Two
During this session, students will be sorting and arranging data cards about themselves, i.e., the students’ own data cards.
Session Three
Ask students to anticipate what the data may show. Examples might be:
Data Set Three – Optional
A third data set has been included for teachers wishing to repeat the activity in this session. The data for this set was obtained from www.censusatschool.org.nz/.
Data Set Three is a data set of 24 students. The data is: top – male/female, left – arm span in cm, right – height in cm, bottom – age in years.
Session Four
Today the students, in small groups, will design and compile their own data card set. Each small group of students will design three survey questions to ask the students in the class.
Specific instructions will be needed with survey questions like this, so it is clear where to start and finish measuring.
A list of possible favourites to select from is best with survey questions like this.
When organising the data from survey questions like this, categories may be needed, e.g. before 8 pm, 8 to 9 pm, 9 to 10 pm, and later than 10 pm.
Session Five
If a further session is required, the ideas from session 4 can be repeated, or students can make up their own set of data cards by selecting a small sample of students from Census At School. To do this they would need to go to the random sampler and agree to the terms. Then select SPECIFIC variables and select four variables for their data cards. The first three sections are pretty good to choose from. Then enter sample size – 30 should be enough. Generate a sample, then an option to download the sample comes up – select this. Save their sample and then open the spreadsheet and use the information to make their own data cards.
Dear parents and whānau,
This week in maths we are gathering and investigating data about the students in our class.
You might like to ask your child to explain how data cards work. Maybe you could each make a data card like the ones we have been making at school. Discuss what things are the same and what is different about people in your whānau.
Matchstick Patterns
The unit investigates patterns made using matches and tiles. The relation between the number of the term of a pattern and the number of matches that that term has, is explored with a view to finding a general rule that can be expressed in several ways.
These Learning Outcomes are covered in every lesson of the unit.
This unit develops the concept of a relation by using matches to demonstrate how patterns grow. A relation is a connection between the value of one variable (changeable quantity) and another. In the case of matchstick patterns, the first variable is the term, that is the step number of the figure, e.g. Term 5 is the fifth figure in the growing pattern. The second variable is the number of matches needed to create the figure.
Relations can be represented in many ways. In this context, the purpose of representations is to enable prediction of further terms, and the corresponding value of the other variable, in a growing pattern. For example, representations might be used to find the number of matches needed to build the tenth term in the pattern. Important representations include:
Further detail about the development of representations for growth patterns can be found on pages 34-38 of Book 9: Teaching Number through Measurement, Geometry, Algebra and Statistics.
Links to Numeracy
This unit provides an opportunity to focus on the strategies students use to solve number problems. The matchstick patterns are all based on linear relations. This means that the increase in number of matches needed for the ‘next’ term is a constant number added to the previous term.
Encourage students to think about linear patterns by focusing on the different strategies that can be used to calculate successive numbers in the pattern. For example, the pattern for the triangle path made from 9 matches can be seen as in a variety of ways:
3 + 2 + 2 + 2
1 + 2 + 2 + 2 + 2
3 + 3 X 2
1 + 4 X 2
Questions to develop strategic thinking:
Strategies for representation and prediction will support students to engage in the more traditional forms of algebra at higher levels.
The learning opportunities in this unit can be differentiated by providing or removing support to students and by varying the task requirements. Ways to support students include:
Tasks can be varied in many ways including:
The context for this unit can be adapted to suit the interests and cultural backgrounds of your students. Matches are a cheap and accessible resource but may not be of interest to your students. They might be more interested in other thin objects such as leaves or lines on tapa (kapa) cloth. You might find growth patterns in friezes on buildings in the community. Look for opportunities to connect learning with the everyday experiences of your students.
Te reo Māori vocabulary terms such as taurangi (algebra), pūtaketake (the base element of a pattern), and ture (formula, rule) could be introduced in this unit and used throughout other mathematical learning.
Note: All of the patterns used in this unit are available in PowerPoint 1 to allow easy sharing with Smart TV or similar.
Session 1: Triangle Paths
In this session we look at a simple pattern created by putting matches together to form a connected path of triangles.
How many extra matches would be needed to make a 6-triangle path? A 7-triangle path?
How many matches would Kiri need to make a 20-triangle path?
How does Kiri’s method work?.
How would Kiri rearrange a 7-triangle path?
What expression would she write to show her calculation? (1 + 7 x 2 or 1 + 2 + 2 + 2 + 2 + 2 + 2 + 2)
Using Kiri’s Rule, how many matches will be needed to make a 20-triangle path?
Reverse the problem by asking: How big a path can Kiri make with 201 matches?
What is Jamie’s Rule?
What is Jamie’s picture for a 12-triangle path?
What expression could Jamie write for the 12-triangle path (Term 12)
How are 3 + 2 + 2 + …+ 2 and 3 + 11 x 2 the same?
How many matches will be needed to make a 20-triangle path?
How big a path can Jamie make with 201 matches?
Extension idea:
Vey-un has another way to work out the number of matches for a 10-triangle pattern. He writes 10 x 3 – 9 and gets the same number of matches as Kiri and Jamie, 21.
Ask students to explain how Vey-un’s strategy works. What do the numbers in his calculation refer to?
[Vey-un imagines ten complete triangles that require 10 x 3 = 30 matches to build. He imagines that the ten triangles join and that creates nine overlaps. He subtracts nine from 30 to allow for the overlapping matches.]
At this stage, it may be appropriate to revisit or introduce the concept of “BEDMAS”. The acronym BEDMAS signifies the order in which operations should be carried out in an equation: brackets, exponents, division and multiplication in the order that they occur, and then addition and subtraction in the order that they occur. Ask your students to solve 10 X 3 – 9 by doing the multiplication first, which is the correct way (i.e. 30 – 9 = 21), and then by doing the subtraction first (i.e. 10 X -6 = -60). If negative numbers are beyond the knowledge of your students at the time of teaching, then you should adjust the numbers in the equations you provide. The key teaching point is that BEDMAS is used to guide us when solving problems with more than one sign. This is important because the order that we carry out number operations can change the outcome of a problem.
Session 2: Square Paths
Here we look at a simple pattern created by putting matches together to form a connected path of squares.
What would Kiri, Jamie and Vey-un do for this square pattern?
Do you need to draw every square?
Is there only one possible way to look at the pattern?
What might some of the other ways look like?
What is a more efficient way to draw or calculate the total number of matches?
Kiri [1 + 20 x 3] Jamie [4 + 19 x 3 Vey-un [20 x 4 – 19]
Kiri [1 + 3n] Jamie [4 + 3 (n-1] Vey-un [4n – (n-1)]
How many squares are in a square path with 31, 304 and 457 matches?
How many matches will be left over if you make the biggest square path that you can with 38, 100 and 1000 matches?
Kiri calculates “One plus three times the term number” to find the number of matches.
If Kiri knows the number of matches, how should she undo her rule to find the term number? [Note that the order of undoing is important, subtract one then divide by three.]
Session 3: House Paths
The ideas learnt in the last two sessions are reinforced here using ‘house paths’.
A new matchstick path is being designed. It is called a house path. The first three terms are shown below. Develop a counting rule, that is, a short-cut way of counting the number of matches needed to make a 1000-house path.
Do you need to draw every house?
Do you need to add on 999 times?
What do you think Kiri, Jamie and Vey-un might do with this pattern?
Session 4: What’s My Path?
Next, the ideas of the first three sessions are extended and reinforced in another context. This time the problem gives a rule and the students find the pattern.
My friend made a picture of a pattern found in the local community that showed how her fifth matchstick path was made. She named it:
5 lots of 4 and add 2 (this was the counting rule used to make the path)
She sent it to me via email. However, I was only able to read the name of the path and not see the picture!
Make some possible pictures that she could have sent.
We have many different pictures that match the word rule. How are they different and how are they the same?
[The common property is that the pattern starts with two matches and build on using four matches for each additional shape]
Can you draw a pattern that matches this rule?
“n minus one then multiplied by five then add six”
What might the pattern look like?
One possible answer is:
Session 5: Other Ways of Seeing Things
In this session, the concept of a relation is explored with a more complicated spatial pattern.
Find many different ways to work out the total number of matches in Term 10.
Why is the number of matches increasing by 12 each term?
How many groups of 12 matches will be in the 10th term?
Why does Kiri subtract 4 at the end?
Here is a pattern of growing stars made with matches.
How many matches are needed to make Term 15, that has 15 stars?
Can you write a rule for the number of matches needed to make Term n, any term?
If you have 244 matches, what is biggest number of stars you can make in this pattern?
Dear parents and whānau,
This week in maths we have been looking at patterns made with matches. We looked at the first term, the second term, … the tenth term, … and so on and tried to find a relation between the number of matches and the number of the term. For example, we explored this pattern with matches:
Ask your students to explain how they could predict the numbers of matches in a ten-house path. What else can they share with you about the pattern?
Enjoy your exploration of this algebra problem!
Figure it Out Links
Some links from the Figure It Out series which you may find useful are:
Symbols and sets
This unit builds upon the students’ experiences of making, naming and recognising common fractions using different physical representations. Its purpose is to develop understanding of fractions of sets, and the formal language and symbols associated with simple fractions and their representations.
Fractions arise from the need to divide. Division involves equal sharing or measuring. Many equal sharing situations can be solved without needing fractions. For example, 1/3 of 15 or 15 ÷ 3 can be accomplished by putting five objects in each of the three shares. However, other equal divisions of sets and objects require partitioning ones, e.g. 1/3 of 16 or 1/3 of a pie. Measurements in which the units do not fit into a space a whole number of times demand the use of fractions of that unit. For example, if a length of 13 cubes is measured with a unit of 4 cubes, 13 ÷ 4 = 3 ¼ units fit.
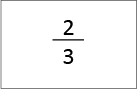
In this unit, students learn about fractions as numbers and as operators. Fractions are symbols in two parts, the numerator and denominator. In the fraction 3/4, three is the numerator and 4 is the denominator. The numerator, 3, is the number of parts being counted, and the denominator, 4, gives the size of those parts. Quarters are of a size that four of them make one (whole). When fractions operate on other quantities the meaning for numerator and denominator is consistent. For example, finding 3/4 of 20 involves finding 1/4 of 20 first, by dividing 20 objects into four equal parts. Three of those parts are counted, so 3/4 of 20 = 15. Note that the symbol for ‘of’ is x so the operation might be written as 3/4 x 20 = 15.
The learning opportunities in this unit can be differentiated by providing or removing support to students and by varying the task requirements. Ways to support students include:
The contexts for this unit can be adapted to suit the interests and cultural backgrounds of your students. Capitalise on the interests of your students. Food is appealing to most students but it is important that it is used as a ‘story shell’ not as a piece of equipment. Selection of equal teams for sports, and other activities, is a useful context for fractions of sets. Pastimes that currently engage your students, such as collectables, favourite toys, and earning money from jobs, will offer opportunities to engage them. Art and design often provide situations where shapes need to be equally partitioned.
Te reo Māori vocabulary terms such as tūtahi (whole), hautau (fraction), hautau waetahi (unit fraction), taurunga (numerator), and tauraro (denominator) could be introduced in this unit and used throughout other mathematical learning.
Session 1
The purpose of this session is to learn how to make and represent equal parts and to read and write words and symbols for fractions. The formal language of ‘unit fraction’ and ‘proper fraction’ is also introduced.
Activity 1
Is there a way to look at unit fractions like these and know which fraction is larger?
Do students recognise that a smaller denominator means the whole is cut into less parts so the parts are larger?
Activity 2
Highlight the fact that each of the symbols is known as a unit fraction because it has 1 as the top number and it tells that there is just 1 of the equal parts being referred to (highlight the fact that one quarter and one fourth are different names for the same part).
Activity 3
Can a triangle be folded into quarters when each part must be equal?
Your job now is to reconstruct what the whole looked like for each piece you have.
What information do you have to help you?
Let students work out the appearance of the original whole for each fraction piece they have. Be aware that there are multiple possible answers depending on how the pieces are arranged. It is an excellent challenge to create as many different wholes as possible for a given fraction piece.
Activity 4
Why are these pieces called tenths? (ten equal parts make one whole)
Where have you encountered tenths? (Students may connect to money and decimals in general)
What comes next?
How might we write eleven tenths? (11/10 or 1 1/10)
If 11/10 is an improper fraction I wonder what that means? (numerator is greater than denominator)
Also point out that often we see the flat line separating these numbers (this line is called the vinculum) shown with a horizontal or sloping line like this, 1/2, 1/4.
What parts would we get if we folded tenths in half?...in quarters? …in tenths? The last fold produces hundredths.
Activity 5
Conclude this session by writing the words and symbols for common unit fractions and some other proper fractions. Brainstorm on the class chart/book what has been learned about fraction symbols. Explicit links can be made here to Kupu Māori.
Session 2
The purpose of this session is to introduce the language of numerator and denominator and practise using and interpreting fraction symbols. Students work from whole to part and part to whole. An understanding of different ways of showing one whole is also developed.
Activity 1
Write 'numerator' in the dictionary. Explain that it is the top number in a fraction. Have several students come up and write their favourite fraction and circle in a different colour the top number.
Ask student pairs to discuss what the job of the top number is and to suggest a definition of 'numerator'. Numerator means the counter so that number represents the number of parts that are chosen.
Write 'denominator'. Read the word together, and discuss the meaning. It is important that students know that denominator represents the size of parts, how many of those parts make one.
Have several students again write their favourite fractions, this time writing over the denominator number in a different colour (not the same as that used for the numerator).
Activity 2
Pose and write on a chart the question:
Can the numerator in a fraction be the same as the denominator?
Who can make fractions where the numerator and denominator are equal?
Explain why any fraction where the numerator and denominator are equal is another name for one.
Can the numerator be greater than the denominator?
What is true of all fractions where the numerator is greater than the denominator? (All improper fractions are greater than one [whole]).
Activity 3
Have students play Roll for 3 in pairs.
(Purpose: To make one from equal parts and recognise the equivalent fraction notation) Students each need a Fraction Pieces page. The game is played in pairs or threes.
The important rule is that they can colour fewer parts and keep building to make one whole, but they must, at some point, roll the exact number needed to complete a whole.
For example, Player One rolls 6. She colours 6/8 of her circle divided into eighths. On her next turn she rolls 3. She cannot use this to complete her eighths circle because 6/8 + 3/8 is more than 8/8 (1 complete circle). She must roll 2 or two 1s in different rolls to compete 1 exactly. She can however work on her tenths circle and take 3/10 and add this to her 1/10.
Activity 4
Introduce the game Fraction Snap. (Copymaster 3).
For example:
Session 3
The purpose of this session is to use materials to develop an understanding of fractions of sets. Equal sharing of sets is linked to regions models of fractions. Children make connections with equal sharing experiences in their own lives.
Connections between repeated addition and multiplication are made as part-to-whole fraction problems are explored.
Activity 1
Distribute a shape from Copymaster 4 to each student.
This activity requires students to work from part to whole rather than the usual whole to part requirement.
For example if this is 1/4:
the whole shape might look like any of these:
Have students find multiple solutions with the other shapes, writing the fraction in each part and the one whole fraction (4/4, 8/8 etc.) beside the whole shapes.
Activity 2
Have the students each take up to 4 beans and place them on their coloured fraction piece.
If this is a fraction of the set, how many beans are in the whole set?
For example : 1/4 of a whole set is 3 beans, 4/4 make 1 whole, so 4 lots of 3 beans will make 1 whole set.
“3, 6, 9, 12” or “4 x 3 = 12”
Activity 3
Mia’s friend Amy gave her 1/2 of her jellybeans. Mia had 5. How many did Amy have altogether before she shared?
Tony received 6 pretzel sticks from Tama who told him he’d given him 1/3. How many did Tama have to start with?
Encourage the students to picture these fractional amounts and what the whole amount might look like. Ask students to describe what they pictured in their minds.
Session 4
The purpose of this session is to use materials to reinforce the whole to part relationship and to continue to use fractions of regions to build an understanding of fractions of sets. The key connection is made with the operation of division. One view is to see how many equal sets can be made from the starting set, and to work out the number of items in each equal set. This is called partitive division.
Activity 1
For example: You were given 6 cherries. This was one third of the total in the bag. How many were in the bag to start with?
Your whānau were given 4 kūmara. This was one sixth of the total kūmara in the hāngi.
How many were in the hāngi to start with?
Activity 2
Show and write how you work out your share, using pictures, words and symbols.
Change the number of shares and starting number of strawberries to add more challenge. For example:
1/3 of 24 1/5 of 30 1/8 of 64 1/6 of 42 1/7 of 42
Activity 3
Half of twelve
12 shared between 2
12 ÷ 2
12/2
The symbol is an expression of both the problem itself and the quotient (resulting share).
These key ideas about mathematical notation should be regularly reviewed.
Activity 4
12 strawberries shared between 3 people, 1/3 of 12 (or 12/3)
16 shared between 4, or 1/4 of 16 (or 16/4)
20 ÷ 5, or 1/5 of 20 (or 20/5)
21 ÷ 4, or 1/4 of 21 (or 21/4)
Activity 5
Pairs of students can be challenged to write their own fraction problems for their partner to solve.
Session 5
The purpose of this session is to develop a conceptual understanding of finding a non-unit fraction of a set. The language introduced in this unit is consolidated.
Activity 1
Make coloured beans or other objects to be shared, and paper available to pairs of students.
There are 25 beans in a packet. You plant 2/5 of the beans. How many beans do you plant?
Do students recognise that finding one fifth of 25 is needed first?
Do they build two ‘iterations’ (copies) to make two-fifths?
Are their strategies only equipment based or do they use numbers and operations to anticipate the result?
For example: First you have to find one fifth so you divide 25 by five. You’re asked for two fifths so you have to add two fifths together or times one fifth by two. You write this 25 ÷ 5 = 5, 5 + 5 = 10 or 2 x 5 = 10
Notice who uses equal sharing (into regions) and who uses their knowledge of multiplication (and division) to solve the problem.
For example:
There are 16 beans in a packet. You plant 3/8 of the packet. How many beans is that?
There are 18 beans in a packet. You plant 5/9 of the packet. How many beans is that?
There are 18 beans in a packet. You plant 5/6 of the packet. How many beans is that?
For example: To find 3/8 of 16:
Find 1/8 first by solving 16 ÷ 8 = 2.
Find 3/8 by solving 3 x 2 = 6.
Give the answer as 6 is 3/8 x 16 = 6.
Activity 2
Have students play Telling the Truth (Copymaster 5) in pairs.
(Purpose: to identify the correct fractions of sets)
Activity 3
Conclude this session with a discussion of the game and summary of learning.
Session 6
Remind students of their learning from Activity 1 of Session 5 about finding a non-unit fraction of a set. The difference in this session is that there is no longer a predetermined number in each set.
It will be helpful to model solving a challenge with the group/class first. As students will need to find a number of cubes/tiles that can be equally split into each fraction in the challenge, a way to support students with this is to explain the following:
For the challenge ‘Build a design that is 1/3 blue and 1/4 yellow’, the number of cubes/tiles in the set has to be able to be split equally into thirds and into quarters. The simplest way to do this is to find a common multiple of the denominators involved, which in this case is 12.
Note: 12 is not the only number of cubes/tiles that could work for this challenge. In fact, any common multiple of 3 and 4 will work for this challenge.
Fraction Mosaics
You will need a bunch of cubes or square tiles in at least four colours (red, yellow, green, blue), or small square pieces of paper. The task is to build a mosaic design that matches the description in your challenge. Collaborating in pairs (mahi tahi), build your mosaic design and be ready to have a korero about it with the rest of the group/class. These mosaic designs could be combined to create a large siapo or tukutuku design, or a design for a new school garden. Links could be made with designs you have recently seen in your community (e.g. at the marae). Lay a transparent grid over an image of relevant art, and as a class come up with a list of fraction statements that describe the use of colour (e.g. 3/4 of this art uses the colour blue). This could be framed within the context of looking at how early Māori people used pigments derived from natural materials (e.g. clay deposits, iron oxide) to create paint.
Challenge list:
Students could create their own challenges for another pair to solve. What is the same and what is different about the way you solved it and the way another pair solved it?
Questions you could use for group korero:
Dear parents and whānau,
In maths we have been learning to find fractions of sets.
Your child has brought home a game that we have been playing in class. Please return it tomorrow. You might like to write a comment about it and place the comment in the game bag. We hope you enjoy playing the game.
Here are the rules:
Telling the Truth.
(Purpose: to identify the correct fractions of sets)
The aim of the game is to be the player to collect the most pairs of questions with correct answers.
Five cards are dealt to each player who must firstly decide which of the cards in their hand do not tell the truth. They discard these cards, turning them upside down and placing them to one side. (They may need to be checked later in the game.) They then find any matching pairs in their hand and place these face up in front of them.
The players then take turns to ask for an answer card to any of the question cards in their hand, or to ask for a question card that matches an answer card in their hand. Upon Player One’s request for a card, if Player Two gives an untrue card, Player Two must miss a turn. Player One may immediately make another request.
If Player Two has no suitable cards he or she tells Player One to pick up from the pile. Each time a player picks up or receives a card they must check it for accuracy.
The player with the most correct matching pairs when all the cards are used, is the winner.