Specific Teaching Points
Session one involves subtracting single digit and two digit numbers starting at 200. As students take handfuls or counters from their "waka" they should anticipate how many counters remain. Students should use place value to calculate, as opposed to counting back. The use of a linear model for representing the calculations is recommended. A bead string is ideal and can be mounted along the edge of a whiteboard. Jumps can then be recorded on the whiteboard.
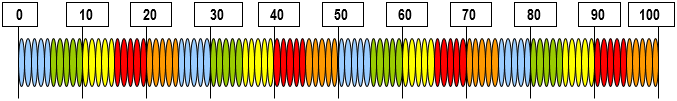
The session notes recommend linking two strings end on end to form a line of 200 beads. An important strategy in this activity is ‘back through ten’. For example, a student has 93 counters left and removes a handful of 17 counters. How many do they have left?
On the bead string, this calculation can be modelled like this:
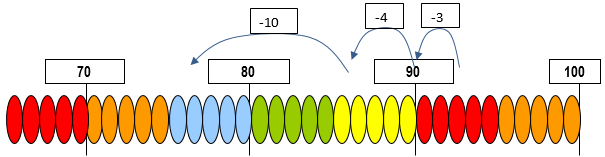
In this diagram, 93 – 7 is calculated in two steps. First, the seven in 17 is imaged as 10 and 7. Three is subtracted from 93 to get to 90 and then four is taken away to get 86. Thus, the seven from 17 has been subtracted, leaving only the 10 to be taken away next. This is a ‘back through ten’ strategy, meaning it uses a decade number (i.e. 90) as a benchmark. Alternatively, a student might take away the ten in 17 first, and then the 7.
Session three involves dealing with "like" measures, e.g. dividing or multiplying weights. Measuring objects with devices like kitchen scales is important to the development of students’ understanding of the measurement system. For example, students will need to find out how many kilograms of kūmara need to be ordered for the hāngī. If possible, bring a few kūmara along so students can experiment and find out how many kūmara make up one kilogram in weight. They will then need to use division or multiplication to calculate how many kūmara they need in total for the hāngi. If 24 kūmara are needed and four kūmara weigh one kilogram then 26 (24 ÷ 4) kilograms of kūmara will need to be purchased.
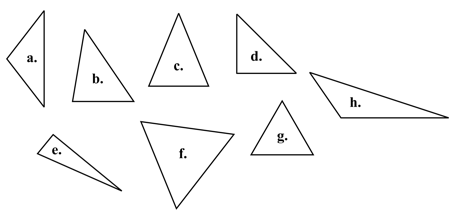
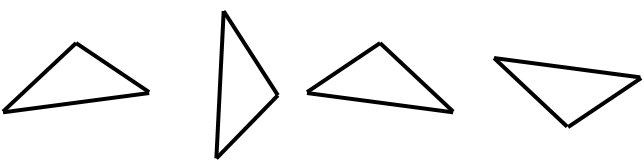
Session four develops important geometry ideas out of whai (string figures). A common issue with the learning of geometry is that students form prototypical views of shapes. For example, they might consider an equilateral triangle to be the only shape that is a triangle. All of the shapes below are triangles:
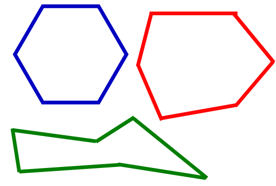
The issue of prototypical ideas will also apply to other polygons such as hexagons and octagons.
These three shapes are all hexagons. Note that the bottom hexagon is concave as it has two internal angles greater than 180°. It is important to discuss the defining characteristics of a class of shapes like hexagons. The only required property is that the shape is closed by six sides.
Session five also involves an important mathematical idea, distinctness. Rotating or reflecting a shape does not change its properties, except orientation (direction it is facing). The idea is fundamental to determining if given shapes are similar or different. For example, all of the shapes below are similar even though they look different. They can all be mapped onto each other using translation (shifting), reflection (flipping), and rotation (turning).
Similarity is applied in Session Five by looking for different winning positions. If the positions are reflections or rotations of one another then they are not considered to be distinct.

Popcorn
This unit includes a number of popcorn investigations, which provide both a purposeful and enjoyable measuring context. The focus of the unit is introducing the students to the need for a standard unit for measuring volume.
When students can measure effectively using non-standard units, they are ready to move to the use of standard units. The motivation for moving to this stage often follows from experiences where the students have used different non-standard units for the same volume. This allows them to appreciate that consistency in the units used allows for easier and more accurate communication.
The usual sequence used in primary school is to introduce the litre as a measurement of volume before using cubic centimetres and cubic metres.
Students’ measurement experiences must enable them to:
The standard units can be made meaningful by looking at the volumes of everyday objects. For example, the litre milk carton, the 2-litre ice-cream container and the 100-millilitre yoghurt pottle. Students should be able to use measuring jugs and to say what the measuring intervals on the scale represent.
This unit can be differentiated by varying the scaffolding provided or altering the difficulty of the tasks to make the learning opportunities accessible to a range of learners. For example:
Including the process of making popcorn in a broader context within the class or school will encourage engagement and ensure the usage of food is meaningful. For example, the popcorn could be used as part of a shared lunch for the class, a popcorn stall fund-raiser as part of a school fair or gala, or shared at a community event.
Te reo Māori vocabulary terms such as, ine (measure), rita (litre), ritamano (millilitre), haurua (half) and hauwhā (quarter) could be introduced in this unit and used throughout other mathematical learning. Another term that may be useful in this unit is kānga pāhu (popcorn).
Session 1-2
In these sessions we investigate the volume of corn kernels before and after popping. The amount of popcorn to be made is based on the batch size using a popcorn maker, which is usually about 1/2 a cup of kernels. We use non-standard units to measure the volume of both kernels and popped corn. We think about why the measurements vary (because the units being used vary) and what could be done to improve the consistency of the measurements (use a standard unit).
Ask: Why are we coming up with different numbers of spoonfuls needed to fill the container?
Record students’ responses, encouraging them to compare the sizes of spoons.
Session 3
In this investigation the students revisit the results from the previous investigation, and the idea of measuring the popcorn using a litre measure is explored.
Session 4
In this investigation the students think about a standard serving size for the popcorn. The students will find out how many litres of popcorn will be needed for everyone in the class to get one serving.
Session 5
On the final day of the unit the students make cones to fit one serving of popcorn into. The batches of popcorn will be made and the students will be able to measure out their serving to eat.
What volume of corn kernels have been used?
How many batches of popcorn have been made?
How many servings were made?
How many litres of popcorn have been made?
How much is left over?
If you were making some popcorn for your whānau how many batches would you need to make?
Family and whānau,
This week we have been investigating the volume of popcorn. Do you know how many litres of popcorn half a cup of corn makes when it is popped?
We designed containers at school to hold our popcorn. Ask your child to tell you about the one that they made. Together you could design another shaped container to hold the popcorn and make some at home.
Multiplication stories
In this unit students explore the different situation types to which multiplication can be applied. Particularly, they engage with rate, comparison and array problems.
The basic concept of multiplication is an important one because of its practicality (how much do 4 ice creams cost at $2 each?) and efficiency (it is quicker to determine 4 x 2 than to calculate 2 + 2 + 2 + 2). Multiplication is used in many different situations. In this unit, students think about multiplication as a short way to find the result of repeated addition of equal sets. They do so by solving rate problems, comparison problems and array problems.
A rate problem involves a statement of "so many of one quantity for so many of another quantity". All multiplication situations contain some form of rate but at this level, the problems are usually about equal sets or measurement. For example:
“Lena buys six bags of biscuits. Each bag contains four biscuits. How many biscuits does she buy altogether?”
This is an equal sets problem that contains the rate "four biscuits for every bag". A measurement rate problem is usually something like this:
“Hone’s kumara plant grows five centimetres each week after it sprouts. How long will his plant be after six weeks?”
The rate in Hone’s problem is “five centimetres for every week". Comparison problems involve the relationship between two quantities, for example:
“Min’s apartment block has three floors. Anshul’s block has 12 floors. How much taller is Anshul’s block than Min’s?”
An additive answer is 12 – 3 = 9 floors. A multiplicative answer is 4 x 3 =12 so Anshul’s block is four times higher than Min’s. An array is a structure of rows and columns. For example, this chocolate block has two rows of five pieces (2 x 5 or 5 x 2).
Array problems can help students to see the commutative property of multiplication, for example, that 5 x 2 = 2 x 5. In other words, the order of the factors does not affect the product (answer) in multiplication.
As well as thinking about multiplication in a variety of situations, students are encouraged to use a variety of materials to solve the problems. Using a variety of materials can help students see the multiplicative structure that is common to a variety of problems and assist them to transfer their understanding to situations which are new to them.
This unit can be differentiated by varying the scaffolding provided to make the learning opportunities accessible to a range of learners. For example:
The contexts for this unit can be adapted to suit the interests and experiences of your students. Focus on familiar contexts which include multiplicative situations to appeal to students’ interests and experiences and encourage engagement. Examples may include:
Getting Started
Introduce the session by asking the students to work through several equal group (set) problems first and then ask them to pose their own problems. For example:
When writing these problems, consider what times tables your students are confident in applying to word problems. Also consider how students might benefit from working in pairs (tuakana-teina).
The students can represent these and similar ‘equal sets’ problems with:
Note: It is important to link the examples (where possible) to the structure of repeated addition of equivalent sets as multiplication. For example: 4 + 4 + 4 + 4 + 4 + 4 + 4 = 28 or 7 x 4 = 28. Discuss what the numbers 4, 7, and 28 refer to and what the operations symbols + and x refer to. The multiplication symbols can be thought of as meaning ‘of’. For example, 7 x 4 = 20 means seven sets of four.
Use several sets of ice-cream containers (all with the same number of items in them) with the contents of each covered except for one. Ask the students to write story problems for each example.
Be aware that students’ choice of strategy depends on the connection between the conditions of each problem and the number resources that they have available. Expect that the strategies used by individual students will vary.
Exploring
Over the next three days the students are exposed to a variety of different types of story problems. They are encouraged to model the problems using different equipment and explain their answers to others. They think about the most efficient ways of solving the problems. It is important that students are provided with opportunities to build up multiplication facts to 10 and then to 20. Some students may solve these problems without equipment, using the number knowledge they have available.
Rate problems
[Name] can write their name in 10 seconds. How long does it take to write their name four times?
You might select a student to role play writing their name and use an analogue clock (less battery) and/or stacks of cubes to track the time in seconds
[Name] drinks four cups of water each day. How many cups does he/she drink in one week?
Use plastic cups to build up the equal sets of four cups that are involved in this problem. Use another material to track the number of days.
[Name] puts five pieces of harakeke into every bundle. How many pieces of harakeke does he/she need for eight bundles?
[Name] puts three spoons of Milo in each cup. How many spoons of Milo does he/she need for 10 cups?
These problems are more accessible than the time related tasks. Shirts can be cut out of paper and buttons represented by counters. Cups and plastic spoons can be used to model the Milo problem. Both quantities in each rate are tangible.
The students can create similar types of problems with pictures and pose the problems to each other. Encourage them to explain their strategies to each other.
Discuss what is the same about all the problems you have just worked on.
Do students express the idea of a rate as being a “for every” relationship?
Now ask the students to make up similar word problems and to pose their problems to each other. Encourage them to explain their answers to each other.
Multiplicative comparison
How much taller is Jill’s apartment block than Jack’s apartment block?
S: Jill’s apartment block has 12 floors and Jack’s has four floors. Jill’s block is eight floors higher.
Students may not offer a ‘times as many’ multiplicative answer. If that occurs pose this problem:
Jill says that her apartment block is three times higher than Jack’s block. I wonder what she means?
Look for students to note the inverse relationships:
S: Jack’s apartment block is eight floors less (shorter) than Jill’s.
S: Jack’s apartment block is one third of the height of Jill’s.
Do your students:
Arrays
Pose problems such as:
The students are lined up in 3 teams for sport. Each team has 6 members. How many students are there altogether?
Encourage the students to draw representations of problems like this using three rows (one for each team) and six columns (one for each team member). Alternatively, use the students as the objects in the problem. If students draw the situation as three columns of six it opens discussion of the commutative property since 6 x 3 = 3 x 6.
For the problem above this could be talked about as 3 rows of 6 pegs or 3 sixes,
or 3 rows of 6, or 3 x 6 = 18
By turning the pegboard a quarter turn, the array still has a total of 18 pegs.
This could be talked about as 6 columns of 3 pegs or 3 rows of 6 pegs or 6 threes or 6 columns of 3 or 6 X 3 + 18.
Reflecting
On the final day of the unit we play a game called 'Array Trap' in which the students use graph paper to plot arrays.
For this activity you will need:
Players take turns to:
Discuss strategies for the game such as:
Dear Family and Whānau,
At school this week we have been solving multiplication problems. Here is an example of one we have worked on:
There are 6 bags of shellfish (kaimoana). Each bag contains 4 pipi. How many pipi are there altogether?
At home this week I would like your child to make up two more multiplication problems for us to solve in maths.
Figure it Out Links
Some links from the Figure It Out series which you may find useful are:
Planning a statistical investigation (Level 2)
In this unit students will identify how to plan and carry out a statistical investigation, looking at facts about their class as a context.
It is vital when planning statistical investigations that the students understand the importance of the way that they plan, collect, record and present their information. If they are not consistent in the way they carry out any of these steps, they could alter their findings, therefore making their investigation invalid.
In this unit the students will first look at choosing investigative questions to explore, making sure that the topic lends itself to being investigated statistically. They will collect their data using structured recording methods. Once they have collected and recorded their data, they will present their findings, using appropriate displays, and make descriptive statements about their displays to answer the investigative question.
Dot plots
Dot plots are used to display the distribution of a numerical variable in which each dot represents a value of the variable. If a value occurs more than once, the dots are placed one above the other so that the height of the column of dots represents the frequency for that value. Sometimes the dot plot is drawn using crosses instead of dots.
Investigative questions
At Level 2 students should be generating broad ideas to investigate and the teacher works with the students to refine their ideas into an investigative question that can be answered with data. Investigative summary questions are about the class or other whole group. The variables are categorical or whole numbers. Investigative questions are the questions we ask of the data.
The investigative question development is led by the teacher. Through questioning of the students, the teacher identifies the variable of interest, and the group identifies what the investigative question is about. Within this, the teacher forms the investigative question but with student input.
Survey questions
Survey questions are the questions we ask to collect the data to answer the investigative question. For example, if our investigative question was “what ice cream flavours do the students in our class like?” a corresponding survey question might be “what is your favourite ice cream flavour?”
As with the investigative question, survey question development is led by the teacher, and through questioning of the students, suitable survey questions are developed.
The learning opportunities in this unit can be differentiated by providing or removing support to students and by varying the task requirements. Ways to support students include:
The context for this unit can be adapted to suit the interests and experiences of your students.
For example:
Te reo Māori vocabulary terms such as raraunga (data), tauanga (statistics), tuaka (axis), and āwhata (scale) could be introduced in this unit and used throughout other mathematical learning.
Although this unit is set out as five sessions, to cover the topic of statistical investigations in depth will likely take longer. Some of the sessions, especially sessions 4 and 5 could easily be extended as a unit in themselves. Alternatively, this unit could follow on from a unit on data presentation to give students an appreciation of practical applications of data display.
Session 1
Session 1 provides an introduction to statistical investigations. The class will work together to answer the investigative question – How many brothers and sisters do people in our class have? Be sensitive to the needs of your class - if this context is inappropriate for your students , then it may need to be altered.
Explain that statistics concerns the collection, organisation, analysis and presentation of data in a way that other people can understand what it shows.
How many brothers and sisters do people in our class have?
Students might suggest that we ask how many siblings they have, or they might suggest we ask how many brothers, how many sisters and how siblings they have altogether.
The idea of asking about brothers and sisters separately allows for a deeper exploration of the data and a more in depth answer to our investigative question.
Sticky notes could be a good way to collect this information from the students as it will allow rearrangements of the data quickly.
For example:
Pip records the following information about her brothers and sisters. She gives it to her partner. Her partner, Kaycee shares this information with another student. Kaycee says that Pip has three brothers and one sister. Altogether Pip has four siblings.
How can we use the pieces of paper (or sticky notes) to show someone else how many brothers and sisters people in the class have?
How can we show the information so that people can easily understand what it is showing?
Hopefully, someone will suggest a more organised list, or counting the number of 0s, the number of 1s etc and writing sentences to explain how many there are of each.
Session 2
This session is ultimately about choosing an appropriate topic to investigate about the class. There will be a real need for discussion about measurable data and realistic topics that can be investigated in the given time frame. It would be a good idea to provide the students with a list of topics if they get stuck, but they should be encouraged to try and come up with something original where possible.
PROBLEM: Generating ideas for statistical investigation and developing investigative questions
If groups are having trouble thinking of ideas, you could try writing a list of suggestions on the board but limiting groups to using one of your ideas only, to encourage them to think of their own. Some ideas could be:
PLAN: Planning to collect data to answer our investigative questions
Explain that these questions are called survey questions and they are the questions we ask to get the data. Work with groups to generate survey questions. For example:
Possible survey questions are:
In these examples you can see that the survey question and investigative question are very similar, but there are key differences that make it an investigative question (What are Room 30’s favourite native birds? – overall about the class data) rather than a survey question (What is your favourite native bird? – asking the individual).
Session 3
Data collection is a vital part of the investigation process. In this session students will plan for their data collection, collect their data and record their data and summarise using a tally chart or similar for analysis in the following sessions.
PLAN continued: Planning to collect data to answer our investigative questions
DATA: Collecting and organising data
Session 4
In this session the students will work on creating data displays of the data collected in the previous session.
ANALYSIS: Making and describing displays
Numerical data – displaying count data e.g. “How many…” investigative questions
Categorical data – displaying data that has categories e.g. “What…” investigative questions
Session 5
Session 5 is a finishing off session. Students should be given time to complete their graphs if they have not already, and to write statements about what the graphs show.
Dear parents and whānau,
During the next week we will be working on statistical investigations in maths. Over this time, your child will be gathering data on the class and presenting it using data displays such as dot plots and bar graphs. If you know of any graphs or tables of information suitable to discuss with your child, either in the newspaper, or in a book, or perhaps on some advertising material, this week would be a good time to do so.
Figure it Out Links
Some links from the Figure It Out series which you may find useful are:
Pede patterns
This unit is about generating number patterns for certain creatures from the mythical planet of Elsinore. Each ‘Pede’ is made up of square parts and has a number of feet. The patterns range from counting by 2s and 3s, to being the number of feet plus three.
Patterns are the basis of much mathematics. There is always a need to find a link between this variable and that variable. This unit provides an introduction to pattern in the context of mythical creatures. Ākonga are given practice in finding the next creature in a sequence. This leads to the main aim, which is for the ākonga to begin to see the link between the number of feet that certain creatures have and the number of squares that make them up.
One of the things that is deliberately attempted here is for ākonga to see the link above in both directions. Not only do ākonga get practice in linking squares to the number of feet, but they also are asked to try to find the number of feet that a creature with a certain number of squares has.
This unit provides an opportunity to develop number knowledge in the area of Number Sequence and Order, in particular development of knowledge of the forward number word sequence and skip counting patterns.
This unit can be differentiated by varying the scaffolding provided or altering the difficulty of the tasks to make the learning opportunities accessible to a range of learners. For example:
The context of this unit can be adapted to address diversity, and to appeal further to the interests and background experiences of ākonga. For example, ākonga may like to colour their pede with their favourite colours or decorate them with culturally significant patterns that you have learnt about. Picture books such as Taniwha by Robyn Kahukiwa could be used to introduce the idea of a mythical creature, and could lead to further learning about myths and legends from cultures relevant to your ākonga. If the context of mythical creatures is inappropriate for your āklonga, then the context of native animals could be used instead.
Te reo Māori vocabulary terms such as tauira (pattern) and tau (number) could be introduced in this unit and used throughout other mathematical learning.
As each pede is developed, help ākonga focus on the number patterns involved by creating tables as below. Similar tables can be drawn for each type of pede.
Use of a hundreds board may help ākonga visualise the number patterns more easily and help them to predict which numbers will be part of the patterns.
The conclusion of each session is an ideal time to focus on the number patterns involved. Questions to develop number knowledge include:
Which number comes next in the number pattern for this pede? How do you know?
Which number will be before 20 in this pattern? (or another number as appropriate)
How do you know?
What is the largest number you can think of in this pattern? How do you know?
Could a pede with 20 squares be a Spotted Pede? Why / Why not?
Could a pede with 32 squares be a 2-pede? Why / Why not?
Are there any numbers that could be Spotted Pedes and Humped Back Pedes? What are they? How did you work that out?
Session 1
Here we explore number patterns related to the mythical creatures that live on the planet Elsinore. The patterns involve skip counting by 2s.
Introduce the idea of a mythical creature with a picture book like Taniwha by Robyn Kahukiwa, or Zog by Julia Donaldson. Consider whether a local iwi member could come to talk to your class about the history of taniwha in your local area. On planet Elsinore there lives a strange collection of creatures. There is the Humped-Back Pede. The Humped Back 1-pede looks like this. Can you see their eye? And the Humped Back 2-pede looks like this. They have an eye too. (Show your ākonga the pictures below.) Ask ākonga to work individually or in pairs (tuakana/teina model) to make a Humped Back 3-pede with the green tiles, or draw a picture.
Can you work out how many squares a Humped Back 4-pede has?
Gather ākonga together to talk about the creatures that they drew. Explore the number pattern of counting in 2s that comes from the Humped-Back Pedes. Also ask questions like:
Can you tell me how many green squares a Humped Back 5-pede will have?
Can you tell me how many green squares a Humped Back 7-pede will have?
Can you tell me how many green squares a Humped Back 10-pede will have?
How many feet has a Humped-Back Pede with 12 squares?
How many feet has a Humped-Back Pede with 18 squares?
How many feet has a Humped-Back Pede with 20 squares?
Can you tell me how to get the number of squares that a Humped-Back Pede with a particular number of feet has?
Can you tell me how to get the number of feet that a Humped-Back Pede with a particular number of squares has?
Session 2
Here we investigate some more mythical creatures that live on planet Elsinore. The patterns here involve skip counting by 3s.
How many feet would a 4-pede have? What about a 5-pede?
Can you tell me how many squares a 1-pede has?
How many squares does a 2-pede have?
What about a 3-pede?
(Put the numbers of squares beside the creatures as ākonga answer the questions, or create a table)
How many feet will it have?
How many squares will it have?
Can someone make one for me with these square tiles?
Does everyone agree with that?
(Write 11 under the 4-pede.)
I wonder what sort of Pede comes next? (5-pede.)
How many squares does a 5-pede have? (14)
I wonder what sort of Pede comes next? (6-pede.)
How many squares does a 6-pede have? (17)
Is there any pattern in the number of squares that Pedes have? (Add on 3 for each extra foot. Talk about skip counting by 3s.)
Session 3
Here we explore patterns further. Where we are particularly interested in linking the number of squares on a creature and the number of feet it has.
How many red squares does a Spotted 4-pede have?
How many blue squares does a Spotted 4-pede have?
How many squares are all together? How did you work that out?
Why are there more blue squares than red squares? How many more?
How many red squares does a Spotted 5-pede have?
Can you tell me how many blue squares a Spotted 5-pede has? Draw it.
How many red squares does a Spotted 6-pede have?
How many more blue squares does a Spotted 6-pede have? Draw it.
These ākonga could also be encouraged to make a table of there mathematical thinking.
How many red squares does a Spotted 10-pede have?
How many blue squares does a Spotted 10-pede have?
What did you find out about the Spotted Pedes?
What patterns did you find?
(Try to get them to see that they have as many red squares as they have feet. This means that it is very easy to find out how many red squares they have.)
Session 4
How many yellow squares does a Big-Headed Pede 4-pede have?
How many yellow squares does a Big-Headed Pede 5-pede have?
How many yellow squares does a Big-Headed Pede 6-pede have?
Do you need to draw the creatures to work out how many squares they have? Why or why not?
Could you work out how many yellow squares a Big-Headed Pede 10-pede would have?
What did you find out about the Big-Headed Pedes?
What patterns did you find?
(Try to get them to see that they have three more yellow squares than they have feet. This means that it is very easy to find out how many yellow squares they have.)
I saw a Big-Headed Pede with 16 yellow squares. How many feet did she have?
Session 5
Discuss the Pedes, the Humped-Back Pedes, the Spotted Pedes and the Big-Headed Pedes.
How many squares does one of your 5-pedes have?
Can you tell me the number of squares an X Pede with 10 feet (or some other relatively large number) has?
If I had 15 squares, what is the Pede with the largest number of feet that I could draw?
Dear parents and whānau,
In maths this week we have been working on patterns. We have looked at some mythical creatures from the planet Elsinore. We have seen the patterns that their numbers of squares have. Here is a creature from Elsinore. Together you could explore the links between its number of legs and the number of squares that make up its body.
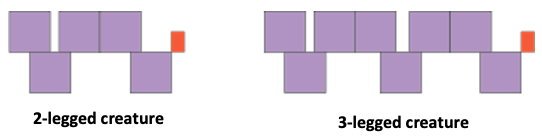
Discuss with your child how many squares does a 2-legged creature have?
How many squares does a 3-legged creature have?
How many squares does a 4-legged creature have?
How many legs does a creature with 20 squares have? Talk together about how you know? What do you have to do to work this out?
We would also like you to help us come up with a name for our creature. Write your ideas here.
We hope that you enjoyed working together on this algebra patterning task.
Matariki - Level 2
This unit consists of mathematical learning, at Level 2 of the New Zealand Curriculum, focused around celebrations of Matariki, the Māori New Year. The sessions provide meaningful contexts that highlight Māori culture and provide powerful learning opportunities that connect different strands of mathematics.
Session One
Session Two
Session Three
Session Four
Session Five
Specific Teaching Points
Session one involves subtracting single digit and two digit numbers starting at 200. As students take handfuls or counters from their "waka" they should anticipate how many counters remain. Students should use place value to calculate, as opposed to counting back. The use of a linear model for representing the calculations is recommended. A bead string is ideal and can be mounted along the edge of a whiteboard. Jumps can then be recorded on the whiteboard.
The session notes recommend linking two strings end on end to form a line of 200 beads. An important strategy in this activity is ‘back through ten’. For example, a student has 93 counters left and removes a handful of 17 counters. How many do they have left?
On the bead string, this calculation can be modelled like this:
In this diagram, 93 – 7 is calculated in two steps. First, the seven in 17 is imaged as 10 and 7. Three is subtracted from 93 to get to 90 and then four is taken away to get 86. Thus, the seven from 17 has been subtracted, leaving only the 10 to be taken away next. This is a ‘back through ten’ strategy, meaning it uses a decade number (i.e. 90) as a benchmark. Alternatively, a student might take away the ten in 17 first, and then the 7.
Session three involves dealing with "like" measures, e.g. dividing or multiplying weights. Measuring objects with devices like kitchen scales is important to the development of students’ understanding of the measurement system. For example, students will need to find out how many kilograms of kūmara need to be ordered for the hāngī. If possible, bring a few kūmara along so students can experiment and find out how many kūmara make up one kilogram in weight. They will then need to use division or multiplication to calculate how many kūmara they need in total for the hāngi. If 24 kūmara are needed and four kūmara weigh one kilogram then 26 (24 ÷ 4) kilograms of kūmara will need to be purchased.
Session four develops important geometry ideas out of whai (string figures). A common issue with the learning of geometry is that students form prototypical views of shapes. For example, they might consider an equilateral triangle to be the only shape that is a triangle. All of the shapes below are triangles:
The issue of prototypical ideas will also apply to other polygons such as hexagons and octagons.
These three shapes are all hexagons. Note that the bottom hexagon is concave as it has two internal angles greater than 180°. It is important to discuss the defining characteristics of a class of shapes like hexagons. The only required property is that the shape is closed by six sides.
Session five also involves an important mathematical idea, distinctness. Rotating or reflecting a shape does not change its properties, except orientation (direction it is facing). The idea is fundamental to determining if given shapes are similar or different. For example, all of the shapes below are similar even though they look different. They can all be mapped onto each other using translation (shifting), reflection (flipping), and rotation (turning).
Similarity is applied in Session Five by looking for different winning positions. If the positions are reflections or rotations of one another then they are not considered to be distinct.
The learning opportunities in this unit can be differentiated by providing or removing support to students, or by varying the task requirements. Ways to support students include:
Tasks can be varied in many ways including:
Although the context of Matariki should be engaging, and relevant, for the majority of your learners, it may be appropriate to frame the learning in these sessions around another significant time of year (e.g. Chinese New Year, Samoan language week). This context offers opportunities to make links between home and school. Consider asking family and community members to help with the different lessons. For example, members of your local marae may be able to share local stories and traditions of matariki with your class.
Te reo Māori language is embedded throughout this unit. Relevant mathematical vocabulary that could be introduced in this unit and used throughout other learning include āhua (shape), shape names (e.g. whetū - star), tātai (calculate, calculation), tāpiri (add, addition), ine (measure), taumaha (weight), huri (rotate, rotation), whakaata (reflect, reflection), and neke (translate, translation, move)
Prior Experience
The activities are mostly open ended so they cater for a range of achievement levels. It is expected that students have some experience with naming and classifying basic geometric shapes, with measuring weight in kilograms, and with translating, reflecting and rotating shapes. They should also have place value knowledge to at least 200.
Session One
What the legend does not tell you is that Tamarereti collected 200 bright shiny stones and put them at the bottom of the waka.
Have a ‘waka’ with 200 counters ready for the student to act out the story. Any narrow container will make a good waka.
Look for students to suggest ways to group the counters. Combinations that add to ten are especially useful.
Session Two
How do we find out the date of the full moon from this calendar?
So when will the last quarter start?
When are the good days for fishing?
When will the new moon appear?
So when does the New Year start?
Session Three
Matariki is a time of cultural pursuits and feasting to celebrate the New Year ahead. The hāngī or earth oven has particular significance at the time of the new moon after the rise of Matariki in the eastern pre-dawn sky. Matariki is the star at the bow of Te Waka o Rangi and her travels around the sky for eleven months of the year are exhausting. It is said the steam of the first hāngī in the New Year rises into the sky and replenishes the strength of Matariki. From the offerings she gathers strength to lead the giant canoe for another year. Without Matariki at the bow the canoe cannot travel and Taramainuku cannot cast his net to gather the souls of the departed. At the New Year the names of the dead are called out so the souls of the departed may be cast into the heavens as stars.
There are many resources already available about hāngī.
“Preparing for the hāngī” is a Level 3 activity from the Figure It Out series.
“Hanging out for hāngī” is a unit at Level 3 that develops a statistical investigation around deciding which foods to cook.
The notes below are an adaptation more suitable for Level 2 students.
Students might mention that people should not eat every meat and every vegetable. Agree on some restrictions like one or two meats and up to three vegetables. Point out that stuffing is a yes or no choice.
Session Four
Matariki was a time when food was already stored, and it was cold outside. So whānau (families) spent time together engaging in cultural pursuits such as storytelling, arts and games. Whai (string games) were popular with tamariki (children) and adults alike, especially when they involved co-operation. Whai has a long history and is common to many indigenous cultures around the world, including the indigenous tribes of North America. Traditionally whai was played with twine made from flax. The best man-made fibre to use for whai is nylon since it slides and flexes, and is soft on your hands. It is commonly used to form lines for brickwork so is available at most hardware stores in a variety of colours. Nylon string is usually available in craft shops.
At 1:08 it is easier to think of going over two strings and ‘picking up the third string’ in that move. Note that the move where you use your mouth to shift the bottom of two strings over your thumbs (2:00 - ) is called ‘Navajoing your thumbs’ and is another algorithm common in whai.
Session Five
In this session students learn to play the traditional Māori game Mū Tōrere which is like a form of draughts. The original game is sometimes referred to as the wheke (octopus) game or the whetū (star) game due to the shape of the board. It is appropriate that students learn to play the game at the time of Matariki, since the Māori New Year is a time of engaging in cultural pastimes. The board (see Copymaster 5) has been altered to include the nine or seven stars of Matariki, depending on the version of the game that is played. A digital version of this game is available online - search for “Mū Tōrere - HEIHEI Games”.
The winner must occupy the centre circle, the opponent’s stones must be clustered together around the hexagon and the winner must have the ends of the cluster blocked off. You might try to find a winning arrangement by separating the loser’s stones into a group of two and one but there is no way for the other player to stop them moving.
Dear parents and whānau,
This week we are exploring some mathematical ideas with activities to celebrate Matariki, the Māori New Year. We will be learning the legend of Tamarereti and using that story to learn about numbers of bright stones. We will look at the phases of marama (the moon) to find the best days to go fishing in the New Year period, plan and cost a hāngī, and discover geometry in whai (string patterns). Lastly we will learn to play Mū Tōrere, a traditional Māori game that takes a lot of strategy to win.
These activities involve number, algebra, geometry, measurement and statistics so we will be very busy and doing a lot of mathematical thinking.