It is vital, when planning statistical investigations, that students understand the importance of the way in which they collect, record and present their information (data). Inconsistencies in the carrying out any of these steps can lead to altered findings, and therefore an invalid investigation. Students will first look at choosing a topic to investigate, making sure that the topic lends itself to being investigated statistically. They will then look at a variety of ways of collecting their data and choose the best way to record it. Once they have collected and recorded their data they will investigate the best way to present their findings, taking into consideration the needs of their intended audience. To evaluate the investigations there can be a combination of methods used, depending on the students, the topics and the intended audience. It could be useful for the students to send their completed investigations and findings to interested parties for more realistic feedback.
Investigative questions
At Level 3, students should generate broad ideas to investigate, before refining their ideas into an investigative question that can be answered with data. The teacher supports the development of students' investigative questions through questioning, modelling, and checking appropriateness of variables. Investigative summary, simple comparison and time series questions are posed, where the entire data set can be collected or provided. The variables are categorical or whole numbers.
An important distinction to make is that of the difference between investigative questions, meaning the questions we ask of the data, and data collection or survey questions, meaning the questions we ask to get the data. The data collected through survey of data collection questions allows us to to answer the investigative question. For example, if our investigative question was “What ice cream flavours do the students in our class like?” a corresponding survey question might be “What is your favourite ice cream flavour?” As with the investigative question, survey question development is done by the students with teacher support to improve them so that suitable survey questions are developed.
Analysis questions
Analysis questions are questions we ask of displays of data as we start to describe it. The teacher will often model this through asking students about what they see in their displays. A series of analysis questions can be developed in conjunction with the students. Analysis questions include questions about the features of the display. Questions such as: what is the most common? the least common? how many of a certain category? what is the highest value (for numerical data)? lowest value (for numerical data)? are analysis questions.
Dot plots
Dot plots are used to display the distribution of a numerical variable in which each dot represents a value of the variable. If a value occurs more than once, the dots are placed one above the other so that the height of the column of dots represents the frequency for that value. Sometimes the dot plot is drawn using crosses instead of dots. Dot plots can also be used for categorical data.
Bar graphs
In a bar graph equal-width rectangles (bars) represent each category or value for the variable. The height of these bars tells how many of that object there are. The bars can be vertical, as shown in the example, or horizontal.
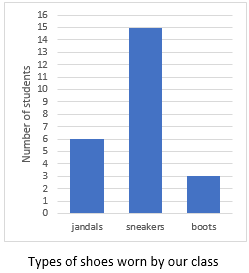
The example above shows the types of shoes worn in the class on a particular day. There are three types of shoes: jandals, sneakers, and boots. The height of the corresponding bars shows that there are six lots of jandals, 15 lots of sneakers and three lots of boots. It should be noted that the numbers label the points on the vertical axis, not the spaces between them. Notice too, in a convention used for discrete data (category and whole number data), there are gaps between the bars.
Strip graphs
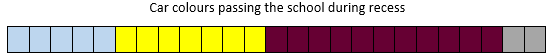
A strip graph represents frequencies as a proportion of a rectangular strip. For example, the strip graph below shows that the students saw five light blue cars, seven yellow cars, 11 maroon cars and two grey ones. The strip graph can be readily developed from a bar graph. Instead of arranging the bars beside one another join them end to end. (Alternatively, you can easily get a bar graph from a strip graph by reversing the process.)
Tally charts
A tally chart provides a quick method of recording data as events happen. If the students are counting different coloured cars as they pass the school, a tally chart would be an appropriate means of recording the data. Note that it is usual to put down vertical strokes until there are four. Then the fifth stroke is drawn across the previous four. This process is continued until all the required data has been collected. The advantage of this method of tallying is that it enables the number of objects to be counted quickly and easily at the end.

In the example above, in the time that we were recording cars, there were 11 red cars, four yellow cars, 18 white cars and five black ones and 22 cars of other colours.
Using software for statistical displays
Microsoft Excel or Google Sheets are readily available tools that allow summarised data to be entered onto a spreadsheet and then graphed.
Other online statistical tools that are good for graphing data, for example CODAP – Common Online Data Analysis Platform, work with raw data and allow a more flexible approach to data analysis. Support videos for students and teachers in New Zealand on using CODAP can be found here.

Giant Mystery
The unit explores relationships between the hand length, width, span of a person and their height and other body measurements. By using the hand print of a giant, students are able to use the relationship between hand size and body size to find out how big the giant is.
In this statistical project students investigate the relationship between two variables: hand size and height. They collect a set of data for the investigation by taking measurements from a sample of people, then create dot plots to explore potential relationships. They interpret their data displays to identify the relationship between hand size and height, and communicate their findings to their classmates, considering the limitations of their results.
Because the project involves collecting measurement data, it provides plenty of opportunities for students to practise measuring and recording length accurately. It also develops students’ understanding of the relationship between measurement units: metres, centimetres and millimetres.
The learning opportunities in this unit can be differentiated by providing or removing support to students and by varying the task requirements. This could include providing additional workshops to scaffold students’ work. Possible workshops include:
More general methods of differentiation could include providing opportunities for students to work in small groups and pairs to encourage peer-learning and extension (tuakana-teina). You could also vary the sample size (i.e. the amount of information students are expected to collect), and vary the cognitive demands associated with surveying a sample by providing appropriate graphic organisers. Provide sentence starters to assist students with interpreting their data and writing summary statements.
The context for this unit can be adapted to suit the interests, experiences, and cultural makeup of your students. The unit focuses on the context of a giant. Increase the relevance of this context by working together with students to brainstorm who the giant might be. This could draw on students’ knowledge of relevant, culturally-located myths and legends, picture book characters, or animated movie characters. You could also read about the Guinness World Records for the world’s tallest man (Robert Wadlow - 2.72 m tall with feet measuring 47 cm in length, and hands measuring 32.3 cm from his wrist to the tip of his middle finger) and the world’s tallest woman (Rumeysa Gelgi - 215.16 cm tall with hands measuring 24.93 cm and 24.26 cm).
Te reo Māori kupu such as mehua (measure), mitarau (centimetre), mitamano (millimetre), mita (metre) kauwhata ira (dot graph, dot plot), raraunga (data), tirohanga tauanga (survey, statistical survey), and matapae (predict, prediction) could be introduced in this unit and used throughout other mathematical learning.
Prior experiences
Before working on this unit, students should have engaged in practical measurement exercises where they measured items of varying length using metres, centimetres and millimetres. They should also know the relationship between metres, centimetres and millimetres. This knowledge will be further developed throughout the following sessions, however, it is also an important prerequisite to collecting the required data (i.e. measurements).
Session 1
In this session we introduce the problem and start collecting data.
We know the length, width and span of the giant’s hand… using this information, can we determine their height?
Encourage students to suggest that it might be worth measuring and recording: body height, hand length, hand width, hand span.
Session 2
In this session we create scatter plots of the relationship between height and hand measurements.
What relationship are we trying to determine? (Relationship between height and hand size.)
How can we determine whether there is a relationship between the various pieces of information we have gathered?
How best could we show that relationship?
Can you see any patterns or relationships?
Using the information on the graph can you predict a person’s height or hand size? Try using the sentence “if they are X cm tall, I think their hands will be X cm in length because the data shows that…”
What relationships are you identifying? A person is (?) times their hand length, or their hand width is one-tenth of their height?
Which hand measure is the best predictor of height? Why?
Can you use this information to work out the giant’s height?
Session 3
In this session we create a silhouette of the giant.
Will the giant be 2-dimensional or 3-dimensional?
Can you see any patterns or relationships?
Using the information on the graph, can you predict a person’s … or …?
What relationships are you identifying? A person is (?) times their …., or their … measurement is …?
Which of your measures is the best predictor of the other variable? Why?
Can you use this information to work out the giant’s height or to to determine the size and proportion of the giant?
Using the class’s predictions, make a 2-dimensional silhouette of the giant using newspaper or butcher's paper. Look up the tallest known man and woman and compare your giant to these people.
Session 4
In this session we discuss the accuracy of our findings.
How accurate is your information?
Using only a hand print, what other measurements can you predict?
How accurate were your predictions?
Session 5
In this session students are challenged to investigate other things we might be able to find out about the giant from their hand print. Challenge students to carry out an investigation in pairs or small groups. Support them to work through the steps of the PPDAC cycle. Support them to present their findings in an engaging and informative manner (this could provide a link to explanation writing, visual presentation skills, using digital tools to create a video or speech, and oral language skills).
Students will have many ideas about this such as:
Dear family and whānau,
This week in maths we are investigating a mystery. A giant has left a handprint and we are using the measurement of the handprint to work out how big other parts of his body are. To do this we need to collect some measurements from other people for comparisons. Please allow your child to measure your hand, height, and a few other parts of your body. They will add this information to our class spreadsheet, which will be kept confidential. Ask them to let you know what we find out by the end of the week and explain to you how we figured this out.
Paper Planes: Level 4
In this unit, students investigate changing one variable to see if they can make a paper plane fly the longest. They will need to define what is meant by the longest. They use scatter plots to establish a possible relationship between variables, then use what they have found to make a paper plane to enter a class competition.
In this unit students plan and carry out their own statistical investigation to find out what makes a paper plane fly the longest. Like all such investigations it is important to have a good idea of what data should be collected, how much data is needed and what the limitations of the collecting mechanism are. It is also important that students are clear about which variable they will be changing so that all other variables can be kept constant. Key vocabulary will need introduction and discussion.
This unit also provides an opportunity to focus on decimal notation, to practise measuring accurately, and to prectise converting between units of measure.
Variable
A variable records characteristics of individuals or things. There are two types of variables - categorical and numerical.
Categorical variables
Categorical variables classify individuals or objects into categories. For example, the method of travel to school; colour of eyes.
Numerical variables
Numerical variables include variables that are measured, for example the time taken to travel to school (continuous numerical variables), and variables that are counted, for example the number of traffic lights between home and school (discrete numerical variables).
Scatter plots
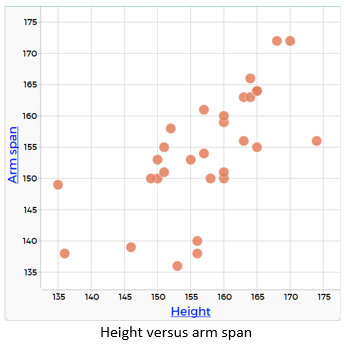
A scatter plot (or scatter graph) is a display for paired numerical variables. For example, a sample of students from CensusAtSchool was taken and their heights and arm spans graphed.
The learning opportunities in this unit can be differentiated by providing or removing support to students and by varying the task requirements. Ways to support students include:
The context for this unit can be adapted to suit the interests and experiences of your students. The statistical enquiry process can be applied to many topics and selecting ones that are of interest to your students should always be a priority. This investigation focuses on paper planes, however, if your students are more interested in helicopters or waka, the unit could be adapted to focus on making a paper helicopter fly the “longest” or a paper waka sail the “longest”. Consider your students’ current learning and out-of-school interests, relevant and current world-events, and current learning from other curriculum areas. For example, this unit might link to a wider social-sciences context investigating the migration of early Māori and Pacific peoples to New Zealand and historical modes of transport.
Te reo Māori vocabulary such as kauwhata marara (scatter graph, scatterplot) and taurangi (variable) could be introduced in this unit and used throughout other mathematical learning
Prior experiences
Before working on this unit, students should have engaged in practical measurement exercises where they measured items of varying length using metres, centimetres and millimetres, and measured time using minutes and seconds. They should understand how to measure accurately, and may have some experiences of converting between metric units. Through these experiences, they should have developed some understanding of the relationship between metres, centimetres and millimetres and between minutes and seconds.
Getting started
What might be meant by the longest? Is this the longest distance, or the longest time, or some other longest?
What features would a plane that can fly a long way have?
What features would a plane that can fly for a long time have?
If you were to make a plane to fly a long way/long time what else would you need to consider?
Which units allow for the greatest accuracy? Why?
Exploring
Over the next few days have students work in pairs or small groups to carry out investigations using the following steps. Model each of these steps, in the correct order, before giving students the opportunity to start their investigations. Pay attention to the gaps that appear in students’ knowledge and use these to plan small group or individualised teaching sessions. Students may want to research the flight of paper planes before they chose the focus of their investigations.
Investigation Steps
Example Investigation
Data collected as below:
Data plotted as below
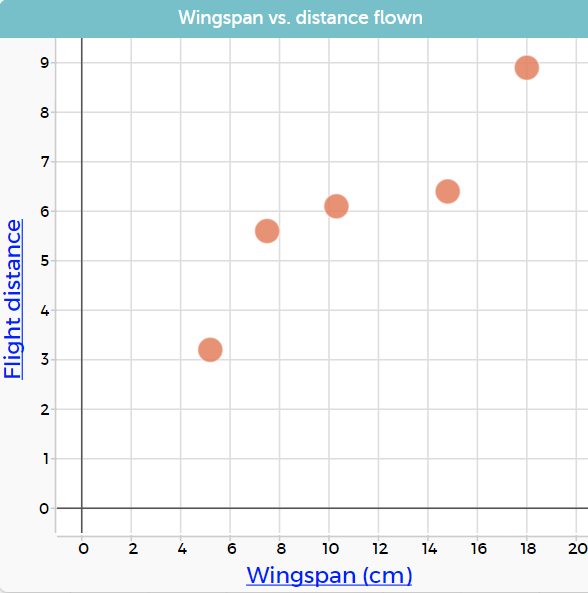
As the wingspan increases so does the distance flown.
As investigations are carried out the following points may need to be discussed with the students.
Reflecting
What evidence did we have that those planes would be the most successful?
If we were going to hold another competition which features could we combine to produce a very successful plane?
Was there anything fair or unfair about our investigation?
Dear parents and whānau,
This week at school we are making paper planes and measuring how far they can fly. Ask your child to share their design with you and offer some suggestions of things they could try to improve the design of their plane. If you have access to the internet or other references available, please help your child spend some time researching flight at home so that everyone can report their findings back to the class.
Planning a statistical investigation (Level 2)
In this unit students will identify how to plan and carry out a statistical investigation, looking at facts about their class as a context.
It is vital when planning statistical investigations that the students understand the importance of the way that they plan, collect, record and present their information. If they are not consistent in the way they carry out any of these steps, they could alter their findings, therefore making their investigation invalid.
In this unit the students will first look at choosing investigative questions to explore, making sure that the topic lends itself to being investigated statistically. They will collect their data using structured recording methods. Once they have collected and recorded their data, they will present their findings, using appropriate displays, and make descriptive statements about their displays to answer the investigative question.
Dot plots
Dot plots are used to display the distribution of a numerical variable in which each dot represents a value of the variable. If a value occurs more than once, the dots are placed one above the other so that the height of the column of dots represents the frequency for that value. Sometimes the dot plot is drawn using crosses instead of dots.
Investigative questions
At Level 2 students should be generating broad ideas to investigate and the teacher works with the students to refine their ideas into an investigative question that can be answered with data. Investigative summary questions are about the class or other whole group. The variables are categorical or whole numbers. Investigative questions are the questions we ask of the data.
The investigative question development is led by the teacher. Through questioning of the students, the teacher identifies the variable of interest, and the group identifies what the investigative question is about. Within this, the teacher forms the investigative question but with student input.
Survey questions
Survey questions are the questions we ask to collect the data to answer the investigative question. For example, if our investigative question was “what ice cream flavours do the students in our class like?” a corresponding survey question might be “what is your favourite ice cream flavour?”
As with the investigative question, survey question development is led by the teacher, and through questioning of the students, suitable survey questions are developed.
The learning opportunities in this unit can be differentiated by providing or removing support to students and by varying the task requirements. Ways to support students include:
The context for this unit can be adapted to suit the interests and experiences of your students.
For example:
Te reo Māori vocabulary terms such as raraunga (data), tauanga (statistics), tuaka (axis), and āwhata (scale) could be introduced in this unit and used throughout other mathematical learning.
Although this unit is set out as five sessions, to cover the topic of statistical investigations in depth will likely take longer. Some of the sessions, especially sessions 4 and 5 could easily be extended as a unit in themselves. Alternatively, this unit could follow on from a unit on data presentation to give students an appreciation of practical applications of data display.
Session 1
Session 1 provides an introduction to statistical investigations. The class will work together to answer the investigative question – How many brothers and sisters do people in our class have? Be sensitive to the needs of your class - if this context is inappropriate for your students , then it may need to be altered.
Explain that statistics concerns the collection, organisation, analysis and presentation of data in a way that other people can understand what it shows.
How many brothers and sisters do people in our class have?
Students might suggest that we ask how many siblings they have, or they might suggest we ask how many brothers, how many sisters and how siblings they have altogether.
The idea of asking about brothers and sisters separately allows for a deeper exploration of the data and a more in depth answer to our investigative question.
Sticky notes could be a good way to collect this information from the students as it will allow rearrangements of the data quickly.
For example:
Pip records the following information about her brothers and sisters. She gives it to her partner. Her partner, Kaycee shares this information with another student. Kaycee says that Pip has three brothers and one sister. Altogether Pip has four siblings.
How can we use the pieces of paper (or sticky notes) to show someone else how many brothers and sisters people in the class have?
How can we show the information so that people can easily understand what it is showing?
Hopefully, someone will suggest a more organised list, or counting the number of 0s, the number of 1s etc and writing sentences to explain how many there are of each.
Session 2
This session is ultimately about choosing an appropriate topic to investigate about the class. There will be a real need for discussion about measurable data and realistic topics that can be investigated in the given time frame. It would be a good idea to provide the students with a list of topics if they get stuck, but they should be encouraged to try and come up with something original where possible.
PROBLEM: Generating ideas for statistical investigation and developing investigative questions
If groups are having trouble thinking of ideas, you could try writing a list of suggestions on the board but limiting groups to using one of your ideas only, to encourage them to think of their own. Some ideas could be:
PLAN: Planning to collect data to answer our investigative questions
Explain that these questions are called survey questions and they are the questions we ask to get the data. Work with groups to generate survey questions. For example:
Possible survey questions are:
In these examples you can see that the survey question and investigative question are very similar, but there are key differences that make it an investigative question (What are Room 30’s favourite native birds? – overall about the class data) rather than a survey question (What is your favourite native bird? – asking the individual).
Session 3
Data collection is a vital part of the investigation process. In this session students will plan for their data collection, collect their data and record their data and summarise using a tally chart or similar for analysis in the following sessions.
PLAN continued: Planning to collect data to answer our investigative questions
DATA: Collecting and organising data
Session 4
In this session the students will work on creating data displays of the data collected in the previous session.
ANALYSIS: Making and describing displays
Numerical data – displaying count data e.g. “How many…” investigative questions
Categorical data – displaying data that has categories e.g. “What…” investigative questions
Session 5
Session 5 is a finishing off session. Students should be given time to complete their graphs if they have not already, and to write statements about what the graphs show.
Dear parents and whānau,
During the next week we will be working on statistical investigations in maths. Over this time, your child will be gathering data on the class and presenting it using data displays such as dot plots and bar graphs. If you know of any graphs or tables of information suitable to discuss with your child, either in the newspaper, or in a book, or perhaps on some advertising material, this week would be a good time to do so.
Figure it Out Links
Some links from the Figure It Out series which you may find useful are:
Hanging out for Hāngī
In this unit students are faced with the challenge of ordering the right amounts of food to put down in a hāngī for the whole school. They carry out a statistical investigation into the preferred choices of food of the school population.
Statistical investigations include the four aspects; pose questions, collect data, display data and discuss results. These four are closely linked as what data is collected can dictate the way that it is displayed and the conclusions that can be reached from the investigation. On the other hand, if some restrictions have been placed on the means of display, only certain types of data collection may be relevant.
By Level 3 students can begin to talk about situations they have experienced, pose their own questions for an investigation, produce a plan for a statistical enquiry, and use a variety of methods to display their data.
Associated Achievement Objective
Social Studies AO2: understand how cultural practices vary but reflect similar purposes
The learning opportunities in this unit can be differentiated by providing or removing support to students and by varying the task requirements. Ways to differentiate include:
The contexts for this unit can be adapted to suit the interests and cultural backgrounds of your students. For example, instead of framing the investigation around the context of hāngi, you could use the context of investigating the amount of food that should be bought for the school disco, your class camp, a birthday party, brought to a cultural-celebration day at school, or donated to a local food bank. You could begin the unit with a discussion of hāngi, before working with the students and whānau to link this learning to other meaningful contexts from their lives.
Te reo Māori vocabulary terms such as kauwhata (graph), kauwhata ira (dot plot, dot graph), kauwhata pou (bar graph), tūtohi tatau (tally chart), tūhuratanga tauanga (statistical investigation), haukume (bias), and whakatairite (compare) could be introduced in this unit and used throughout other mathematical learning.
Graphing and data collection resources (e.g. access to Microsoft Excel, chosen graphing and data collection templates)
Session 1
The school has decided to put down a hāngī for all students to experience. Previously when the school did a hāngī a lot of food was wasted because students didn’t like certain foods. You have been given the task of finding out what food should be put in the hāngī so that there is the least amount of wastage.
What foods are cooked in a hāngī? What would best be cooked using this process?
We are thinking of having mutton in the school hāngī, do you like mutton yes or no?’
What is wrong with this question? Explain that this question shows bias because the surveyor is already thinking about having mutton. Because they have said this, it may affect how the person answering the questionnaire might answer. This means that they have not given an equal chance to both possible answers to the question.
How could we reword the question to eliminate the bias?
Session 2
Prior to this session you would need to have organised for students to visit different classes to gather the data from each student.
Why are we trying to find this out? (reduce food wastage)
What labels are needed on your graph?
What would be an appropriate title for your graph?
Can you tell me what your graph shows?
Direct students to make a presentation (e.g. a video, infographic, set of Google slides) that shows the questions they asked and why, their ‘raw’ data, their graph, and 3-5 summary statements.
Session 3 and 4
What similarities and differences can you see between these classes?
Is it easy comparing bar graphs and pie graphs?
What should we have done?
What trends are starting to appear?
Which meat and vegetables seem to be most favoured?
Session 5
Ask reflective questions such as:
Which graph best shows this data?
Which graphs are easiest to interpret? Why?
Which graph is least effective?
What kind of data would this graph be better for?
Dear parents and whānau,
In maths our focus is on statistics. We have been carrying out a survey to establish the students' food preferences for a school hāngī as a way to reduce food waste.
Please ask you child to explain the results of their survey and listen to the statements they make. Ask them questions like:
What would be good to put down in the hāngī if you want to make sure everyone eats their food?
What kind of foods could you try that might not be traditional choices?
Explain your different graphs to me-what do they show?
Thank you for your support and interest.
Making Muffins
The purpose of this activity is to engage students in applying the skills of a statistical enquiry to make a business decision.
This activity assumes the students have experience in the following areas:
The problem is sufficiently open ended to allow the students freedom of choice in their approach. It may be scaffolded with guidance that leads to a solution, and/or the students might be given the opportunity to solve the problem independently.
The example responses at the end of the resource give an indication of the kind of response to expect from students who approach the problem in particular ways.
A roadside ‘coffee cart’ offers drinks and muffins for sale.
To make a healthy profit, they need to make just enough muffins to nearly sell out by the end of the day.
Use the sales figures for the past three months to suggest how many muffins they should make for a typical day.
Sales figures (XLSX, 12KB)
The following prompts illustrate how this activity can be structured around the phases of the Statistical Enquiry Cycle.
Problem
The problem section is about what data to collect and who to collect it from and why it’s important.
Plan
The planning section is about how students will gather the data.
Data
The data section is concerned with how the data is managed and organised.
Analysis
The analysis section is about exploring the data and reasoning with it.
Conclusion
The conclusion section is about answering the question in the problem section and providing reasons based on their analysis.
Examples of work
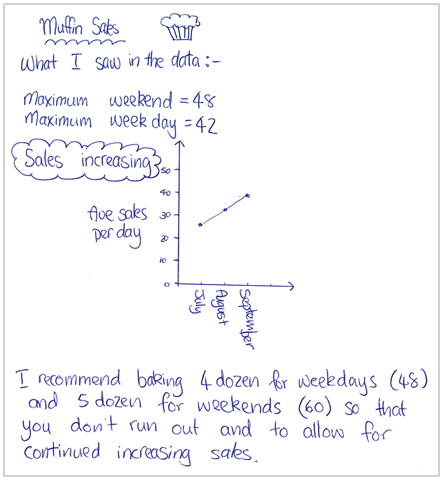
Work sample 1
The student calculates relevant sample statistics and considers trends in the time series data to make a judgement about the number of muffins to bake.
Click on the image to enlarge it. Click again to close.
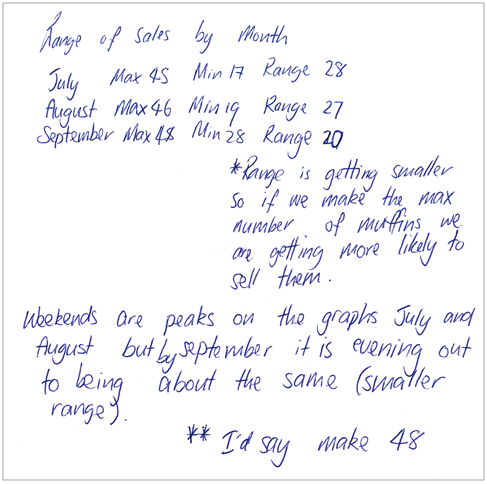
Work sample 2
The student uses a combination of calculating sample statistics, creating data display and considering trends on weekdays and on weekends, to make a judgement about how many muffins to bake.
Click on the image to enlarge it. Click again to close.
Planning a statistical investigation (Level 3)
In this unit students will identify how to plan and carry out a statistical investigation about a topic of interest.
It is vital, when planning statistical investigations, that students understand the importance of the way in which they collect, record and present their information (data). Inconsistencies in the carrying out any of these steps can lead to altered findings, and therefore an invalid investigation. Students will first look at choosing a topic to investigate, making sure that the topic lends itself to being investigated statistically. They will then look at a variety of ways of collecting their data and choose the best way to record it. Once they have collected and recorded their data they will investigate the best way to present their findings, taking into consideration the needs of their intended audience. To evaluate the investigations there can be a combination of methods used, depending on the students, the topics and the intended audience. It could be useful for the students to send their completed investigations and findings to interested parties for more realistic feedback.
Investigative questions
At Level 3, students should generate broad ideas to investigate, before refining their ideas into an investigative question that can be answered with data. The teacher supports the development of students' investigative questions through questioning, modelling, and checking appropriateness of variables. Investigative summary, simple comparison and time series questions are posed, where the entire data set can be collected or provided. The variables are categorical or whole numbers.
An important distinction to make is that of the difference between investigative questions, meaning the questions we ask of the data, and data collection or survey questions, meaning the questions we ask to get the data. The data collected through survey of data collection questions allows us to to answer the investigative question. For example, if our investigative question was “What ice cream flavours do the students in our class like?” a corresponding survey question might be “What is your favourite ice cream flavour?” As with the investigative question, survey question development is done by the students with teacher support to improve them so that suitable survey questions are developed.
Analysis questions
Analysis questions are questions we ask of displays of data as we start to describe it. The teacher will often model this through asking students about what they see in their displays. A series of analysis questions can be developed in conjunction with the students. Analysis questions include questions about the features of the display. Questions such as: what is the most common? the least common? how many of a certain category? what is the highest value (for numerical data)? lowest value (for numerical data)? are analysis questions.
Dot plots
Dot plots are used to display the distribution of a numerical variable in which each dot represents a value of the variable. If a value occurs more than once, the dots are placed one above the other so that the height of the column of dots represents the frequency for that value. Sometimes the dot plot is drawn using crosses instead of dots. Dot plots can also be used for categorical data.
Bar graphs
In a bar graph equal-width rectangles (bars) represent each category or value for the variable. The height of these bars tells how many of that object there are. The bars can be vertical, as shown in the example, or horizontal.
The example above shows the types of shoes worn in the class on a particular day. There are three types of shoes: jandals, sneakers, and boots. The height of the corresponding bars shows that there are six lots of jandals, 15 lots of sneakers and three lots of boots. It should be noted that the numbers label the points on the vertical axis, not the spaces between them. Notice too, in a convention used for discrete data (category and whole number data), there are gaps between the bars.
Strip graphs
A strip graph represents frequencies as a proportion of a rectangular strip. For example, the strip graph below shows that the students saw five light blue cars, seven yellow cars, 11 maroon cars and two grey ones. The strip graph can be readily developed from a bar graph. Instead of arranging the bars beside one another join them end to end. (Alternatively, you can easily get a bar graph from a strip graph by reversing the process.)
Tally charts
A tally chart provides a quick method of recording data as events happen. If the students are counting different coloured cars as they pass the school, a tally chart would be an appropriate means of recording the data. Note that it is usual to put down vertical strokes until there are four. Then the fifth stroke is drawn across the previous four. This process is continued until all the required data has been collected. The advantage of this method of tallying is that it enables the number of objects to be counted quickly and easily at the end.
In the example above, in the time that we were recording cars, there were 11 red cars, four yellow cars, 18 white cars and five black ones and 22 cars of other colours.
Using software for statistical displays
Microsoft Excel or Google Sheets are readily available tools that allow summarised data to be entered onto a spreadsheet and then graphed.
Other online statistical tools that are good for graphing data, for example CODAP – Common Online Data Analysis Platform, work with raw data and allow a more flexible approach to data analysis. Support videos for students and teachers in New Zealand on using CODAP can be found here.
The learning opportunities in this unit can be differentiated by providing or removing support to students and by varying the task requirements. Ways to support students include:
The context for this unit can be adapted to suit the interests and experiences of your students. For example:
Te reo Māori kupu such as tūhuratanga tauanga (statistical investigation) and taurangi (variable) could be introduced in this unit and used throughout other mathematical learning
This unit is set out to cover the topic of statistical investigations in depth will likely take 1-2 weeks. Some of the sessions may take more than one classroom session to complete. There is an introduction session followed by five sessions that follow the statistical enquiry cycle (PPDAC cycle) as described in the New Zealand Curriculum. Data detective posters showing the PPDAC (problem, plan, data, analysis, conclusion) cycle are available to download from Census At School in English and te reo Māori.
While this unit plan uses the five phases of the PPDAC cycle as a step by step process, in reality when using the PPDAC cycle one often moves between the different phases. For example, students might need to revisit the investigative question (problem) as a result of the planning phase.
Session 1: Introduction
This session provides an introduction and purpose to statistical investigations. The teacher will need to provide the students with plenty of magazines, newspapers and websites that have some good examples of how data can be presented effectively and perhaps some examples of poorly displayed data. This could be collated into a chart or slideshow. Prior to the session, ask the students to spend some time at home looking through magazines and newspapers to find examples of statistics to bring in for the session.
What is a statistical investigation?
Can you think of an example when we might need to carry out a statistical investigation?
Who has done the research for/carried out this investigation?
Who will benefit from the results of this investigation?
Is it clear to you what the purpose of the investigation is?
What do you like about the way that the information is presented?
Does it help you in any way to understand the information better?
Do you think the information could have been presented in a different way to help the audience understand the findings? If so, what would have made it better?
Session 2: PROBLEM (Generating ideas for statistical investigation and developing investigative questions)
This session is ultimately about choosing an appropriate topic to investigate. You will need to discuss what data is actually measurable within your context and realistic topics that can be investigated in the given time frame. It would be a good idea to provide the students with a list of topics (perhaps relating to a current school issue, relevant curriculum area, or your students' cultural backgrounds and interests). Encourage students to come up with something original where possible.
These are the questions we ask of the data; it will be the question(s) we explore using the PPDAC cycle.
Session 3: PLAN (Planning to collect data to answer our investigative question)
Data collection is a vital part of the investigation process. The teacher will need to stress to the students, once again, the importance of being consistent in the collection of their data. There will also need to be sufficient discussion around efficient methods for data collection and recording.
Fundamentally, data collection and survey questions are the same – they are both questions we ask to get the data.
Managing surveys: depending on the target groups and how you plan to manage the survey process there are a few options here to choose from.
Option 1: an online questionnaire is developed for each group that will be surveyed. This following should be considered:
Option 2: a paper questionnaire is developed for each group that will be surveyed. Similar considerations to the online questionnaire are needed, except that a paper copy will need to be printed for each person to fill out. These should be collected up and brought back to the class if the people who have filled them out are not in the class
Other data collection methods
Depending on the topics, students might be collecting data about litter, cars, pedestrian traffic. These are not things that we would use a questionnaire for so the students will need to think about a plan to collect the data. They may decide to use a pre-prepared table or grid to do this. The table should be set up so that the information for each of their data collection questions for a single object can be recorded in a single row. For example:
Collecting information about vehicle make and colour – students might also think to collect the vehicle type too.
Set up a table with four columns:
Students need to check with the teacher before commencing data collection to ensure that their method of collection is the most appropriate and will result in data that is useful for analysis.
Session 4: DATA (Collecting and organising data)
Note for teachers:
Students will use their .csv file to make their displays in the next session. If it is not possible for them to save as a .csv then the teacher may need to do this and share with them or set up the CODAP document with their data and share a link to this. See the video or written instructions on how to do this. Note the video and the instructions include getting started with CODAP too.
Session 5: ANALYSIS part 1 (Using an online tool to make data displays)
In this session the students will be introduced to using an online tool for data analysis. One suggested free online tool is CODAP. Feel free to use other tools you are familiar with. This session is written with CODAP as the online tool and assumes students have not used CODAP before.
If you do not want to use an online tool, then continue to Making Displays, and construct paper versions of bar graphs and dot plots.
Learning how to use CODAP
The main features that students need to be familiar with are how to draw a graph and how to import their data. More on importing data into CODAP can be found here.
Bar graphs for categorical data
CODAP by default makes a dot plot for both categorical and numerical data. If the data is categorical the bar graph icon (configuration icon) can be selected to fuse the dots into bars, shown in the two pictures below. The graphs are showing the habitats of mammals.
Students should be encouraged to try different things out with the data to get further insights as to what the data might show them. For example, for the above data about mammals students might want to see what happens to the diet for different habitats. They can drag the diet attribute onto the top axis of the graph (and to get different colours they can drag the diet attribute into the middle of the graph to make a legend) and the following display will result.
This gives a deeper insight into the data. You will find that students at this age are comfortable with using CODAP once they have had a little time to play with the software.
Dot plots for numerical data
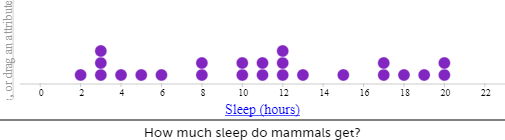
When using CODAP for numerical data a dot plot is the default setting. For example, sleep in hours for mammals shown below.
The data can be split into groups by dragging a categorical attribute to the vertical axis. To explore the sleep by the different habitats, drag habitat to the vertical axis, or to explore sleep by the different diets, drag diet to the vertical axis. The following graphs result.
Making displays for the data they have collected to answer their investigative question
Session 6: ANALYSIS part 2 (Describing data displays)
Session 7: CONCLUSION (Answering the investigative question and reporting findings)
This last session will focus on the final presentation of the data each group has found out. Encourage the students to be constantly evaluating what they are doing. Explain that it is fine to discover that a particular way of presentation is not working, and that it is a good idea to adjust.
Dear parents and whānau,
During the next two weeks we will be working on statistical investigations. Over this time, your child will be gathering data and presenting it using tables and graphs. Your child now needs to be thinking about choosing a topic to investigate. It would be helpful for your child if you could support him/her with selecting a topic, gathering data and perhaps watching for relevant newspaper or television items that will help him/her with analysing the information and forming a conclusion.
Thank you for helping with your child's statistical investigation.
Figure it Out Links
Some links from the Figure It Out series which you may find useful are: