Whilst this unit is presented as a sequence of five sessions, more sessions may be required. Any session may extend beyond one teaching period.
Session 1
This session is about students becoming familiar with the defining features of common three-dimensional shapes and representing these shapes with freehand drawings from different viewpoints.
SLOs:
- List the features of common three-dimensional shapes.
- Recognise that the faces of 3D shapes are 2D plane shapes.
- Explore and understand the defining features of a prism.
- Draw (freehand) common 3D shapes from different viewpoints.
Activity 1
- Make available pencils and paper.
Draw a diagram of a circle.
Give student pairs 1 minute to write some of the objects that this circle could represent.
Have student pairs share their ideas with the class.
- Display solid sphere, cylinder and cone shapes.
.png)
Ask, “Could this (circle) be a drawing of a sphere or a cone or a cylinder?” Have students discuss this and reach agreement that this could be a bird’s eye view of a sphere or a cylinder or a view of a cone looking at it from underneath, (or perhaps from the top if the point were very fine).
Write ‘viewpoint’ on the class chart, agree on a definition that a viewpoint is a perspective of an object from a specific location. Discuss and identify other possible drawings of the three objects. Ask students to be specific about the viewpoint each picture is taken from. For example, a cone appears as a triangle from side on, and a cylinder looks like a rectangle from side on. - Does a sphere always look like a circle, no matter the viewpoint?
- Note that many students want to behave like cubist artists, and convey the curvature of surfaces in their drawings. For example, they might draw a side view of a cone with a curved base. Videos of how to draw a cone or sphere could be used to support this.
- Taking and displaying digital photographs of the solids can support students to accept the loss of information in a two dimensional drawing.
Activity 2
- Add to the solid shape display, a cube, a cuboid, a hexagonal prism, a triangular prism, and a square based pyramid.
Create a chart, writing on it the names of each of the shapes and the headings, faces, edges and vertices. This chart could be created digitally or on paper. It should be created in such a manner that will encourage students to refer back to it throughout the sessions. Define the meaning of each feature of the shapes. For example, a face is a polygon that is part of the boundary of a solid. Model and record the features of at least 2 of the shapes. Note that a sphere is a curved surface and has no faces. A cone also has a curved surface.
| Shape | Faces | Edges | Vertices |
| Sphere | 0 | 0 | 0 |
| Cube | 6 | 12 | 8 |
| Cylinder | | | |
| Cone | | | |
| Cuboid | | | |
| Triangular prism | | | |
- If you do not have enough models of the shapes available, provide play dough and plastic knives so students can sculpt the shapes.
- Provide students with a template of the chart. Ask students to complete their own chart (individually or in pairs). They should make models of each shape with the play dough, and use these models to explore and confirm the features of each shape.
- Discuss the strategies the students used to count the number of faces, edges and vertices for each solid. Their strategies typically include counting top and bottom of a solid then counting the remaining faces, edges, or vertices.
- Students could be extended by looking for patterns in the numbers of faces, edges, and vertices each shape has. Can they use the pattern to find a shape’s number of edges if the number of faces and vertices are known, etc? Euler’s formula (F + V = E + 2) could be discussed and proven with a cube (6 + 8 = 12 + 2). Note: students may discover this formula in a different format (for example, F + V - E = 2). Use whichever format they discover. Does this formula work with cylinders, cones, and spheres? Students could explore other exceptions to the formula.
- Students could investigate composite 3D shapes (3D shapes made from basic 3D shapes such as cuboids, prisms, pyramids, etc) to see if Euler’s formula still applies. This could be made more meaningful by using composite 3D shapes that are familiar to the students, such as a wharenui which can be seen as a poro-tapatoru (triangular prism) on top of a poro-tapawhā hāngai (cuboid). Does Euler’s formula still apply to a wharenui shape? (it has 7 faces, 10 vertices, and 15 edges)
Draw on the shape of local buildings in your area in this discussion. For example, the main building of the South Canterbury Museum in Timaru has an interesting shape (an octagonal pyramid on top of another octagonal pyramid on top of an octagonal prism). Does Euler’s formula still apply to this shape? (it has 25 faces, 25 vertices, and 48 edges)
What other composite 3D shapes can you think of?
The Let’s Face It activity could be used to further support students to investigate Euler’s formula. - Discuss that a cylinder, cone and sphere have no edges or vertices. That is because edges and vertices are formed where faces, polygons, meet.
How many faces meet at an edge? (Two – this is an important generalisation)
How many corners meet at a vertex? (That number depends on the number of faces surrounding each vertex. For a cuboid the number is three) - What do students notice about the number of faces, edges and vertices of a cube and of a cuboid? (the same)
Why does that happen? (A cube is a type of cuboid)
Activity 3
Have each student choose at least two of the shapes that they have made, and make freehand drawings of each, from at least two different viewpoints. Have students share their drawings with a partner, and have a korero about what they have done, using the language of faces, edges and vertices.
In the follow up discussion ask one student at a time to show just two viewpoints of the same solid.
Can you identify which solid these viewpoints represent?
Do you need more viewpoints or less to make a specific identification? Why?
Activity 4
- Invite students to visualise straight (planar) cuts of a square based pyramid and a cuboid (rectangular prism), parallel to the base. You might use the analogy of slicing loaves of bread.
What shape will the cross sections be? (squares for the pyramid, rectangles for the prism)
Will the cross sections be exactly the same? Students should notice that cross sections of the pyramid vary in size, while the prism has constant cross section.
Alternatively students can make a pyramid and rectangular prism from play dough, plasticine, or cheap vegetables such as potatoes, pumpkin, or carrot (Make a vegetable soup for lunch afterwards). They can make cuts through each shape. Take pictures of their creations to display alongside their explanations of the activity. - Discuss the results, eliciting the explanation that the faces of the cuts of the pyramid change, whilst the prism faces remain unchanged.
Does the property of constant cross section also apply to other types of prism? (Yes) - You might explore the idea by slicing other prisms. Agree on a definition of a prisms?.
Activity 5
Conclude the session by having students draw any prism from at least two viewpoints. Ask them to record their work, using the language of faces, edges and vertices, and to write their own definition of a prism.
Is a prism easy to identify by its viewpoints? Why?
Session 2
This session is about exploring cube constructions, representing those constructions from different viewpoints on isometric paper, and interpreting the drawings of others.
SLOs:
- Make simple constructions using interlocking cubes.
- Represent different viewpoints of the constructions with drawings on isometric paper.
- Create cube constructions from viewpoint drawings made by another student.
Activity 1
- Begin by having students share their work from Session 1, Activity 5.
- Explain that they will use isometric paper to reduce the need to measure, and to make their drawings more precise.
- Introduce the task by showing a cube, selecting a viewpoint, and modelling how to represent a single cube on isometric paper. Videos could be used to share these instructions digitally. The online tool ‘Isometric Drawing Tool’ could be used to model this, and to explore the position and viewpoints of cubes and different shapes represented on isometric paper, throughout this session.
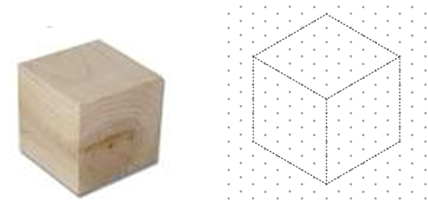
Notice that the cube has a leading edge, marked by the central vertical line. The faces that meet at the edges are drawn as rhombi rather than as squares. The top face is also drawn as a rhombus. - Make cubes and isometric paper (Copymaster 1) available to each student.
- Walk students through the steps of drawing a single cube then try joining additional cubes behind it, and below it.
The drawing above shows a large cube. Discuss any challenges that arise.
What is the smallest cube you could draw? - Students who are ready for extension could try to draw letters, towers, or different shapes. There are lots of videos and prompts online that they could use to challenge themselves.
Activity 2
- Provide isometric paper and nine interlocking cubes to each student. Have students join the cubes to make a shape of interest, then draw this shape from at least two viewpoints. It is important that the faces of the cubes meet exactly.
- If students have difficulty drawing the shapes, model viewing the shape from different viewpoints, and model the drawing of the shape.
- First, get students to tilt their model so there is a leading edge, and the top faces are visible from their viewpoint as rhombi.
- Second, draw the leading edge vertically on the isometric paper. That edge might be several little cube edges joined.
- Third, draw the lateral faces coming back from that edge.
- Finally, complete the whole shape, including the top.
- The Little Boxes activity could be used to further support students having difficulty drawing the shapes if needed.
- Students who are ready to be extended could try drawing isometric cubes with cutouts or “impossible” isometric shapes (tutorials for these are available online).
Activity 3
Ask students to display their models on a table top, and pass in their isometric drawings. Mix-up the drawings and redistribute them randomly amongst the students. Each student must then locate the model that matches the drawing that they have been given. Confirm their matches.
How do you know that this is the correct model? (Viewpoint matches)
What strategies did you use to locate the model?
Is it possible to have different isometric drawings of the same model? Why?
Is it possible to have several models that match a single drawing? Why?
This discussion helps students appreciate the loss of information about a three dimensional object when it is represented in a two dimensional drawing.
Activity 4
Have students dismantle their shapes into single cubes. Collect in the drawings once more, shuffle these and redistribute them. Have students construct the model shape from another student’s isometric drawing. Rove and support students with the building of their shapes.
Activity 5
Conclude the session by discussing the process, having students talk about the representation of shapes from different viewpoints and highlighting the geometric language, e.g. faces, edges, vertices.
Session 3
This session is about exploring a selection of Picasso portraits, identifying some distinguishing stylistic characteristics. Consider whether a community member or art gallery employee might be able to come to your class to talk about Cubist art, Picasso, and relevant art created by New Zealand, Māori, and Pasifika artists.
SLOs:
- Become familiar with and describe the characterising features of a Picasso portrait.
- Understand some of the defining features of cubism.
- Write a description of the influence of geometry in a Picasso portrait.
Activity 1
- Write Pablo Picasso on the class chart. Brainstorm and record student knowledge of the artist. Show his picture, and share the information in Copymaster 2, or set a short time limit and have the students research pertinent information about the artist online.
I wonder why his style is known as cubism? Note that there is nudity depicted in Picasso’s works. You may wish to gather a selection of age-appropriate art works to show your students, as opposed to letting them freely explore his work online. - Discuss how Picasso tried to depict three dimensional features of his subject on a two dimensional surface. Isometric drawing belongs in the perspective methods of realist artists before Picasso.
- Explore the work of New Zealand Cubist artists, including Louise Henderson, Colin McCahon, John Weeks, Wilfred Stanley Wallis, and Melvin Day. Discuss the similarities to Picasso’s work. This could be done as a whole class, or in pairs. If working in pairs, students could compare a work of one the New Zealand artists, with a work by Picasso, with the use of a venn diagram or T chart.
- Compare the Cubist work to traditional Maori and Pasifika art forms (e.g. tapa, siapo, whakairo), and art done by artists such as Kura Te Waru Rewiri, Paratene Matchitt, Cliff Whiting, Ralph Hotere, and John Bevan Ford. In the art created by these artists, two-dimensional shapes are often used.
Activity 2
- Have students work collaboratively (mahi tahi) with a partner and give them one of the pictures in Copymaster 3, paper and pencils. Students should have a korero about their Picasso portrait, and record all the things that they feel and notice about it.
What was Picasso trying to represent about his subject?
How did he alter what can really be seen from one viewpoint? - Have students pair-share their feelings and observations, and agree on common features.
- As a class, discuss their feelings about the artworks. Record these responses, (like because….., dislike because….., puzzled because…., etc.)
- Discuss and record on the class chart the features that they notice about the artworks.
These are likely to include:- You can see the person from a front viewpoint and a side viewpoint (profile) in the same picture
- There are geometric shapes in the pictures
- There are many light and dark contrasts (chiaroscuro is the arrangement of light and dark elements in a pictorial work of art, also known as positive and negative space)
- Black is used to outline shapes and to draw features
- The pictures are not realistic – they are not how people really look
- The pictures appear to be fragmented, or broken up into parts
- They are a combination of two-dimensional flat plane shapes and some realistic rounded and shaded three-dimensional images.
Activity 3
- Write ‘cubism’ on the class chart and have students share their knowledge of this art form. Agree that many of the features they have identified in 2 (above) are defining features of cubism. Explain that Pablo Picasso and Georges Braque began their innovative, new art movement, cubism, in the early 20th century (the 1900s).
What did art look like before that time?
(Some students may know about impressionists such as Van Gogh and Monet who were instrumental in the movement towards conveying feelings about a subject, rather than just capturing a realistic image). - Make a copy of one of the pictures from Copymaster 3 available to each student. Have them write a description of the picture and the artist, synthesising the information that has been presented so far about both and including references to geometry and viewpoints.
Activity 4
- Display both photographs of Picasso (Copymaster 2).
- Explain that in the next session, each student will be choosing one of the photographs and creating their own portrait of Picasso based upon the photograph. The portrait will be in the cubist style.
- Have students begin a draft design of their Picasso portrait.
Activity 5
Conclude the session by having students share their work.
Ask each student to bring to the next session a photograph of a whānau member, friend, or pet that they would like to use as the subject of an artwork.
Session 4
This session is about using the style of cubism to create a portrait of Picasso, and begin an artwork of a person or pet significant to the student.
SLOs:
- Create at least one portrait in the Picasso style.
- Give feedback to other students on the cubist influence evident in their artworks.
Activity 1
- Begin the session by reviewing the features of cubism listed in Session 3, Activity 2, Step 4.
- Display both pictures of Picasso (Copymaster 2).
- Students select one of the pictures of Pablo Picasso, and create a draft cubist portrait.
- Have students share the progress on their draft portraits of Picasso.
What viewpoints did you imagine?
How did you represent how Picasso would look from each viewpoint?
What geometric shapes did you use? Why?
Activity 2
- Make available art paper and pastels. Students choose their own subject. Picasso tended to paint people (women mainly), though animals were another common subject.
- Let students begin their Picasso works in a pastel medium. Insist they sketch the work first in pencil. Art takes careful planning, like other forms of design. Stop at significant points to review progress, checking against the listed cubist criteria.
Activity 3
As students complete their works, have them self-check and peer evaluate the works, referring to the cubist features. This could be completed verbally or with the use of a paper template. Be aware that students are more likely to forget verbal feedback. However, for some students written feedback is often accompanied by feelings of anxiety and nervousness. Scaffold your students into writing constructive feedback (e.g. one positive, one thing that could be improved, another positive). The feedback should always be focussed on the cubist features of the work (i.e. those identified by yourself and the students in activity 2 of this session).
Activity 4
Conclude the session with a gallery walk for the students to appreciate and give feedback on each other’s Picasso portrait artworks.
As a class, recognise those artworks that successfully and strongly show the influence of cubism. Look, in particular for representations from different viewpoints and the use of shapes in the fragmented (or disjointed) forms. Have each student identify improvements they might make to their own artwork.
Session 5
This session is about using self-evaluation and peer feedback to inform a second artwork in the cubist style.
SLO:
- Appreciate and write about their own artwork and that of one other student, recognising the influence of shape and viewpoint (or perspective).
Activity 1
- Begin this session by having students review feedback and self-evaluation, using this to inform their design of their second artwork of the person or pet that is significant to them personally.
- Stop at significant points to review progress, checking against the listed criteria and against their identified intended improvements. As students complete their works, have them self-check and peer evaluate the works.
Activity 2
Upon completion of the second artwork, have each student write a statement about the way in which the work has been created with reference to the cubist features, and whether the final work has captured the character of the special subject (the person or the pet), and if so, how.
Activity 3
- Conclude the session by discussing the ‘geometry’ in their art and in the art of Picasso, referring to the learning in Sessions 1 to 3.
- Discuss how artists like Picasso might represent a triangular prism or square based pyramid as a single two dimensional drawing. Let students choose a solid model and ‘Picasso’ it.
Can you capture the ‘feel’ of the solid as well as it’s appearance?
From this cubist drawing can you tell what solid has been used?
Would you ever see a picture like this in real life?
Calibrating Clocks
In this unit students construct several simple clocks including water clocks and pendulums. They investigate time as measured by these clocks and make comparisons with standard units of time.
Students' experiences with time throughout the learning sequence has two aspects:
duration and telling time.
Telling time must enable them to:
Standard units
When students can measure the duration of events using non-standard units, they are ready to move to the use of standard units. A non-standard unit is one that is personal, such as clapping or saying your name as a unit of time. A standard unit is accepted by a group of people. For example, the second is accepted all round the world as a unit of time. The motivation for moving to this stage often follows from experiences where the students have used different non-standard units for the same event. They can then appreciate that consistency in the units used would allow for the easier and more accurate communication of duration.
Measuring with standard units involves the introduction of minutes, hours and seconds in addition to reading time on analogue and digital clocks.
Duration
The minute is often introduced first because it is small enough to measure common events. The duration of a minute can be established by watching the second hand on a clock or by constructing a minute sand-timer. An appreciation for the size of a minute can be built up through lots of experience in measuring everyday events. For example, how many minutes does the song play for? How long is morning break? How long does it take to walk around the school building? How many times can you hop in a minute? How many linked cubes can you join in a minute?
As the students become familiar with the size of a minute they should be given opportunities to estimate before measuring. Minutes need to be linked to the movement of the minute hand on the analogue clock and the digits on digital displays.
An understanding of the size of a second can be developed by investigating the relationship between seconds and minutes. This can be done by watching the digital displays on some watches, on stopwatches and on digital downloads. The students should be encouraged to develop their own reference for a second, for example, a counting pattern "one – banana – two – banana – three etc".
Reading and telling time
The underlying number skills should be mastered before teaching students the skill of telling and reading time.
The learning opportunities in this unit can be differentiated by providing or removing support to students and by varying the task requirements. Ways to support students include:
The context for this unit can be adapted to suit the interests and experiences of your students. While the focus is on creating “clocks” that measure time, the tasks can be made more engaging by providing a purpose for each clock that connects to the everyday experiences of your students. The clocks could then be used by your students for that purpose. For example:
Giving students the opportunity to suggest their own purposes for the clocks and then adapting the stations so that they can tailor the clocks to those purposes is also likely to increase their engagement in the task. Students might be interested in the historical methods of measuring time used by different cultures. Water, candle and sand clocks date back thousands of years. Astronomical events were used by most cultures to measure long passages of time. Māori used phases of the moon to organise activities such as fishing or harvesting.
Getting started
This session is taken as a whole class activity with students working in groups or pairs to experiment with the time taken for different candles to burn. The teacher retains control of the matches and the burning candles.
Brainstorm with students the different kinds of time keeping devices they know: watches, wall clocks, oven timers, phone timers, etc. Explain that this week they will be making and experimenting with a variety of different ways to measure time.
How did people tell the time before clocks were invented?
Online videos and picture books such as How Do You Know What Time It Is? by Robert Wells and About Time: A First Look at Time and Clocks by Bruce Koscielniak could be used to introduce this context. Students might talk about using the rising and setting of the sun, or the changes in length of day during the year.
How might a candle be used to tell time?
Some students may have heard of candle clocks. Search for videos online about “candle clocks”. You will find a short history about candle clocks that data back to 500 BC.
Discuss how they might express their new knowledge. Students might use a rate to talk about the burn time, such as “1.5 centimetres burn in 5 minutes.”
How accurate was your candle clock?
How could you make your candle clock more accurate?
What are the limitations of a candle clock?
What other devices for measuring time might have come after candle clocks.
Over the next three days have students work at the three stations, rotating groups so all students have a chance to try all three activities. Model all activities to ensure students can complete them successfully. Consider purposefully grouping different students together to encourage tuakana-teina.
Station One: Water Clocks
In this station students make and experiment with water clocks.
Student Instructions (Copymaster 1)
water moves down
estimated time taken
measured time taken
1 mark
2 marks
3 marks
4 marks
What happens if you make the marks further apart?
What happens if you make the marks closer together?
Can you make your clock measure 1 minute accurately?
Can you make your clock measure 5 minutes accurately?
What are the advantages of water clocks?
What are the disadvantages?
Station Two: Sand Timers
In this station students make and experiment with sand clocks similar to egg timers.
Student Instructions (Copymaster 2)
sand moves down
estimated time taken
measured time taken
1 mark
2 marks
3 marks
4 marks
Were the times between the marks the same?
Why / Why not?
How could you make the time between each mark the same?
What happens if you make the marks further apart?
What happens if you make the marks closer together?
Can you make each mark measure the same time period?
Can you make your clock measure 1 minute accurately?
Can you make your clock measure 5 minutes accurately?
Station Three: Pendulums
In this station students make and experiment with pendulums to tell the time.
Student Instructions (Copymaster 3)
number swings
estimated time taken
measured time taken
5
10
15
20
What happens if you make the string longer?
What happens if you make the string shorter?
What happens if you use a heavier weight?
What happens if you use a lighter weight?
Can you make your pendulum measure 1 minute accurately?
Can you make your pendulum measure 5 minutes accurately?
What devices use pendulums to measure time? (Student may have seen a Grandfather clock or used a metronome)
Reflecting - Comparing Clocks
This session is taken as a whole class activity with students working with different timing devices to time the same event. Equivalent times are recorded and compared.
Task
Equivalent measures for time taken
Recite the alphabet
55 seconds
1/2 candle mark
2 water clock marks
3 sand clock marks
20 pendulum swings
Count to 500
2 minutes, 33 seconds
3 1/4 candle marks
6 sand clock marks
52 pendulum swings
What are the advantages of the candle clock (and other devices)?
What are the disadvantages of the candle clock (and other devices)?
Which measure would be the most useful if you wanted to describe to someone in London how long a task took? Why?
How can we measure the duration of daytime? (sunrise to sunset)
Is the duration of daytime consistent throughout the year?
How is the length of a year measured? (365 ¼ days)
How did ancient cultures measure the passing of a year?
You might investigate structures across the world that marked important parts of the year, such as the summer and winter solstices, and equinoxes. Good examples might be Haʻamonga ʻa Maui in Tonga, Stonehenge in England and the sungate to Machu Picchu in Peru.
7. Students might be interested in creating a sundial to measure time during the day with the shadow of a vertical object. Sundials are common in public gardens. You could investigate the history of sundials and other significant time-keeping pieces in your community (e.g. Church bells at the cathedral, a clocktower at the railway station).
Dear family and whānau,
This week at school we are looking at different types of clocks and making clocks of our own using sand, water and pendulums. Ask your child to explain to you how these clocks work.
Your child has been asked to compile a list of all the devices at home that can be used to tell time. They need to bring this list back to school so we can create a class list.
Multiplication and division symbols, expressions and relationships
This unit develops an understanding of multiplication and division, including the inverse relationship between the two operations, and when and how to use them in problem solving situations. Students learn the conventions of how multiplication and division operations are represented as equations.
This sequence of lessons makes the connection between repeated addition and multiplication. It introduces division and explores the relationship between the operations of multiplication and division.
There are three main understandings being developed within these lessons.
In exploring the structure and pattern of multiplication and division, the focus is also on developing an early understanding of number properties. The commutative property of multiplication (i.e. the order in which numnbers are multiplied does not change the answer) is formally explored in these lessons. The distributive property, in which one or both factors are partitioned to make calculations easier, (eg. 12 x 55 = 10 x 55 + 2 x 55), is foundational to calculation strategies, including written algorithms.
In exploring the behaviour of multiplication and division operations, it is important that students make generalisations in which they can state ‘what always happens’ when certain actions are undertaken. For example, they should recognise that whilst the ‘turn around’ rule (commutative) is always true for multiplication, it is not true for division.
This series of lessons focuses on single digit factors and divisors. It recognises that students must have many opportunities to represent multiplication and division. operations for solving word problems. This is underpinned by a strong understanding of using multiplication and division symbols and expressions to think mathematically, and to express relationships. Students also need to be able to create contexts that an equation might express. Making the connections between language and symbols is essential to developing a sound understanding of mathematical ideas and concepts.
The learning opportunities in this unit can be differentiated by providing or removing support to students and by varying the task requirements. Ways to differentiate include:
The context used for this unit are quilts, tivaevae, and tapa cloth. Consider how you can incorporate community knowledge in this context. Are there community members who you could invite in to talk about the cultural background of tivaevae or tapa? In these contexts, it is important to ensure the authenticity, relevancy, and purpose of important cultural knowledge. You may wish to change the contexts to situations more relevant to your students’ everyday lives, interests, or cultural identities. Arrays are common across cultures and can be found in tiling patterns, textiles, packaging arrangements, piles for houses, and playing boards for games. Encourage students to be creative by accepting a variety of strategies from others and asking students to create their own problems for others to solve, in contexts that are meaningful.
Session 1
Activity 1
Develop a context to frame the learning for this unit. This could include making a quilt or tapa cloth (even hypothetically) for the children’s ward at the local hospital or hospice. Consider how you can draw on the knowledge of your students and their community. Could adults bring in tivaevae, siapo, or quilts they have made, or photos of the items?
Engage students in a quilt discussion, establishing how the designs are created.
Record the students’ ideas on the class chart. (These may include number, geometry, measurement statements: for example, 3 + 3 + 3 = 9, 3 x 3 = 9, 9 squares, one big square, sides the same length, 9 divided by 3 etc.). Compare the number of squares in different examples.
In this discussion, emphasise the language used, develop the understanding of what a number operation is (a mathematical process that changes a number or an amount), and review the meaning of the equals sign.
Keep the brainstorm sheets for future reference.
Activity 2
Pose the problem. “Show, using diagrams and equations, how many different ways can you arrange these patches to make a ‘mini patchwork quilt’?”
Have students work in pairs to record their ideas.
For example: From the bag of 18 ‘patches’ (tiles).
In the discussion, build on ideas shared in Activity 1 (above), highlighting and recording in words, these ideas:
Record student justification, highlighting the relationship of equivalence (both are equal to 18, there are 18 patches altogether in both arrays). Highlight multiplicative views such as "9 equals 3 x 3 so 9 + 9 equals 6 x 3".
Activity 3
Write two equations on the class chart, one multiplication and one division.
For example: 6 x 5 = 30 28 ÷ 4 = 7. Read them together.Have each student draw a diagram of a quilt or tapa cloth that represents the equation. Ask them to write a description in words of how the quilt/cloth represents the equation.
Activity 4
Conclude the session by reviewing the operation and relationship symbols and their meanings.
Session 2
Activity 1
For example: We see multiplication when:
Have students pair share their equations. If students have recorded using repeated addition, have them also record multiplication equations.
Activity 2
Ask students to work in pairs using the situations from the previous activity. Students should discuss the situations, and see how many equations, or inequations they can write. For example:
3 x 4 = 4 x 3
3 x 4 < 2 x 10
4 x 6 > 2 x 10 > 4 x 3
They should use diagrams to show how they know that they are correct.
Activity 3
Pose the problem: You are going to make an alphabet quilt/tapa cloth to gift to someone. You have till the end of the session today to plan your design and how you will arrange your 'square patches’. There might be a challenge somewhere in the problem. You decide the best way to solve this for your quilt design.
How many letters are in the alphabet? (26)
Why might making a quilt with 26 squares be a problem?
(26 will only make 1 x 26 or 2 x 13 arrays, which is undesirable for a quilt of this kind. Students will encounter ‘a remainder’ (6 x 4 + 2, 5 x 5 + 1) or they’ll find they are some ‘patches’ short (7 x 4). Accept realistic solutions for the context. (e.g. 5 x 5 quilt: put 2 letters on one patch, 6 x 4 quilt: make it 7 x 4 and include 2 novel or blank patches.)
See what quilts you could make then.
Look for students to find all the possible arrangements:
1 x 36 2 x 18 3 x 12 4 x 9 6 x 6
Which array is the best quilt/tapa cloth? Why?
Session 3
Activity 1
Why was a quilt with five patches in a row not possible?
Record 36 ÷5 = 7 r 1 and ask students what r 1 means (remainder of 1).
Point out that often division problems don’t work out evenly. We call what is left over, a remainder.
Have each student record below their quilt designs, what is in the box above, adjusting the numbers for their own design.
Activity 2
Here are three other numbers that are connected by multiplication and division.
Record a set of multiplication and division equations using these numbers.
4 x 9 = 36 9 x 4 = 36 36 ÷ 4 = 9 36 ÷ 9 = 4
Relate each equation to the 9 x 4 array which students should recognise from the previous quilt design activity. Pay particular attention to division. For example, 36 ÷ 4 = 9 gives the number of rows created from 36 patches (the area) if each row is made from four patches.
4 x 7 = 28 7 x 4 = 28 28 ÷ 4 = 7 28 ÷ 7 = 4
We say that multiplication (and addition) are commutative.
4 x 7 = 7 x 4 = 28
We say that division (and subtraction) are not commutative.
Activity 3
They need playing cards (with numbers 2 to 9), pencil and paper.
The winner is the person who, after ten rounds, has the most pairs of cards with products that are the same, but which are made with different factors.
For example: 6 x 4 = 8 x 3 = 24, or 4 x 4 = 2 x 8 = 16
How to play:
The cards are shuffled and placed face down in a pile between both players.
Players take turns to turn over three cards from the pile. These are the factors. The player returns one card to the bottom of the pile. The player must write the multiplication fact/s for the two cards. They might also draw an array and write the family of facts.
For example:
For example: “There were three bags with five apples in each. Fifteen shared among three bags is five. If these fifteen apples were put into five bags, there would be three in each. That would be five lots of three.”
Session 4
Activity 1
Show an alternative quilt or tapa cloth array (PowerPoint 2). For example:
Have four students record one of each of the related facts.
(6 x 5 = 30, 5 x 6 = 30, 30 ÷ 5 = 6, 30 ÷ 6 = 5) and explain each fact with reference to the quilt, including demonstrating the commutative (turn around) property of multiplication. Turn the quilt to demonstrate this.
Activity 2
Do you think this is all the multiplication facts with a product of 48? (You could arrange the cards by order of the first factor.)
Why are there no 5 x and 7 x facts? (Use the cards. Students should realise that 48 is not in the set of multiples of 5 and 7. 48 is not divisible by 5 and 7).
Use a calculator to show that 48 ÷ 5 = 9.6 and 48 ÷ 7 = 6.857142857…
What do you think the decimal part of the product shows? (A remainder so 48 is not divisible by 5 and 7)
Activity 3
Record 12 ÷ 6 = 2. Have the other student in the pair enact this with the cubes.
Have students describe what has happened and record ideas such as: it’s the opposite, division undid multiplication, it’s the reverse, we’re back where we started.
Ask, Is this always true? How can we find out? Accept student ideas. These should include the students exploring more examples.
(6 x 6 = 30, 5 x 6 = 30, 30 ÷ 5 = 6, 30 ÷ 6 = 5)
Ask students to explain the ‘undoing’ (the inverse relationship again, with reference to the quilt. (This is a little harder to see because this array cannot physically be ‘undone.’ However, you might create rows of six cubes and show 5 x 6 by arranging five rows vertically. How many patches do I have? What happens if I now divide by five?)
Knowing that multiplication and division are inverse operations is helpful because……..
Have students suggest reasons and record these, including:
We can use multiplication to help us solve division problems.
We can check division operations using multiplication. (How?)
Activity 4
Distribute Copymaster 2 for students to work from. Emphasise the inverse operations, and the need for students to show or explain how multiplication helps to solve division problems.
Session 5
Activity 1
Review key learning from Session 4. Have students work in pairs to share their solutions to the quilt problems from Session 4, Activity 4. Encourage them to question each other.
Activity 2
One quilt of sixteen patches:
One quilt of thirty patches:
One quilt of forty-five patches:
If I rearranged the patches into a single row, what would the quilt look like? (More like a long scarf)
One quilt of sixteen patches: 1 x 16 = 16
One quilt of nine patches: 1 x 30 = 30
One quilt of thirty patches: 1 x 45 = 45
If your equations are correct what are the answers to 16 ÷ 1 = ☐ , 30 ÷ 1 = ☐ , 45 ÷ 1 = ☐?
If your equations are correct what are the answers to 16 ÷ 16 = ☐ , 30 ÷ 30 = ☐ , 45 ÷ 45 = ☐?
Do they relate the division to “How many rows of 16 patches make a total of 16 patches, etc?
Activity 3
Have students work in groups of 2 to 4 on Is it a fact? (Copymaster 3 (Purpose: To discriminate between correct and incorrect multiplication and division equations and expressions, and be able to explain why, justifying their decision)
Students take turns to choose a statement and explain to others in the group, if and why the statement is a fact, or if and why it is incorrect (true or false).
Ask students to create their own facts or non-facts that involve multiplication and division, e.g. 8 x 9 = 72 so 72 ÷ 18 = 4. Exchange the facts and non-facts among students.
Activity 4
Conclude this session by reviewing the learning that has happened over the five sessions.
Dear parents and whānau,
In algebra this week we have been learning about the number operations of multiplication and division and the relationship between them.
One way that students consolidate what they have been learning is to read true and false statements and to identify and explain which ones are incorrect and why.
Your child might like to play the "Is it a fact?" game with you. In taking turns, it is really important that each person explains why a statement is true or not.
We hope that you enjoy the challenge.
Thank you.
Try these examples:
1 x 25 = 25 so 25 ÷ 25 = 1 True or False
28 ÷ 4 = 7 so 4 ÷ 28 = 7 True or False
Book 6: Teaching Multiplication and Division
Paint It!
In this unit we measure small quantities of paint accurately to produce our own colour range. We also think about the physics of colour and how our eyes see different colours.
In this unit students read scales and develop an understanding of the size of a millilitre. This is achieved through working with measurements. Students also compare volumes using phrases such as “less than”, "greater than”, and “equal to”.
Associated Achievement Objective
Science, Physical World AO1: Explore, describe, and represent patterns and trends for everyday examples of physical phenomena such as movement, forces, electricity and magnetism, light, sound, waves and heat.
The concepts covered in this unit are outlined more fully in "Seeing Colours, The Spectrum, the Eye and the Brain", number 11 in the Building Science Concepts series.
The main idea covered is that the colours of objects come from their reflection and absorption of different parts of the spectrum of colours in light.
The learning opportunities in this unit can be differentiated by providing or removing support to students, and by varying the task requirements. Ways to support students include:
Tasks can be varied in many ways including:
As an extension, students could be encouraged to research the difference between the RYB and CMYK models of colour mixing.
The contexts for this unit can be adapted to suit the interests and cultural backgrounds of your students. Colours often have cultural significance. For example, whilst green is associated with pounamu in Māori culture, red is associated with birth, coming into being, and Papatūānuku (Earth Mother). Black represents the heavens and white the coming into light. Be sensitive to the cultural significance of colours for students in your class. In Chinese culture, red represents luck and fertility, but in some African cultures it symbolises death. Green is a sacred colour is Islamic cultures. Ask your students what ideas, memories, people, and places they associate with different colours.
Introduction, Session 1
What can you tell me about colour and how we see it?
How is it that we are able to see colour? (light)
Why do colours appear different in different lights?
How can we create colours?
What will you need to record so you are able to reproduce these new colours?
Students might recognise that some record of the comparative amount of each primary colour will be useful. They might decide on a drop as a unit of amount (volume) and discover that 20 drops is approximately equal to 1 millilitre. Some explicit teaching could be done around ratios at this stage. However, keep in mind that ratios are not the key focus of this unit. The big idea of ratios is that they allow us to compare the relative sizes of different quantities (e.g. of paint). If the students use three drops of yellow paint, and one drop of blue paint then the ratio could be written as 3:1 yellow:blue or as 3 yellow:1 blue.
Why do paint shops produce these charts?
If a customer chooses a colour how do the paint people make a whole can of it?
If customers were going to purchase our paints they would need to be the same every time.
How will we achieve this?
What units of measurement will we need to use?
Are all drops the same?
What causes the drops to vary?
How might we be more consistent?
Will all oranges made with this recipe be the same? (Maybe not, but close)
Exploring, Sessions 2-4
Are the colours the same? Why? Why not?
What new colours have we made?
Does it make a difference if the colours we mix are light or dark to start with?
If so, how are the resulting colours affected? (Dark colours have a more pronounced effect on the final colour than light colours)
What colours make up white light?
What colours are reflected when we see a red object?
What colours are absorbed?
What colours are reflected when we see a blue object?
What colours are absorbed?
Have students calculate the formula for larger quantities of paint. For example:
If I wanted to order 2 litres of paint for my kitchen what would the secret formula be?
What if I wanted 6 litres for my dining and living area?
To scale up paint recipes students will need to convert between measures and apply multiplication. For example, Punk Purple is made with a ratio of 2 red : 3 blue : 1 white. How many millilitres of each colour are needed to make a 1 litre pot?
Since 1L = 1000 mL each part will need to be calculated as a fraction. There are 6 mLs per unit ratio, since 2 + 3 + 1 = 6. 2/6 or 1/3 of the mix is red, 3/6 or ½ is blue and 1/6 is while. The amount of each colour is:
1/3 of 1000mL = 333.33mL, ½ of 1000mL = 500mL, 1/6 of 1000mL = 166.67mL
Students could be supported by starting this process with a colour that uses 10mL in its “secret formula”. Because 10mL x 100 = 1000mL, students can multiply the volume of each component colour by 100 to find out how much of each is needed for a 1 litre pot of their colour. Modelling this relationship with place value blocks may be helpful. (it takes 100 tens blocks to match the volume of a large cube).
How much of each colour would be needed for a 4L pot of your colour? 10L?
You may consider providing calculators to ease the cognitive load involved in these calculations.
Reflecting, Session 5
Why is your orange lighter/darker than Awesome Orange?
What do you need to change? Why?
What amounts of paint will you try now?
Dear parents and whānau,
In maths this week the students have been using accurate measures to develop precise formulae for mixing paint to make different colours. They have been both careful and creative. Ask your child what they have learned from their investigation.
Your child has been asked to record the colours used in your living area at home. Please could you discuss with them: Are the colours used light or dark? Did you choose them and if so, what was the reason for your choice? If you didn't choose them, what colours might you prefer and why? Is the room light or dark? Do the colours make a difference to the way the room feels?
Colour is a most fascinating topic. Thank you for your interest.
Getting the right colour involves precise mathematics on the part of the colour mixer!
Dare to compare
This unit encourages students to compare quantities both additively and multiplicatively.
Multiplicative comparison between two quantities is significant to the future success of students, particularly for their understanding of proportions. Consider two quantities, such as five and fifteen. How can the two quantities be compared?
Here are some things that could be said:
The top two statements are additive comparisons that can be made about the difference between 5 and 15. The bottom two statements are multiplicative comparisons that can be made about the scalar between 5 and 15. You can think of the scalar as a multiplier.
Finding the scalar is simple with numbers like 5 and 15 as facts like 3 x 5 = 15 are commonly known. When the numbers are more complex, students need an algorithm to find the scalar. If you ask, “How many times does 5 fit into 15?” you establish that the scalar between 5 and 15 is 3.
You could write the algorithm as 15 ÷ 5 = □ to find □ x 5 = 15.
The scalar between 5 and 15 is a more difficult relationship since it is a fraction. Let’s apply the same algorithm as above. If you ask, “How many times does 15 fit into 5?” you realise that the scalar must be a fraction less than one. Since five is one third of 15, the scalar is one third.
You could write the algorithm as 5 ÷ 15 = □ to find □ x 15 = 5. Note that a common misconception students hold about division is that the divisor is always less than the dividend. In this case the divisor, 15, is greater than the dividend, 5.
The learning opportunities in this unit can be differentiated by providing or removing support to students and by varying the task requirements. Ways to differentiate include:
The context used for this unit involves lengths of tuataras, scores in a top student competition, ages, fish, and price inflation. Using a range of situations helps to engage students and helps them to see application of mathematics to the real world. Vary the contexts to suit the cultures and interests of your students while retaining the mathematical focus of the unit. You might compare improvements in kapa haka scores, changes in points scored in sport, number of whānau members at a marae gathering, or distance of houses from school. Ask students to choose the objects that appeal to them, in comparing 1991 and today’s prices.\
Te reo Māori vocabulary terms such as whakatairite (compare), iti iho (less than), nui ake (greater than) and whakarea (multiply/multiplication) could be introduced in this unit and used throughout other mathematical learning.
Session 1
The context for this session could be altered to focus on animals that have significance in your local area. For example, in Ōtepoti (Dunedin) little blue penguins or albatross may hold more interest for students. The picture book Wildlife of Aotearoa by Gavin Bishop (2019) could be used to ignite students’ interests in this context.
Tuati and Tera are tuatara lizards. They are small reminders of a time when dinosaurs ruled the Earth.
Nowadays scientists measure tuatara to check that they are growing well, as they are an endangered species.
In 2000 Tuati was 10 centimetres long and Tera was 16 centimetres long.
This year Tuati is 30 centimetres long and Tera is 40 centimetres long.
Which tuatara grew the most between 2000 and today, Tuati or Tera?
Some students, possibly most, will use additive comparison. They will find the number of centimetres each tuatara grew in the time. Highlight that they have found the differences between the today and year 2000 lengths. The difference can be found either by ‘adding on’, or subtracting. For example:
I added on from 16 until I got to 40. That was 24 centimetres growth for Tera.
I subtracted 10 from 30 and got 20 centimetres for Tuati.
Finding the difference is a legitimate way to compare the growth of the two tuatara. That will lead to the conclusion that Tera grew more than Tuati. However, a multiplicative comparison leads to another conclusion.
How many times as long is Tuati today than he was in the year 2000?
How many times as long is Tera today than she was in the year 2000?
The term ‘times as long’ needs explanation and representation. Use PowerPoint 1 to illustrate the concept. Tuati is three times as long as he was in 2000, and Tera is two and one half times longer than she was. The comparison of 40 with 16 requires students to recognise 16 as the unit of comparison, and express the eight cubes in the third iteration (repeated copy) as one half of 16. You might record the relationships using equations;
3 x 10 = 30 2½ x 16 = 40
Session 2
Multiplicative comparison sometimes requires a multiplier that is not a whole number. In this session students explore applying a whole number multiplier then extending their understanding to fraction multipliers.
Amy has three kiwis at Orokonui Ecosanctuary. Ben said he saw three times as many. How many kiwis did Ben see?
The korimako laid 2 eggs. The Tuī laid eight times as many. How many eggs did the Tuī lay?
When she was snorkelling, Kayla saw some beautiful spotted black grouper. Mike saw 15 spotted black grouper, , that’s three times as many as Kayla. How many spotted black grouper did Kayla see?
On their bushwalk Sam counted some pupurangi (flax snails). Lia spotted 20 pururangi, that’s two and one half times as many as Sam. How many pururangi did Sam spot?
Note that the last two examples involve an inverse operation. For example, Kayla and Mike’s situation might be recorded as 3 x □ = 15. Look to see if your students understand that the unit of comparison is mapped onto the other quantity a certain number of times. In Kayla and Sam’s situation they need to find a unit that maps into 15 three times.
There are nine species of dolphins that can be found around New Zealand's coast. Fran thinks there are two thirds as many whales. How many whales does Fran think there are?
Ena spotted some Pūkeko during their class trip to the wetlands. Dan spotted 15 Pūkeko, that's one and one half times as many as Ena. How many Pūkeko did Ena spot?
The solution is: Rex is four, Dave is six, Kate is nine, Mum is 36, Dad is 40, Nana is 66 and Pop is 72.
Session 3
In this session students identify the multiplier connecting two quantities. They learn that the multiplier can be found using division and use that knowledge to solve more complex problems than they can solve mentally. Calculators are used to increase the range of numbers accessible to the students.
What equation can you write for this problem?
Some may reverse the order of the factors, i.e. 4 x 3 = 12. In English speaking countries the multiplier is conventionally written as the first factor. Discuss what the 3 and 4 refer to in the equation. Four is the unit of comparison, the known set. Three is the multiplier that tells how many times 4 maps into 12.
Some students may have skip-counted or scanned their four times multiplication facts to find the missing factor. It is possible some students used division, asking themselves “How many times does 4 fit into 12?”
Note that 12 ÷ 4 = □ refers to measurement division (quotative) meaning “How many fours measure 12?” Use calculators to verify that 12 ÷ 4 = gives the multiplier, three.
Look for students to recognise that if 3 x 4 = 12 then 9 x 4 = 36. Also encourage them to use known facts to solve complex problems. For example (Slide 3):
If there were blue fish, what would the ‘times as many’ factor be? (6 x 8 = 48)
How can you use that fact to work out □ x 3 = 48? (Twice as many threes as sixes measure 48)
Since 48 ÷ 6 = 8 the multiplier is eight and 8 x 6 = 48.
Session 4
You may need to explain that inflation is the increase in the price of things, from food to electronic devices to rent on houses. Statistics New Zealand uses a mixture of things to work out how much prices are increasing or decreasing. Be aware that discussions of money, renting/owning houses, and the cost of household items may be a sensitive topic for some of your students. The context to the learning in this session could easily be altered to compare the price of living in New Zealand to the price of living in other countries. Students could work in groups, with each group choosing a country to compare to New Zealand.
How much has the rent increased since 1990?
Are the increases consistent?
Why might some things increase more than others?
Which things increased the most? Which things increased by the least?
Students might notice that the stove and computer cost about the same number of dollars as they did back in 1990. Food items tend to be two to three times dearer, except for bananas that are about the same. Students at Level 3 are just beginning their learning of decimals so encountering numbers like 2.38 is an opportunity to discuss rounding, possibly with the support of a number line.
Dear family and whānau,
This week at school we are learning to solve “times as many” problems. Here is an example:
The problems we will solve will have more difficult numbers than that as we are working at becoming good at multiplication and division.
Perspective on Picasso
In this unit students develop a further understanding of two-dimensional representations of three-dimensional shapes through creating drawings and artworks that explore shapes from different viewpoints.
In level two, students have been learning what is meant by ‘dimension', and coming to understand that three-dimensional shapes, called polyhedra, are bounded by flat (planar) shapes that have two dimensions. At this level, the language associated with the features of 2D and 3D shapes, such as side, vertex (corner), edge, and face, becomes increasingly familiar.
At level three, students are developing greater depth in their understanding of the properties of 2D and 3D shapes, including prisms. Prisms are three dimensional solids with a constant cross-section, and are named after that cross-section. For example, a triangular prism can be cut into parallel cross-sections that are triangles. Other classes of solids, such as pyramids or curved surfaces, have variable cross sections.
As they consolidate their understanding of polyhedra, students recognise that the faces are polygons (bounded planar shapes), and that the properties of those faces contribute to the properties of the polyhedron. Although dynamic computer software enables more helpful representations of three dimensional shapes, the images are still flat, that is in two dimensions. Such flat representations depict limited information about the three dimensional shape they represent. Through representing three dimensional shapes from different perspectives, students learn to focus on different attributes of the shapes, and recognise that representations of the same shape can look very different.
In this unit of work, these understandings combine to inform the student’s appreciation of, at a simple level, some of the features of Picasso’s portraits and his defining art style (cubism). The development of cubism marked a pronounced shift in artists' interpretation of real-world objects. Picasso and Braque attempted to capture the characteristics of three dimensional shapes in a single two-dimensional image.
Associated Achievement Objectives
Art
Visual Arts
The learning opportunities in this unit can be differentiated by providing or removing support to students, and by varying the task requirements. Ways to support students include:
Tasks can be varied in many ways including:
The contexts for this unit can be adapted to suit the interests and cultural backgrounds of your students. Capitalise on the interests of your students. Cubism is one form of artistic representation. Notable Cubist painters from New Zealand include Louise Henderson, Colin McCahon, John Weeks, Wilfred Stanley Wallis, and Melvin Day. However, other forms of art might be more appropriate to the cultural background and interests of your students. Modern art marries traditional aspects of Māori and Polynesian art with modern techniques and media. Look for art that combines the use of two-dimensional and three-dimensional shapes with culturally-relevant imagery (such as those create by Kura Te Waru Rewiri, Paratene Matchitt, Cliff Whiting, Ralph Hotere, and John Bevan Ford). Students may want to study how modern New Zealand artists represent their subjects to convey meaning and feelings. Consider opportunities to engage with local artists in this unit.
Te reo Māori vocabulary terms that could be used in this unit are: tirohanga (perspective, point of view), mata (face of a solid figure), tapa (edge), akitu (vertex), āhua ahu-toru (three-dimensional shape), poro (prism), inerite (isometric). These kupu could be introduced in this unit and used throughout other mathematical learning.
Whilst this unit is presented as a sequence of five sessions, more sessions may be required. Any session may extend beyond one teaching period.
Session 1
This session is about students becoming familiar with the defining features of common three-dimensional shapes and representing these shapes with freehand drawings from different viewpoints.
SLOs:
Activity 1
Draw a diagram of a circle.
Give student pairs 1 minute to write some of the objects that this circle could represent.
Have student pairs share their ideas with the class.
Ask, “Could this (circle) be a drawing of a sphere or a cone or a cylinder?” Have students discuss this and reach agreement that this could be a bird’s eye view of a sphere or a cylinder or a view of a cone looking at it from underneath, (or perhaps from the top if the point were very fine).
Write ‘viewpoint’ on the class chart, agree on a definition that a viewpoint is a perspective of an object from a specific location. Discuss and identify other possible drawings of the three objects. Ask students to be specific about the viewpoint each picture is taken from. For example, a cone appears as a triangle from side on, and a cylinder looks like a rectangle from side on.
Activity 2
Create a chart, writing on it the names of each of the shapes and the headings, faces, edges and vertices. This chart could be created digitally or on paper. It should be created in such a manner that will encourage students to refer back to it throughout the sessions. Define the meaning of each feature of the shapes. For example, a face is a polygon that is part of the boundary of a solid. Model and record the features of at least 2 of the shapes. Note that a sphere is a curved surface and has no faces. A cone also has a curved surface.
Draw on the shape of local buildings in your area in this discussion. For example, the main building of the South Canterbury Museum in Timaru has an interesting shape (an octagonal pyramid on top of another octagonal pyramid on top of an octagonal prism). Does Euler’s formula still apply to this shape? (it has 25 faces, 25 vertices, and 48 edges)
What other composite 3D shapes can you think of?
The Let’s Face It activity could be used to further support students to investigate Euler’s formula.
How many faces meet at an edge? (Two – this is an important generalisation)
How many corners meet at a vertex? (That number depends on the number of faces surrounding each vertex. For a cuboid the number is three)
Why does that happen? (A cube is a type of cuboid)
Activity 3
Have each student choose at least two of the shapes that they have made, and make freehand drawings of each, from at least two different viewpoints. Have students share their drawings with a partner, and have a korero about what they have done, using the language of faces, edges and vertices.
In the follow up discussion ask one student at a time to show just two viewpoints of the same solid.
Can you identify which solid these viewpoints represent?
Do you need more viewpoints or less to make a specific identification? Why?
Activity 4
What shape will the cross sections be? (squares for the pyramid, rectangles for the prism)
Will the cross sections be exactly the same? Students should notice that cross sections of the pyramid vary in size, while the prism has constant cross section.
Alternatively students can make a pyramid and rectangular prism from play dough, plasticine, or cheap vegetables such as potatoes, pumpkin, or carrot (Make a vegetable soup for lunch afterwards). They can make cuts through each shape. Take pictures of their creations to display alongside their explanations of the activity.
Does the property of constant cross section also apply to other types of prism? (Yes)
Activity 5
Conclude the session by having students draw any prism from at least two viewpoints. Ask them to record their work, using the language of faces, edges and vertices, and to write their own definition of a prism.
Is a prism easy to identify by its viewpoints? Why?
Session 2
This session is about exploring cube constructions, representing those constructions from different viewpoints on isometric paper, and interpreting the drawings of others.
SLOs:
Activity 1
Notice that the cube has a leading edge, marked by the central vertical line. The faces that meet at the edges are drawn as rhombi rather than as squares. The top face is also drawn as a rhombus.
The drawing above shows a large cube. Discuss any challenges that arise.
What is the smallest cube you could draw?
Activity 2
Activity 3
Ask students to display their models on a table top, and pass in their isometric drawings. Mix-up the drawings and redistribute them randomly amongst the students. Each student must then locate the model that matches the drawing that they have been given. Confirm their matches.
How do you know that this is the correct model? (Viewpoint matches)
What strategies did you use to locate the model?
Is it possible to have different isometric drawings of the same model? Why?
Is it possible to have several models that match a single drawing? Why?
This discussion helps students appreciate the loss of information about a three dimensional object when it is represented in a two dimensional drawing.
Activity 4
Have students dismantle their shapes into single cubes. Collect in the drawings once more, shuffle these and redistribute them. Have students construct the model shape from another student’s isometric drawing. Rove and support students with the building of their shapes.
Activity 5
Conclude the session by discussing the process, having students talk about the representation of shapes from different viewpoints and highlighting the geometric language, e.g. faces, edges, vertices.
Session 3
This session is about exploring a selection of Picasso portraits, identifying some distinguishing stylistic characteristics. Consider whether a community member or art gallery employee might be able to come to your class to talk about Cubist art, Picasso, and relevant art created by New Zealand, Māori, and Pasifika artists.
SLOs:
Activity 1
I wonder why his style is known as cubism? Note that there is nudity depicted in Picasso’s works. You may wish to gather a selection of age-appropriate art works to show your students, as opposed to letting them freely explore his work online.
Activity 2
What was Picasso trying to represent about his subject?
How did he alter what can really be seen from one viewpoint?
These are likely to include:
Activity 3
What did art look like before that time?
(Some students may know about impressionists such as Van Gogh and Monet who were instrumental in the movement towards conveying feelings about a subject, rather than just capturing a realistic image).
Activity 4
Activity 5
Conclude the session by having students share their work.
Ask each student to bring to the next session a photograph of a whānau member, friend, or pet that they would like to use as the subject of an artwork.
Session 4
This session is about using the style of cubism to create a portrait of Picasso, and begin an artwork of a person or pet significant to the student.
SLOs:
Activity 1
What viewpoints did you imagine?
How did you represent how Picasso would look from each viewpoint?
What geometric shapes did you use? Why?
Activity 2
Activity 3
As students complete their works, have them self-check and peer evaluate the works, referring to the cubist features. This could be completed verbally or with the use of a paper template. Be aware that students are more likely to forget verbal feedback. However, for some students written feedback is often accompanied by feelings of anxiety and nervousness. Scaffold your students into writing constructive feedback (e.g. one positive, one thing that could be improved, another positive). The feedback should always be focussed on the cubist features of the work (i.e. those identified by yourself and the students in activity 2 of this session).
Activity 4
Conclude the session with a gallery walk for the students to appreciate and give feedback on each other’s Picasso portrait artworks.
As a class, recognise those artworks that successfully and strongly show the influence of cubism. Look, in particular for representations from different viewpoints and the use of shapes in the fragmented (or disjointed) forms. Have each student identify improvements they might make to their own artwork.
Session 5
This session is about using self-evaluation and peer feedback to inform a second artwork in the cubist style.
SLO:
Activity 1
Activity 2
Upon completion of the second artwork, have each student write a statement about the way in which the work has been created with reference to the cubist features, and whether the final work has captured the character of the special subject (the person or the pet), and if so, how.
Activity 3
Can you capture the ‘feel’ of the solid as well as it’s appearance?
From this cubist drawing can you tell what solid has been used?
Would you ever see a picture like this in real life?
Dear parents and whānau,
In maths we have been exploring three-dimensional geometric shapes and have been learning to draw these objects from different viewpoints. We have also been learning about Picasso and his style of art, called cubism, and have made some artworks of our own. If you possess extra knowledge of these concepts, then we would love to have you share your expertise with us.