Flip and roll
The unit looks at, analyses, and extends, a game of chance in which three coins are tossed. A player wins if two heads and a tail come up.
- Calculate the theoretical probability of an event by finding all the possible outcomes.
- Use more than one way to find a theoretical probability.
- Check theoretical probabilities using trials.
- Identify what a fair game is and how to make an unfair game fair.
This unit is based on the following five ideas about probability.
- Theoretical probability involves the construction of a model to predict outcomes for situations involving elements of chance. At Level 4, models tend to be systematic ways to find all the possible outcomes, such as lists, tree diagrams, tables, and networks. Expressing theoretical expectations leads to more sophistication of models, including standardised distributions at higher levels.
- Trialling is carrying out an experiment of the situation to see what really occurs. For example, a spinner might be used many times to find which colour is the most likely outcome. With more trials comes greater, but not absolute, confidence that the results reflect the actual chances for outcomes. In real life, most probabilities are estimated by data gathering.
- Predictions are attempts to estimate the outcomes for a given number of trials, and can be made on the basis of theoretical models, or experimental results, or a synthesis of both. For example, a spinner has half its area coloured orange, and trialling shows that orange comes up 12 out of 20 spins. Theoretically an estimate of the results of 100 spins is 1/2 x 100 = 50 outcomes being orange. Using the experimental result, the estimate might be 12/20 x 100 = 60.
- Variation is expected between theoretical probabilities, and experimental results. That variation is most pronounced proportionally when the number of trials is small.
- Fairness means that the chances of outcomes are equal. A coin toss is fair because the chances of heads and tails are equal, at 50%.
The learning opportunities in this unit can be differentiated by providing or removing support to students and by varying the task requirements. Ways to support students include:
- using diagrams and acting out as strategies to represent how all the possible outcomes can be found, in particular, creating arms of a tree diagram through tossing the coins, or rolling dice, helps students recognise that each arm is a specific outcome
- clarifying the language of probability, particularly words like ‘chance’, ‘likelihood’ and more technical terms such as ‘experiment’, ‘trial’, and ‘theory’
- supporting students by modelling efficient ways to record the results of trials
- easing the calculation demands by providing calculators - particularly for converting among fractions, decimals, and percentages.
Tasks can be varied in many ways including:
- reducing the complexity of the situations, e.g. three coin tosses rather than four
- allowing sufficient practical exploration so students develop a sense of how the activity works, and a sense of which events are most likely or least likely.
The context for this unit can be adapted to suit the interests and cultural backgrounds of your students. Most students are captivated by games of chance and are intrigued when their expectations about fairness do not match what occurs. Many different cultures have games of chance which can be found by a quick internet search. Traditionally, Māori people tended to have games of skill, such as poi and rākau, rather than games of chance. However, games such as darts and draughts were enjoyed following early colonisation. Your students might be able to suggest games from their cultural backgrounds and experiences that could be used to make the questions more relevant and engaging. Research might open discussion about gambling, and how people can easily be tricked into a false hope about winning. For example, Lotto is an interesting game where the chances of winning are low, but the lure of the prize is high. This could be linked to persuasive writing learning.
Te reo Māori vocabulary terms such as matapae (prediction), putanga (outcome), whakamātau (trial), tūponotanga tātai (theoretical probability), putanga whakamātau (experimental outcome), tōkeke-kore (unfair), and tōkeke (fair) could be introduced in this unit and used throughout other mathematical learning.
- Sufficient coins so that each pair of students can have four coins (20 cents are preferable).
- Counters
- Calculators
- Blank dice and spirit markers (or normal dice and stickers to change the faces)
- Plastic tops from soft drink bottles
- Access to internet
- PowerPoint 1
- Copymaster 1
Session 1
In this session we look at the probabilities around flipping coins.
- Discuss things that happen at a sports game, like tennis, rugby, netball, or cricket, before play starts. (Slide One of PowerPoint 1). This could be framed within the context of current sports events that are relevant to your students (e.g. the Rugby World Cup). A local referee might be able to come to talk to your class about the coin toss. Students could also conduct research into the history of the coin toss, and other game-starting activities (e.g. a whistle, starting clappers).
Why is a coin tossed? (A whistle might be hidden in one hand and one captain asked to guess as an alternative). - Discuss the advantage that might be gained in winning the toss, especially when playing surface or weather might strongly influence the outcome.
Is tossing a coin a fair way to decide who kicks off, or the way the team face? Why?
Students should conclude that there are two possible outcomes, so a coin toss is fair, unless the coin is biased in some way. - Imagine a game in which you toss the same coin three times, one after the other. You win if you get two heads and one tail, but lose if any other event occurs. (Slide Two)
What events might happen that cause you to lose? (HHH, TTT, TTH)
Does the game seem fair? What does fair mean? (equal chance of winning) - Ask students to investigate the game in two ways:
Play the game a few times, say ten trials of three consecutive tosses. Insist that they record the trial data in a table. You might want to demonstrate data collection:
Win Lose THH, HTH, HHT, … HTT, TTT, TTH, HHH,… - Think about all the outcomes that might happen. Possibly come up with a model to show the chances of winning and losing.
- Gather the class to share ideas.
What did the experimental results show? - Collate the number of wins and losses as a class to show that there seems to be a greater chance of losing the game than winning the game.
Why is the game unfair? (Look for attention to the events that might happen – a theoretical idea) - Show Slide Three.
Do you agree with Brian and Jo? Discuss their ideas with a partner and come up with a justification for your view. - Share ideas about the theoretical probability of each event occurring. Look for models to show that the different events Brian suggests do not have equal probabilities.
- Slide Four builds a tree diagram of possible outcomes with progressive mouse clicks. Let students copy the creation of the diagram in their workbooks.
Act out simulations of three tosses of the same coin and locate the outcome at the appropriate branch of the tree.
Which outcomes are wins?
How can we write the probability of winning using numbers? (Use calculators if needed to convert: 3/8, 0.375, 37.5%) - Return to Slide Three to discuss Brian and Jo’s ideas again.
Distinguish between an event (e.g. Three tails or Two heads and one tail) from an outcome, a way that the event might happen (e.g. HTT, THT, HTT).
What are the chances of getting… three heads? Three tails? Two tails and one head? - Ask students to create a game where they use all four coins all at once.
Create rules that make the game fair. That means you have an equal chance to winning and losing.
Test your game to see that it is fair. - Roam the room as students work. Do they…? The most obvious rule for the game is that three of a kind wins, i.e. three heads and one tail, or three tails and one head. Any other outcome loses, i.e. four heads, four tails, two heads and two tails.
- Recognise that the tossing of four coins simultaneously is essentially the same as tossing a single coin four consecutive times.
- Model all the outcomes in some way, such as a tree diagram or list.
- Test the game a significant number of times to check that the probabilities are equal.
- Slide Five extends the tree diagram to show all the outcomes. There sixteen arms (outcomes), six of which give two heads and two tails. The chances of that event are 6/16 or 3/8 that can be written as 0.375 or 37.5%. Three of a kind events (three heads and one tail or three tails and one head) each have a 4/16 or ¼ chance of occurring. Since ¼ + ¼ = ½ the three of a kind events have a combined probability of ½ or 0.5 or 50%.
- Go online to this Quincunx Simulation or search for a similar one. Most versions allow the user to vary the number of rows to constrain the problems. Set the tool to four rows. Trial 100 marbles. Ask students to explain the results.
How is the situation similar to the four-coin toss problem? - Roam the room as students investigate.
- Do they notice that the marble can bounce in two directions, left and right, in the same way that a single coin toss has two outcomes?
- Do they notice that the middle bin is the most likely of the five destinations? Why?
- Can they relate each destination to the events of the four-coin toss? (e.g., the middle bin is equivalent to two heads and two tails as it is the result of two lefts and two rights)
- Students might investigate the effect of changing the simulation.
What happens if you add a row?
What happens if you change the probability of left and right from 50%?
Why does that happen?
Session 2
In this session, we explore the use of theoretical probabilities to make predictions for different numbers of trials.
- Slide Six presents the problem of predicting the number of females in the first 20 students who leave school.
What information do you need to make a prediction?
Expect students to talk about the number of each gender in the school influencing the probability of boys and girls leaving (e.g. which gender tends to leave first, who gets kept after school, etc.) Be sensitive to the gender identities of students in the class.
If the chances of males and females are 50:50, how many females do you predict?
Are ten females and ten males a likely outcome? - Students may make connections to their previous experiences with coin tosses, and the Dalton Board, to make predictions about variation.
How might we act out this problem? (Simulate the situation)
Students might suggest tossing a coin twenty times using heads for girls and tails for boys. You might return to a Dalton Board simulation with a single row and 20 marbles to see what happens. Most times a sample of 20 students will not yield a 10:10 result (The probability is only about 18%, which is less than one fifth). - Ask students to work in pairs with a coin (or 20 if you have sufficient) to carry out ten trials of 20 individual coin tosses and record their data.
How many tosses will come up heads? Why do you predict that number? - Gather the class.
How often did you get an outcome of 10 heads and 10 tails? (About 1 trial in every six)
How much did your results vary? What was your most unpredictable result? - Slide Six contains the pooled data from 200 trials of 20 individual tosses, in a graph. You might decide to create your own dot plot of the data from your class.
What do you notice about the graph?
Students should observe that the outcomes vary considerably but the distribution centres on the predicted value of 10 heads. - Go online to the Spinner learning object and make a spinner with two equal segments of different colours.
To save time we will use this tool to simulate a lot of coin tossing. Each trial will be 100 individual coin tosses.
What is your best prediction for the number of heads and tails?
Do you expect that the data to look different to the 20 individual coin toss trials? - Use Slide 8 to compare the data from trials of 100 individual coin tosses with that from trials of 20 individual coin tosses.
How are the graphs similar? How are they different?
Students might notice that the graphs both have a ‘bell’ shape and the distributions centre on the predicted values of ten heads and 50 heads, respectively. They might notice that the shape is smoother for the 100 toss data and more evenly spread among the outcomes. It is unlikely they will notice that the variation is proportionally less for the 100 toss data. The spread for the 20 toss data is from 1 to 19. The spread for the 100 toss data is from 35 to 62.
The key point is that experimental data varies a lot from the theoretical predictions. - Introduce the game on Copymaster 1: Coin Drop.
Get a couple of students to try the game, noting the result.
Does the game look fair? How do you know?
How could we work out the chances of winning the game? - Provide pairs of students with a 20-cent coin and a copy of the grid. Ask them to trial the game and make a prediction about the chances of winning with a single coin toss.
- Slide 9 shows 16 coins landing on the grid. Five of the coins land without touching a grid line.
If you trusted this trial, what is the chance that a single coin toss gives you a win?
Look for students to express the experimental probability as a fraction using calculators, 5/16, 0.3125 or 31.25%...
Would you make money playing this game? Explain. - In the animated game the player spends 16 x 20c = $3.20 and gets 5 x 50c = $2.50 back. The return does not look good.
What fraction of the trials did you win? - Gather data from the pairs of students, such as 8/39 (8 out of 39 trials were wins), and 5/18 (5 out of 18 trials were wins). The number of trials being different is helpful.
Are these fractions close to the same or completely different? - You might use a calculator to find the decimal or percentage for each fraction, e.g. 8/39 = 0.205 or 20.5%. Converting the fractions will show that the proportions are around 20-30% with the centre being around 25%.
Our experimental data show that the chance of winning with a single coin drop is about 25%.
With your partner, find a way to work out the chance in a theoretical way.
Analyse the game.
Then change the game in some way so the chance of winning is one half, 50%. - Roam the room to see how students find the theoretical probability. The coin drop game is literally about sample space (area). Look for students to:
- Consider where the coin might land that is considered a win
- Calculate the win area as a fraction of the total area
- Recognise that to make the game fairer, the area of each square (or other shape) must be greater, or a smaller coin must be used on the existing grid
- Slide 10 shows one way to find the probability of winning. Mapping the path of the centre of the coin gives a square shape of the possible winning positions. The win square is one quarter the area of the whole square, so the probability of winning is 1/4, assuming the coin lands randomly.
- Calculating the size of a square grid that makes the probability of winning with a 20-cent coin exactly one half (0.5) is challenging but your students might approximate the grid size closely. Squares that are about 76mm x 76mm will work. Since a 10-cent coin is about the same diameter of a 20-cent coin, reducing the coin size will not work unless you have a supply of old 5-cent coins.
Session 3
In this session, we work on finding probabilities for two other situations, using theoretical and experimental methods. Two Figure It Out activities are used.
- Introduce the normal game, Paper, Scissors, Rock, with a pair of students.
What are the chances that you win the game?
Does it matter which option you choose, paper, scissors, or rock?
How might we create a model of all the outcomes? - Slide 11 shows a tree diagram of all the possible outcomes.
In how many outcomes does Player One win? In how many outcomes does Player Two win?
Both players win for 3 out of 9 outcomes with the other 3 outcomes being draws. Therefore, the game is fair, with both players having a 1/3 chance of winning each time. - Go to the Figure It Out activity, Paper, Scissors, Rock. Either access the Figure It Out books in your school or use the PDF to display the page. Answers are available in the teacher notes.
Let students work on the problems in pairs. Roam the room and look for students to:- Understand the conditions under which each player wins.
- Recognise that a tree diagram is a useful model and builds on the tree diagram of Slide 11.
- Identify which outcomes lead to wins for each player.
- Calculate probabilities for each player winning.
- Trial the game 30 times and match the data with their original model.
- Gather the class to discuss their answers.
What ways did you find to make the game fair?
Giving different numbers of points is one method. Encourage students to look at the probabilities associated with different options. Possible options might be:- One or more Rocks.
- No Scissors
- Two Papers.
For a touch of humour about modifying the game search “Big Bang Theory Paper Scissors Rock” for a video to see an adaptation of the game. Lizard and Spock are added options. High achievers might investigate how the added options make the game fair and less likely to result in a draw.
- Introduce the Figure It Out activity, Picking Pocket Money. Students will need either blank wooden cubes or cubes and stickers to create the dice. They will also need a calculator to carry out the calculations.
- Let students investigate the situation by experiment as suggested on the student page.
- Roam the room and look for the following:
- Systematic recording of the trial outcomes.
- Compare the total amount for the 52 weeks of rolling the dice with the certain outcome of 52 x 5 = $260.
- Factor in the concept of risk into their decision about whether to roll the dice or take the $5 each week.
- Acknowledge that samples vary through comparing the result of their experiment with the results of other groups.
- Gather the class.
Which option is best? Why?
Is there a way to estimate the amount that usually occurs with 52 rolls of the dice?
The data should indicate that most times 52 rolls gives a result of about $260, or a bit less. Possibly display the trial amounts using a dot plot.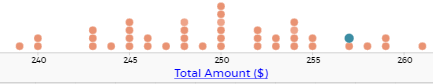
- Model how the average for the dice can be calculated then multiplied by 52 to get an expected value for 52 rolls. (1 + 2 + 4 + 5 + 7 + 10 = 29, 29 ÷ 6 = 4.83) Multiplying 4.83 x 52 = 251.3 so the expected total amount from 52 rolls equals $251.33 which is less than $260. $251 should be about the median of the distribution from trialling.
- Challenge your students with this task:
How might we change the numbers on the dice so the expected amount from 52 rolls equals 52 lots of $5? - Let students work on the problem together in pairs.
The easiest solution is to label all the faces $5.
Challenge yourself. Make the number on each face different.
Any combination of numbers that average five will work, e.g. 1, 2, 3, 7, 8, 9.
Session 4
In this session students investigate the "Top Drop" game.
This is a game for pairs of students. To play the game the players take turns predicting the outcome then dropping a plastic drink bottle top with a smiley face drawn on inside. The first player predicts which way the top will land ‘face up’, ‘face down’ or ‘face side’.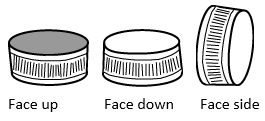
The top must be held on its ‘side’ when it is dropped from a height of approximately 30 cm onto a flat surface.
If the player’s prediction is correct, they are awarded points, as below. If the player is incorrect, they are awarded no points.
- Face up 1 point
- Face Down 2 Points
- Face Side 10 points
Each player must keep track of the outcome of each drop, plus the points awarded.
The first player to be awarded 20 points wins the game.
- Demonstrate the game with a pair of students, showing how to record the outcome of each toss.
- Ask students to play as many games as they can before you stop them.
What is the best strategy to win the game? - At the conclusion of the game playing time, assemble the class.
What did you notice?
Expect students to say that Up occurs more frequently than Down, with Side being unlikely.
Ask: How could we find the probability of each event, Up, Down and Side?
Since the situation cannot be modelled theoretically the only way to estimate the respective probabilities is by experiment. - Ask each student in the class to drop the bottle top ten times and record their results.
Collate the results so you have a sample size of between 200 and 300 tosses. You might use a spreadsheet to sum the frequencies.
The data might look like this (variation will occur from these results):Face Up Face Down Face Side 159 78 13 What do you notice about the samples of ten tosses? (A lot of variation and Face Up most common)
Can we estimate the probabilities of Up, Down, and Side? How?
Percentages or decimals might be used to estimate the probabilities, e.g. 159 + 78 + 13 = 250 (total number of tosses), 159/250 = 0.64 = 64%, 78/250 = 0.31 = 31%, 13/250 = 0.05 = 5%.You might create a pie chart that shows the percentages:
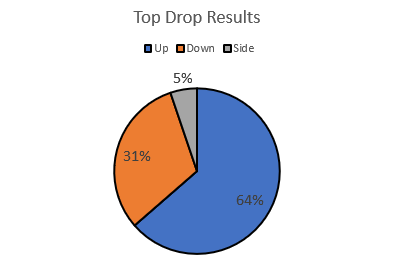
- Discuss: Do these probabilities help work out the best strategy for the Top Drop Game?
Students should say that there is twice as much chance of getting Up as Down. That shows in the points allocated.
Is it worthwhile to predict 'Side', at all?
Side only occurs once in twenty tosses, on average, but a win gives 10 points. A lucky person might get two Sides and win the game. You might investigate approaches to playing the game to see which approach is most ‘winning.’ Ideas might be:
- Always select ‘down’.
- If ‘down’, select ‘Up’ next time. If ‘Up’ select ‘Down’ next time. Always select the opposite to the last outcome. Never select ‘Side’.
- If two outcomes are the same in a row, select the other one (not ‘Side’) e.g., ‘Down’, ‘Down’ then select ‘Up’.
- Drop it with left hand, select ‘Up’; drop it with the right hand, select ‘Down’. Change hands each turn.
- Every 4th one choose ‘Up’, every 10th one choose ‘Side’, otherwise choose ‘Down’.
Students will come up with their own approaches. Look for signs they understand that each toss is an independent event, that is, one toss has no influence over the other. The task might also open up discussion on randomness.
Are the results unpredictable, or is there influence (bias) on what happens?
Session 5
In the final session use a Figure It Out activity, Left to chance to assess students’ understanding of theoretical and experimental probability. Left to chance also involves coin tosses, so students should bring some understanding from the first session.
- Read the student page (PDF available) so students are clear about what is required. Point out that you will not be carrying out a class trial, but each student will be able to carry out their own personal trial.
How will you record the results of the trial?
How will you create a model of the outcomes to find the theoretical probability? - Provide each student with a coin and 16 counters. Slide 12 of PowerPoint 1 can be used to confirm that students understand how the game is played.
- Give students 20-30 minutes to work on the task, recording their results and thinking as they go.
- Use the work samples as evidence of students’ understanding of probability. Important points are:
- Do students record the results of the 16 trials systematically? e.g., In a table or as an organised list.
- Do they notice that the game seems to favour a loss, even though the sample of 16 trials is small?
- Do they address the claims of Simon and Steve in a rational manner?
For example, they might say that four trials are not enough to provide solid evidence (Steve’s assertion). They might analyse the various ways that each destination in the fourth row might be arrived at (Simon’s false claim). To do so, they recognise that an event, e.g., landing on the second from the left ‘lose’ space, can happen through many different outcomes, e.g. HHT, HTH, THH.
Do students systematically find each set of outcomes for different destinations in the fourth row? - Do they calculate theoretical probabilities from the set of all outcomes, using fractions, and possibly decimals and percentages?
P (Three heads) = 1/8 = 0.125 = 12.5% (This means that the probability of HHH equals 1/8)
P (Two heads and one tail) = 3/8 = 0.375 = 37.5%
P (One head and two tails) = 3/8 = 0.375 = 37.5%
P (Three tails) = 1/8 = 0.125 = 12.5%
Combining the two ‘lose’ events gives a probability of 6/8 or 3/4. The game is definitely not fair!
You might use Slide 13 to discuss all the possible outcomes from three-coin tosses, and the number of those outcomes that lead to each ‘win’ and ‘lose’ destination. - Do they extend the pattern they notice in the green game to the blue game?
Students might do this by extending the set of possible outcomes to four coin tosses in a systematic way. See Slide 14. - Do they sum the numbers of outcomes that give a ‘win’ or ‘loss’ in the blue game?
- Do they conclude the blue game is fair?
P (Win) = 8/16 = 1/2 = 0.5 =50%
P (Loss) = 8/16 = 1/2 = 0.5 =50%
Dear parents and whānau,
This week we have been looking at events where chance is in play. We are studying probability using simple games with coins and dice.
Ask your child to tell you about the different outcomes that can occur when you toss two coins and what the chances are of getting each of these outcomes. Ask your child to invent a game that uses three coins. Ask them to explain if the game is fair, or not, and try to find out why this is the case.
You will discover that coin tossing creates lots of interesting discussion. Enjoy investigating probability with your child.