Cubic Conundrums
This unit provides a set of learning tasks that integrate across the strands of the Mathematics and Statistics learning area of the New Zealand Curriculum and provide opportunities for assessment of student achievement across those strands. Each session may involve more than one lesson, especially if students need more time to become proficient at the tasks.
Session One
Use systematic approaches to find all the possible outcomes, e.g. tree diagrams, organised lists.
Session Two
Use tables, graphs, and word rules to represent growing patterns.
Session Three
Draw cube models using plan views.
Session Four
Draw cube models using isometric projections.
Session Five
Find the volume of cuboids given edge lengths.
The mathematics in this unit spans all three strands of the Mathematics and Statistics learning area of the New Zealand Curriculum. Key ideas are:
- Theoretical models of probability require knowledge of all the possible outcomes, or considerable data where those outcomes are not countable. In some ‘controlled’ situations it is possible to list all the outcomes using systematic strategies, like drawing tree diagrams.
- Growing patterns are one way to support the learning of relations, mappings between values for one variable with values of another variable. Attending to spatial structure of patterns can support students to notice those properties of the shapes in the pattern that change and those that stay constant.
- Three-dimensional models exist in the real world. However, most representations of three-dimensional objects are two dimensional (flat). Some information about the real world object is lost in representing it two-dimensionally, while some information is retained. Different ways to represent objects, e.g. plan and isometric views, have nuanced ways to convey information about the object, e.g. square faces show as rhombi in isometric drawings.
- Volume is the amount of space contained in a bounded space, such as a packet or container. Cubes are the conventional unit for measuring volume as they ‘tessellate’ three-dimensionally with no gaps or overlaps. The arrangement of cubes in arrays allows for volume to be calculated by multiplication of edge lengths. However, partial units and curved surfaces require reorganisation of students’ expectations of getting discrete numbers of cubic units as measures of volume.
Specific Teaching Points
- Several systematic strategies can be used to count all the possible outcomes of a ‘controlled’ situation. These strategies include tree diagrams, tables, networks, and organised lists. The full set of possible outcomes can be used to express the probability of a chosen outcome as a fraction or percentage. There are six possible outcomes from rolling a standard dice and three of those outcomes are even numbers. The probability of rolling an even number is measured by 3 out of 6 or ½ or 50% or 0.5. Note that the ‘whole’ (one) is the set of all possible outcomes.
- Growing patterns can be investigated in three different ways:
- Looking for structure in one example of that pattern
- Looking at what changes from term to term as the pattern grows
- Connecting representations of the pattern, to deduce the properties of any term Tables, graphs, and rules or equations are common ways to represent the relationship between variables (quantities that change) that are found in growing patterns.
- Plan views of buildings represent three dimensional objects in flat space (two dimensions). As plan views do not show depth, information from several views must be coordinated to gain a more complete understanding of the structure of the building. Similarly, isometric drawings display some information about depth but features of the building can be masked behind other features.
- Recognition of the array structure that underpins calculation of area and volume is difficult for many students. Experience with filling spaces is vital for students to understand why squares are the conventional unit for area and cubes are the conventional unit for volume. The ‘no gaps or overlaps’ and ‘identical size’ properties of units are important, yet often not obvious to students. Multiplication of side and edge lengths to find area and volume is based on the systematic arrangement of units in arrays.
Observations of students during this unit can be used to inform judgments in relation to the Learning Progression Frameworks. Click for tables of guidelines.
The learning opportunities in this unit can be differentiated by providing or removing support to students and by varying the task requirements. Ways to differentiate include:
- providing opportunities for physical experience with cube models prior to asking for abstract thinking. Ask students to predict what will occur as a model is altered before they change the physical appearance, e.g. What will the fourth model look like?
- starting with challenges that are in the ‘build’ zone first, before giving challenges that make physical building too cumbersome. For example, provide simple cube structure to draw first, moving to more complex structures later
- providing supportive tools for students to represent and manage their ideas, for example, using tables for sequential patterns and satellite views for plan drawings
- using technology to shift student attendance onto more complex thinking, for example experimenting with direct rules in a spreadsheet or considering hidden cubes when making an isometric drawing digitally.
Activities can be adapted to meet the interests and cultures of your students. Where necessary use internet resources to support students to understand contexts. For example, students may not be familiar with apartment complexes, and architectural drawings. Find resources that broaden their world view. Many students will know about puzzles such as the Rubik's Cube or the Soma Cube or have seen pictures of cubic sculptures resting on a single point. Use these contexts to motivate students.
As much as possible, give students the opportunity to be creative mathematicians, for example, create their own cube structure to draw. Foster a climate of problem posing as well as problem solving. Contexts can also be altered, for example a townhouse of two colours might become a tātua, traditional woven belt, and a cube structure might be reframed as the layers of a pyramid, or the contours of a pāe site or igloo. Arrangements of foods for storage, e.g. kumara in pits, might provide a nice context for volume.
Te reo Māori vocabulary terms such as mataono rite (cube), kahaoro (volume) ture (formula), hoahoa rākau (tree diagram) and tirohanga (view) could be introduced in this unit and used throughout other mathematical learning.
- PowerPoint 1
- PowerPoint 2
- PowerPoint 3
- PowerPoint 4
- PowerPoint 5
- Copymaster 1
- Copymaster 2
- Spreadsheet
- 3 dimensional connecting cubes
- Various cardboard packets, e.g. cereal, biscuits, soap, and cartons from the supermarket.
Session One: Two Colour Townhouses
In this session students explore combinations with two or more colours in a probability situation. They link the combinations to powers of two and to possible outcomes.
- Use PowerPoint 1 up to the end of Slide Two to introduce the “Townhouse Problem.” Get a couple of students to make two possible townhouses using cubes of two colours. Two important points are:
- The ground sets a reference in this problem in terms of deciding whether or not two towers are the same. If the earth is considered as a reference these two townhouses are not the same:

- Since colours in a set of blocks are limited, use light and dark colours to create the contrast needed, e.g. black and white, blue and yellow, etc. This will allow more students to use the same set.
- The ground sets a reference in this problem in terms of deciding whether or not two towers are the same. If the earth is considered as a reference these two townhouses are not the same:
- Allow the students plenty of time to investigate the four-storey townhouse problem in small co-operative groups. They will need access to connecting cubes and squared grid paper will support them to record their solutions. Look for the following:
- Are the students systematic in their approach or do they just create solutions without checking for uniqueness? If they are not systematic, ask the question, “How will you know when you have found them all?”
- Do they simplify the task by working through sets of colours? i.e. Divide the search into 4 darks, 3 darks and 1 light, 2 darks and 2 lights, 1 dark and 3 lights, 4 lights.
- Do they look for symmetry to find new combinations? For example, these new townhouses can be found by reflection (or rotation).
- Do they notice structure in solutions? For example, there are only four possible positions for one dark cube so there must be four possible towers with 3 lights and 1 dark. That must also be true of the inverse image of 3 darks and 1 light.
- After a period of investigation, bring the class together to discuss students solutions. Focus on the points above. Listen to the students’ methods first then use Slides 3-6 of the PowerPoint to discuss other possible strategies.
- A “Simpler Problem” strategy reveals there are two possibilities for the one-storey townhouse, four possibilities for the two-storey townhouse, and eight possibilities for the three-storey townhouse.
How many possibilities might we expect for the four-storey townhouse? - Slide 7 shows the data organised in a table. Do the students recognise that powers of two are involved? For example, 8 = 2 x 2 x 2 = 2³.
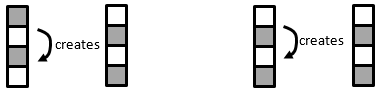
- Slide 8 shows the doubling of possibilities occurs as a new storey of two possible colours is added to the bottom. Each existing possibility has two possibilities for the next storey.
- Can students draw the tree diagram for the four-storey houses so they find all 16 possibilities?
- Can they match arms of the tree diagram to a model made from cubes? Other questions for investigation include:
- How many five-storey townhouses would be possible with two colours of cladding?
- How many three-storey townhouses would be possible with three colours of cladding?
- How many four-storey townhouses would be possible with three colours of cladding?
- Is there a rule to determine the number of possible townhouses with s storeys and c colours?
- Suppose the people who buy the townhouses select their colour scheme by reaching into a bin of cubes, with equal numbers of dark and light. The first colour out is the ground floor, then it is replaced in the bin. The second colour out is the second floor, then it is replaced in the bin, etc.
What are the chances that the buyer will get a townhouse of only one colour? (two out of 16 or one-eighth)
What are the chances that the buyer will get an alternate pattern?, i.e. dark-light-dark-light or light-dark-light-dark. (Also two out of 16 or one-eighth)
What are the chances of the buyer getting two storeys of each colour? (six out of 16 or three eighths)
Students might make up other possible colour options and work out the probability of that option occurring. They might act out the drawing cubes scenario to see what colour schemes they actually get with 16 attempts. Does every possibility come out? Why is this unlikely? High achievers might investigate the connection between the possible townhouses and Pascal’s triangle.
Session Two: Square Doughnuts
In this session students use connecting cubes to create growing patterns and attempt to find general rules for those patterns. They also graph the growing patterns using spreadsheets and look for patterns in the ordered pairs.
- Introduce the cube model using Slide One of PowerPoint 2. Ask the students to work out the number of cubes required. Highlight the importance of structuring the pattern in parts. Invite suggestions about how to count the cubes. Record the suggestions as equations. Slides 2-6 offer some ways to structure the pattern.
- Slide Two: The person sees 4 x 4 + 4 = 20
- Slide Three: The person sees 2 x 6 + 2 x 4 = 20
- Slide Four: The person sees 4 x 5 = 20
- Slide Five: The person sees 4 x 6 – 4 = 20 (Subtract four to allow for overlaps)
- Slide Six: The person sees 6 x 6 – 4 x 4 = 20 or 6² – 4² = 20
- Slide Seven shows three members of the growing pattern. Ask the students to make models of the pattern members using cubes. What changes and what stays constant (the same) as the pattern progresses? Students should notice that the side length is growing by one cube each successive figure to the right. That defines one variable, side length (in number of cubes). Students should make other observations like:
- The hollow square in the centre is also getting bigger. Each side length of the square grows by one cube each time.
- The number of cubes needed to make each model is four more than for the model before it. Why does that happen? (One cube is added to each side of the model).
- Pose this problem to the students:
Imagine someone gave you 96 cubes to build a model in this pattern. How long would the side length of your model be in cubes? - Let the students solve the problem in whatever way they want. Look for the following:
- The choice of some students will be to build the figure. Ask them to think about what they must consider as they make their model larger. They should note that all four sides must be the same length. Can they predict ahead to anticipate the side length of the complete 96-cube model?
- Some students might use tables to organise their data. If their attendance is to the ‘going up by four’ recursive rule encourage them to think ahead without repeatedly adding. Ideally you would like them to find a relation between side length (s) and total number of cubes (c).
- Some students will bring through the structure they used to count the number of cubes in the figure with side length of six. They will imagine what side length might get them close to 96 cubes. For example, a model with 20 cubes on each side has 4 x 19 = 76 cubes in total.
- After a suitable time of exploration, gather the class to discuss their ideas. Try to connect different strategies with questions like:
Why would the sequence going up in fours give you a rule that uses ‘multiply by four’?
Would the problem be easier if you had 400 cubes instead? Why? What would you do to solve it? - The downloadable spreadsheet has two pages; page one contains the start of a table of values for the pattern and page three has a lengthy table to n = 25. Start with page one and ask the students ideas about how to extend the table to solve the problem for 96 cubes.
The problem can be solved by auto-filling. Encourage students to suggest formulas that might be used. One possibility is to put the formula =A5+1 into cell A6 and =B5+4 into cell B6. These are recursive formulas that work out members of the sequence from the one before. Copying down the formulas into columns A and B will continue the pattern. - Encourage the students to look for a relationship across the table between the values in columns A and B. Since the spatial pattern involves four sides, multiplying the A values by 4 is a good start. The final adjustment is to subtract 4 to allow for overlaps. So the formula =A6*4-4 in cell B6 will give the total number of cubes if 7 is entered into A6. This formula can be copied down to complete the table.
- Page two has a completed table and a graph of the relation. Ask the students what patterns they notice in the graph and why the patterns occur. They should notice that the points (ordered pairs) lie on a straight line. This occurs because the rate of change, four more cubes for each extra cube of side length, is constant. The rise is four for every run of one. You might ask students to create their own table and graph for the growing pattern using Excel.
- Use Slides 8-10 of PowerPoint 2 to motivate the students to create their own growth patterns from connecting cubes. They need to build three members of the pattern, preferably consecutive members of the pattern. Next they need to pose a problem for someone else to solve. The problem could be:
- Make the next model in the pattern
- What would be the tenth model in the pattern?
- What model in this pattern would you make with c cubes?
- Create a spreadsheet and graph to predict the number of cubes needed for the 50th member of the pattern.
- If possible use digital cameras to take pictures of the models and use them to publish the students’ problems. If students do publish their problems they need to create a model answer along with useful hints for other students.
Session Three: Spylights
In this session students explore plan views to represent three dimensional models made with cubes. They interpret the plan diagrams and create their own diagrams for others to build from.
- Begin by building a model with cubes in the shape of an apartment block. Place the model on a desk and invite a student to draw what the model looks like from the front. Use an interactive whiteboard or smart television to show a square grid - this will make drawing easier and more consistent. An A3 sized sheet of Copymaster 1 will also work. Invite other students to draw the ‘Bird’s eye’ and left side (relative to the front) views.
- Use PowerPoint 3 to introduce the problem of the three views. Draw students’ attention to these features of the plan views:
- What does each square represent? (A single face of a cube)
- How many cubes across is the building? (Four as shown by both the front view and Satellite image)
- What is the height of the tallest part of the building? (Four cubes high as verified by both the front and left plans)
- How tall is this part of the building (pointing to the front square of the satellite image)? (Two cubes high at it is the only stack of cubes visible on the right of the left image).
- You might want to provide the students copies of Slide 3. Ask them to work in small groups of two or three to build a model that matches the plan views that Simon, the spy, has taken. Look for:
- Are the students systematic, or do they attempt then dismantle their model, and start again at the beginning if it does not work?
- Do they start with one view first, e.g. Satellite image, get that view correct then progressively work on the other two views?
- Do they check all three views to validate that their solution meets all the requirements?
- Do they use recording strategies to record the important information in the problem? For example, using the Satellite image and recording the maximum height of each row and column is useful.
- After a suitable period of problem solving, gather the class to share their strategies. Look for some students to create familiar chunks of the building to work with. They might create towers of heights 1, 2, 3, and 4 to match the heights they see in the front and left views, then move those towers around to match the Satellite image.
- Provide the students with copies of Copymaster 1. Ask them to create three views of a building they create. Restrict the students to 12 cubes so the problems become manageable. After they have drawn their views, students can exchange their three view plans with another student, and ask that student to make their building. Digital cameras can also be used to create model answers of the target solid.
- Another good activity is to leave the buildings intact. Each student then receives a set of plans and must tour the room until they find a model that matches their plans.
Session Four
In this session students learn to represent models made with connecting cubes using isometric dot paper (orthogonal diagrams or projections). Students will need isometric dot paper (Copymaster 2) and connecting cubes. An internet search for "isometric drawing tool" reveals online tools that can be used to experiment with digital isometric drawings.
- Begin with an isometric drawing beginner class using PowerPoint 4. Using mouse clicks on Slide One students can progressively draw some simple cube models. Show them Slide Two and invite them to make the model first then recreate the drawing of it. Students could also draw the building model they created in Session Three.
- After students have attempted drawing discuss some important features of isometric drawing:
- Why is the page described as ‘isometric’? (‘Iso’ means the same, and ‘metric’ means measure. So the dots are all the same distance apart.)
- What shape are the squares faces of a cube when drawn on isometric paper? (Non-square rhombi – four sides of equal length.)
- How do you decide which faces to shade? (Imagine a light source and shaded the opposite faces to that source.)
- Can you always see all the cubes? (No, often parts of a cube or a whole cube are hidden behind others.)
- Slide Three of PowerPoint 4 introduces the pieces that make up The Steinhouse Cube puzzle, invented in 1950 by a mathematician, Hugo Steinhouse. Ask the students to use the photograph to make all six pieces and draw them on isometric paper. Challenge students to solve the puzzle of putting the pieces together to form a 3 x 3 x 3 cube. Students might video their solution for others. Clips of people solving the puzzle are easily found by internet search.
- As a challenge students might like to make up their own cube puzzle, draw the pieces, and an ‘exploded’ solution on isometric paper showing how the pieces connect. If they are unsure what an exploded diagram looks like, ask them to search online for examples. Exploded diagrams are important ways to provide assembly instructions for different products, from flatpack furniture to complex machines. Other isometric drawing challenges can be found in the following Figure It Out activities:
Session Five
In this session students learn to find the volume of a cuboid (rectangular prism) by visualising the arrangement of cubes that will fill it. They also connect multiplication of length, width and depth to the arrangement of cubes.
- Slides 1-5 of PowerPoint 5 introduce the idea of finding the volume of a cardboard packet by filling it with cubes. The issue of part units is also raised as two edges of the packet measure 7cm or the length of 3½ cubes. Provide the students with an assortment of cuboid shaped boxes of varying sizes, e.g. Toothpaste, biscuit, cereal, shoe, etc. Tell the students that you want them to find the volume of each box in connecting cubes. Let the students work in groups of two or three. Expect them to record measures for the volume of each box and how they found that measure. For example, Weightwatchers muesli bar box, 7 cubes high by 2 cubes across = 14 cubes, 8 layers is 8 x 14 = 112 cubes.
- As the students work look for:
- Do the students recognise that the cubes can be arranged in a 3-dimensional array?
- Do the students recognise that a ‘layer’ can be created and mapped into the box as many times as needed to fill it?
- Do the students apply multiplication to find the volume, or do they rely on counting or repeated addition?
- Do they record the measures using both numbers and units?, e.g. 4 x 5 x 3 = 60 cubes.
- How do the students deal with partial units? Do they work with fractions of a cube to get more precision?
- After a suitable period of exploration, bring the class together to discuss the key points above. Slides 6-8 of the PowerPoint show how to work out the volume of a box from edge lengths. It also illustrates that two factors must be multiplied first. The first two factors represent a layer that is iterated (copied) through the box. For each slide, represent the volume calculation with a multiplication equation, i.e. 4 x 3 x 5 = 60 (Slide 6), 5 x 3 x 4 = 60 (Slide 7), and 3 x 4 x 5 = 60 (Slide 8). Ask the students what they notice. The associative property of multiplication means that the pairing of factors does not affect the product.
- You might also look at cubic centimetres (cm³) the standard unit of volume. That is the size of a small place value block. Most likely the students will have measured their boxes using cubes that are 2cm x 2cm x 2cm.
How many cm³ fit into one of the connecting cubes? (2 x 2 x 2 = 8). So if the number of cubes is multiplied by 8 then that gives the volume in cubic centimetres. - If you return to Slides 1-5 the volume of the packet can be worked out more accurately by 20 x 7 x 7 = 980 cm³. This is close to 1 litre which is 1000 cm³.
- Provide additional challenges like:
How many different cuboids can be made with the cubes that have a volume of sixty 2 x 2 x 2 = 8cm³ cubes? Sixty cubes is a good target volume since 60 has many factors. Slides 6-8 give one possible answer of 3 x 4 x 5 = 60 cubes. Uniqueness is an issue. For example, in this investigation 4 x 3 x 5 should be considered as the same cuboid as 3 x 4 x 5.
Do the students approach the task systematically? - Ask: How will you know when you have found all the possibilities?
One approach is to close off the first factor, like this:
1 x Possibilities: 1 x 1 x 60, 1 x 2 x 30, 1 x 3 x 20, 1 x 4 x 15, 1 x 5 x 12, 1 x 6 x 10 (all done – How do you know?
2 x Possibilities: 2 x 2 x 15, 2 x 3 x 10, 2 x 5 x 6 (Why we not include any ones as factors)
3 x Possibilities: 3 x 4 x 5 (All done – How do you know?)
Are there other possibilities? (No. Why not?) - Other target volumes can lead to other discoveries. For example, a prime target volume such as 29 has only one solution 1 x 1 x 29. Why? A target volume that is a power of two will only result in edge lengths that are powers of two, e.g. 64 cubes: 1 x 2 x 32, 2 x 2 x 16, 1 x 8 x 8, etc.
Parents and caregivers
This week our unit of work will be based around connecting cubes. We will explore how many different four storey towers can be made using just two colours, how to generalise sequential patterns made with the cubes, representing models made with the cubes as plans and isometric drawings, and finding the volume of boxes using the cubes as a measure.