Profit or Loss?
This is a level 4 number and algebra activity from the Figure It Out series. It relates to Stage 7 of the Number Framework.
A PDF of the student activity is included.

Click on the image to enlarge it. Click again to close. Download PDF (1276 KB)
use a spreadsheet to calculate costs
find a percentage of a number
This activity relates to Stage 7 of the Number Framework.
FIO, Level 4-4+,Financial Literacy: Young Entrepreneurs, Profit or Loss, pages 19-21
spreadsheet
Financial understanding
The success of any business depends on its ability to earn more money from selling its goods and services than it costs to produce them. If the costs exceed the sales revenue, then the business makes a loss. A continuous loss in the long term means a business is not viable and ceases to trade.
Enterprising people collect, organise, and analyse all the information they need so that they can make informed business decisions. By doing this, Jessica is able to recruit and manage the “right” resources she needs to run the business, which helps her to make sound financial decisions and to plan and organise business activities.
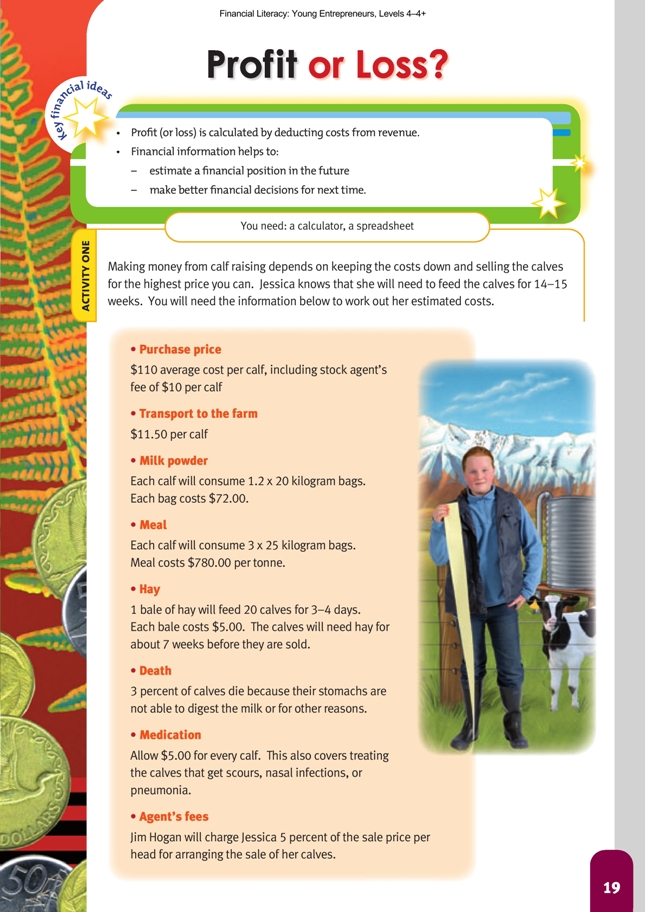
Activity One
Mathematics and statistics
Pages 19–21 require the students to calculate Jessica’s calf-raising costs and compare them to the money she makes by selling the calves for more than she originally paid. If possible, encourage the students to use a computer spreadsheet because this removes the burden of routine calculation and allows them to
focus on the main variables that mean the difference between profit and loss.
A simple way to set up the spreadsheet is to divide it up into two sections, income and expenditure. The income section itemises all the sources of money Jessica has from selling the calves. The expenditure section itemises all of Jessica’s costs. Inserting formulae makes calculation of totals easy, especially if the students use the Copy and Drag or Fill Down function to save re-typing formulae. Students may need
instruction in formatting cells and the syntax of formulae. The Format menu on a spreadsheet file will give the students access to a variety of formatting options, such as formatting figures as numbers, currency, or other styles.
The most useful formulae for Jessica’s spreadsheet are the Sum function and multiplication:
The #VALUE! in the spreadsheet above refers to the fact that the agent’s fees are calculated by a formula using 5 percent (one-twentieth) of the sale price. Because we have yet to work out the sale price, there is a value missing, and so the formula cannot complete its calculation.
On the right-hand side of the expenditure columns, the students should create income columns:
Finally, the students should link the income and expenditure sections of the spreadsheets in two ways, by calculating the agent’s fees and by working out the profit or loss.
Financial understanding
Question 4 asks students to consider how Jessica might improve her profits. Students might consider that the dearest breed of calf, Herefords, are about $100.00 more to buy when young than Friesian– Jerseys, yet return only $100.00 more when sold. Given the extra money required initially to buy the calves, there is no gain for Jessica in buying the more expensive breed. In fact, she is marginally better off buying only Friesian–Jerseys (unless they prove to be the one more prone to die as calves). The
profit per calf is very similar, irrespective of breed, so the only way for Jessica to make more money is to buy and raise more calves. The costs of raising calves are mostly fixed because keeping the calves in good health is essential for ethical reasons and to maximise sale price.
Social Sciences Links
Achievement objectives:
• Understand that events have causes and effects (Social Studies, level 4)
• Understand how producers and consumers exercise their rights and meet their responsibilities (Social Studies, level 4)
Have the students discuss what impacts Jessica’s enterprise could have on environmental sustainability and what she will have to consider to reduce the impacts on her father’s farm (for example, waste removal, intensive use of land resource).
Activity Two
Mathematics and statistics
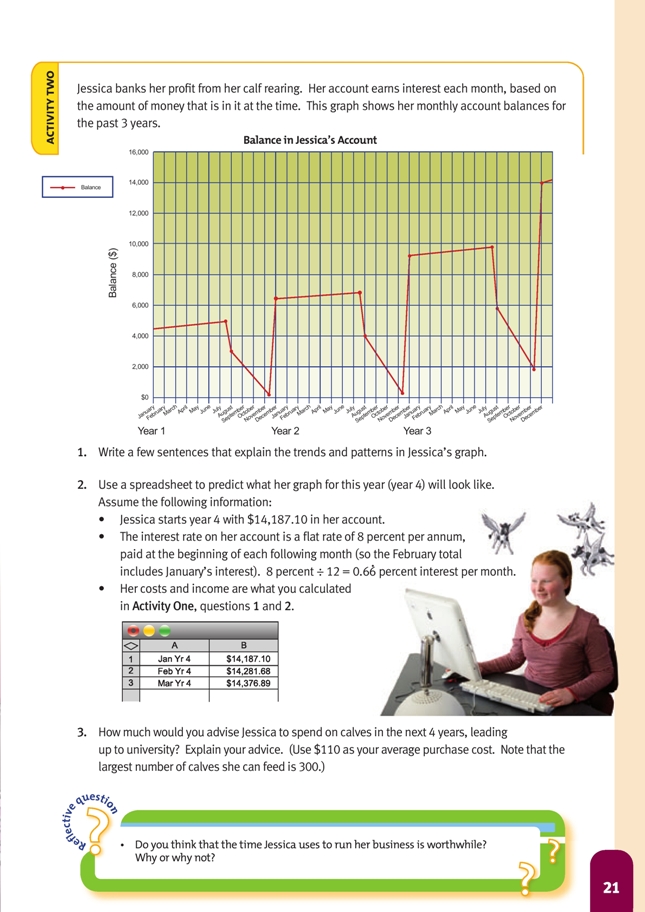
This activity requires students to look for trends in time-series data. In this case, the data contains two variables, time (in months) and balance (in dollars). The trend in the graph on page 21 is seasonal, so one year’s graph is a scaled translation of the previous year. This can be explained by the fact that Jessica does the same thing from year to year (see the explanation and the graph in the Answers).
To model activities such as that in question 2, you have to make assumptions. The students might make their own assumptions and choose their own model. However, if they find this difficult, the model outlined here might help to get them started.
It is not unreasonable to assume that Jessica’s weekly (and hence monthly) costs for feeding and caring for the calves after they are purchased are approximately the same. When the calves are younger, they require milk and possibly medicine; when they are older, they require only meal (and grass) and, later, hay. Jessica buys the calves in mid-July and sells them in early November, a period of approximately 15 weeks. Her total calf-care costs from page 20, question 1, are $7,546 ($4,320 +
$2,808 + $168 + $250), which is approximately $503 per week ($7,546 ÷ 15) or $2,012 per month ($7,546 ÷ 3.75).
So, assumptions the students might make include:
• July will be an expensive month in which Jessica must purchase the calves, pay for transport, and feed them for approximately half of the month. Her outgoings for that month might be something like: purchasing calves ($5,500) + transport ($575) + calf-care ($1,006) = $7,081
• Calf-care costs August–October: $2,012 x 3 = $6,036
• For November, 1 week’s calf-care costs, $503, and agent’s fees, $867, (so she will receive $17,340 – $867 = $16,473)
• At the beginning of each month, Jessica will receive 8% ÷ 12 (0.66%) interest on the balance at the end of the previous month (so the interest she receives in February is based on the January balance).
The spreadsheet and its corresponding graph in the Answers uses these assumptions, along with the designated interest rate.
However, the point is not whether the figures at the end of each month can be exactly calculated but rather that the students have a viable model for what each monthly balance might look like. Encourage them to make their own estimates rather than giving them the figures in the model above.
To model the situation with a spreadsheet, the students will need to reflect these assumptions in their spreadsheet formulae. So for each month, the formula in the cells should take the previous balance and multiply it by 1 + 0.08 ÷ 12 (8 percent divided by 12 months), for example, for February, =B2+B2*0.08/12.
For July, Jessica will earn interest on her June balance but will pay her July expenses (as above). So the formula, assuming the June balance is in B7, would be: =B7+B7*0.08/12–7081.
For the months August to October, Jessica will earn interest on the previous month’s balance but will pay out that month’s share of feed. So the formula, assuming the July balance is in B8, would be of the form: =B8+B8*0.08/12–2012.
For November, Jessica earns interest on her previous month’s balance, pays 1 week’s share of the feed, and earns $16,473 for the sale of the calves (sale price less agent’s fees). So assuming that October’s balance is in B11, the formula would be =B11+B11*0.08/12–503+16473.
In December, Jessica only earns interest on her November balance, so the formula will be =B12+B12*0.08/12.
Based on the information in the model above, the complete spreadsheet for the year is as shown in the Answers for question 2.
Question 3 involves students in making several assumptions about how many calves Jessica will raise. It is unlikely that she will be able to raise 300 calves even if she could afford to buy them in June because this would interfere with her studies. Assuming that she increases her profit by taking on 10 more calves per year, the projected balance in her account (based on an interest rate of 8 percent per annum and an average profit per live calf of $59.40) can be calculated using a spreadsheet in this way:
See the comments in the Answers about death rates and real-time costs.
Social Sciences Links
Achievement objectives:
• Understand that events have causes and effects (Social Studies, level 4)
• Understand how economic decisions impact on people, communities, and nations (Social Studies, level 5)
Have the students discuss:
Jessica is making and will make many economic decisions while she is raising calves. How will these impact on:
– her “free” time and lifestyle now?
– her future?
– the choices she can make both now and in the future?
Answers to Activities
Activity One (page 19)
1. Spreadsheet information will vary, depending on which figures you use (for example, 3 days for each bale of hay, for 7 weeks, as done below) and on your calf prices. An example of table information that could be used in a
spreadsheet is:
(As stated in the students’ book, the purchase cost includes the agent’s fee for buying the calves. You won’t know the agent’s fee for the sale of calves yet. The 48 is
to allow for 3% [2 calves] dying, despite medication.)
2. a. Answers will vary, depending on your answer for question 2d on page 16. For example: Based on Jessica having purchased 30 Friesian– Jersey cross, 10 Friesian, and 10 Hereford–Friesian cross, with the deaths of 2 Friesian–Jersey cross calves, she could get [28 x $330] + [10 x $380] + [10 x $430] = $9,240 + $3,800 + $4,300 = $17,340
b. Based on the example in a, Jim would get 0.05 x $17,340 = $867.
3. The total cost in the example spreadsheet (excluding the agent’s selling fees) in question 1 is $13,621. When the agent’s fee of $867 is added, Jessica’s
expenditure is $14,488. So, based on the predicted sale figures and fees in the 2a–b answers, and including the costs for the 2 dead calves, Jessica will
make $17,340 – $14,488 = $2,852. This equates to $2,852 ÷ 48 = $59.42 per live calf.
4. Answers will vary.
• Changing breeds will probably make little difference to Jessica’s profit, depending on which breed any calves that die are. The extra money she pays to buy the dearer calves is about the same amount as the extra money she receives when she sells those calves.
• Jessica could increase her profit by raising more calves, but she will need more money “up front” to buy them.
• She cannot cut her costs because the calves need to be cared for properly or they will die or be less healthy, which affects the sale price/profit margin.
Activity Two (page 21)
1. The pattern is cyclic, which means that the pattern repeats; in this scenario, the pattern repeats each year. In November each year, Jessica sells the calves
and pays the stock agent his selling fee. The sharp rises are the money she banks from selling the calves. Between November and July each year, the
graph is rising slowly. Jessica has no outgoings (no dips), and her only income is the interest her money is earning while it stays in the bank. The dips are
when Jessica has to spend money on buying calves, feed, and medicine.
2. Answers will vary, depending on how you allocate the costs from July to November (the time in which Jessica has to feed and care for her calves – her outgoings).
See the example spreadsheet and assumptions below.
Assumptions
1. Account earns 8% per annum (0.66% interest each month)
2. Monthly calf-care costs of $2,012 ($7,546 ÷ 3.75; see the notes on page 44.)
3. July = total cost of purchase of calves, plus transport (see page 20, question 1);
1/2 month calf-care costs
4. November = 1 week calf-care; sale of calves – fee (see page 20, question 2)
The graph below, based on the figures in this spreadsheet for year 4, is the graph on page 21 of the students’ book extrapolated out to 4 years.
3. Answers will vary. Jessica wants to earn as much as possible by raising as many calves as possible. Her biggest constraints are how much money she will
have available to buy calves in July each year and how much room and equipment there is on the farm for her to raise the calves (her father raises about 300 calves each year; if Jessica extends her number by 10 each year, that may well be all that the farm and current equipment can handle).
Jessica shouldn’t spend all her November sales money on new calves. She needs to leave enough to pay for feed and medicine, and she will also want to see her base savings grow. To project, using a spreadsheet, you would need to make some very
broad assumptions. For example, assuming that Jessica makes about $59.40 (see page 20, question 3) profit per calf (allowing for 3% death rate) and gets 8% per annum interest on this amount for the 6 months before she needs to buy calves again the following July, the calves cost about $110.00 on average to buy, and she increases her calf numbers by 10 each year, her December figures could look
like this:
Note that, for year 8, the 3% death rate rounds to 3 deaths. Also note that, in real time, interest rates and average profit per calf would vary over time.
Reflective question
Answers will vary. If Jessica does have about $39,126 in her bank account in December of the year before she goes to university (she won’t be using any of it to buy and raise more calves while she is at university), then she will most likely think that the time she put into raising calves was very worthwhile. If she didn’t have that money, she might have to take out a student loan, which would take her quite a few years to pay back once she graduated.
So, on the plus side, she would have money for university without borrowing and she would have learned to manage money. On the minus side, raising the calves might
affect her schoolwork, which could impact on what she is able to study at university, and there is also the trade-off (opportunity cost) of other things she might have had to
give up to look after the calves, such as sport, trips away, and other social events.