Combos
This unit introduces students to combinations as a type of situation that multiplicative thinking can be applied to.
- Use tree diagrams and two-way tables to find all the combinations for a simple pairing situation.
- Use multiplication to count all the possible combinations (and permutations).
- Use models of all the possible outcomes, and experimental results, to compare the chances of different outcomes.
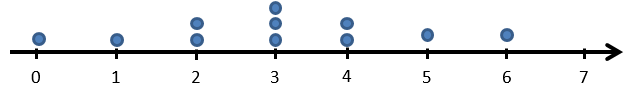
The Cartesian product between two sets is the set of all possible ordered pairs. These pairs contain, one element from the first set (e.g. one t-shirt), and another element from the second set (e.g. one pair of shorts). For example, in this unit students consider the number of different outfits that Lucy can make from a set of 3 pairs of shorts matched with a set of 2 t-shirts:
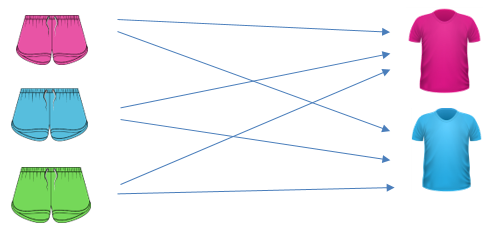
Each arrow represents a possible pairing of shorts and t-shirts, with 6 different combinations possible. The number of combinations possible can also be found by multiplying the number of pairs of shorts by the number of t-shirts: 3 shorts x 2 t-shirts = 6 different combinations.
Cartesian products can also be represented as arrays. Arrays are arrangements of objects in rows and columns, and are fundamental to the measurement of area and volume. Two-way tables are also very important in statistics, logic and algebra. Each of the 6 pairings of t-shirts and shorts above can be represented as a cell in this two-way table:
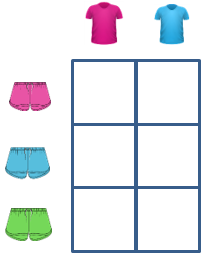
As with the arrow diagram the number of shorts and t-shirts make up the dimensions of the array. The equation, 3 x 2 = 6 represents this.
Finding all the combinations is part of a theoretical approach to probability. Experimenting is also very important. The results of an experiment are seldom an exact match to what might be expected from the theoretical model. Experimental results from selecting one t-shirt and one pair of shorts randomly are likely to vary considerably from the predicted frequencies, especially in the short term.
Observations of students during this unit can be used to inform judgments in relation to the Learning Progression Frameworks. Click for tables of guidelines.
The learning opportunities in this unit can be differentiated by varying the scaffolding provided or simplifying the learning tasks. As a result, learning opportunities can be made accessible to a range of learners. Ways to support students include:
- providing materials which support students to find possible combinations (e.g. different sets of counters). This helps students develop an understanding of the situation before they think about how to systematically identify all the possible outcomes.
- using explicit modelling to demonstrate the drawing of tree diagrams and tables, and of writing systematic lists of outcomes. Possible combinations shown on the diagrams can be linked to specific combinations found with materials.
- simplifying the situations that students are asked to work with by reducing the number of items in the sets that are being combined. For example, removing a pair of shorts or a t-shirt from the items in session one, or reducing the number of choices available at the sandwich bar in session three. Consider how you can integrate basic multiplication facts knowledge that is appropriate to the knowledge of your learners. For example, if your students are working on learning their 4 times-tables, then incorporating 4 sets of items in problems may be useful in supporting your students’ knowledge of the 4 times-tables, and of cartesian products.
- allowing flexibility in the way students find all the outcomes
- using collaborative grouping so students can learn from each other
- incorporating digital tools to draw tables, tree diagrams, and as a way for students to demonstrate their learning.
The context for this unit can be adapted to suit the interests and experiences of your students. While the focus is on identifying combinations, the tasks can be made more engaging by providing sets of items that connect to the everyday experiences of your students. For example:
- use clothing items that are familiar or engaging, possibly t-shirts from favourite sports teams, or school uniform items (sessions one and two).
- use food options that are familiar and appealing (session three).
- use locations that are familiar to the students. This could include reducing the scale of the activity to look at travel around your local area, or within the school grounds (session five).
Te reo Māori vocabulary terms such as whakarea (multiply) and tūponotanga (probability, chance) could be introduced in this unit and used throughout other mathematical learning.
Previous Experience
It is expected that students have an understanding of multiplication, and can solve problems involving equal sets (e.g. 6 jelly beans are split into 3 equal sets, how many jelly beans are in each set?). They should also have some experience in ordering everyday events by likelihood and using words such as “likely”, and “unlikely”, to describe chance
Session One
In this session students learn about systematically organising pairings of objects, to find all the possible combinations. They consider efficient ways to count the number of combinations.
- Play PowerPoint 1, slides 1, 2, and 3 about Lucy going on holiday. The scenario is that Lucy wants to wear a different outfit everyday of her 24 day summer holiday. She has packed 5 different t-shirts and 5 different pairs of shorts. Surely that should be enough!
- Ask the students to explore the different outfits Lucy could make in small groups. They could make Lucy’s coloured t-shirts and shorts using Copymaster 1 and mix and mix and match these to find different combinations, or they could colour the copymaster to record the combinations that they find. Alternatively, they could use the coloured t-shirts and shorts on Copymaster 2.
- After a suitable period of investigation bring the class together to discuss their strategies.
Look for students to show a system for finding combinations, like:
“I started with the pink shorts and matched the different tees one-by-one to it. There are five combinations with that pair of shorts…”
Show students how a strategy like this one can be shown as a tree-diagram (see slide 4 of PowerPoint 1).
What ways can the students find to efficiently count the number of combinations?
They may count in fives, for each grouping in the tree diagram or use repeated addition. Some students may know 5 x 5 = 25. Record each method using symbols, e.g. 5, 10, 15. 20, 25; 5 + 5 + 5 + 5 + 5 = 25; 5 x 5 = 25.
Show students a two-way table as another systematic way to find all combinations. In the case of pairings this is a clear representation.
So Lucy is able to create 5 x 5 = 25 different outfits for her 24 day holiday.
- Pose other scenarios to see if students can work with the tree diagram and two-way table representations.
For example:
If Lucy ripped one of her pairs of shorts and could not wear them, how many outfits could she make? (4 x 5 = 20) Relate this to losing one arm of the tree diagram or a row of the table.
So Lucy goes shopping and buys two new pairs of shorts. How many outfits can she make now? (6 x 5 = 30) Relate this to adding two arms to the tree diagram or two rows to the table.
Lucy buys a red t-shirt on sale. How many outfits can she make?
Combinations can be made more complicated by adding options for shorts and t-shirts or simplified by reducing the options available. - Extend students’ thinking by scaffolding them to make up new problems to share with their peers. You could choose to pair up more knowledgeable students (tuakana) with those who might benefit from more support (teina). Encourage students to make up problems that draw on their cultural backgrounds and recent experiences. In this way, the maths session can reflect the rich diversity and knowledge of your class and support peer sharing and collaborative learning.
Session Two
In this session students explore the relationship between probability and the set of all possible outcomes. Chance is involved if the selection of shorts and t-shirts is random, that is, if each item has an equal chance of being selected.
Part One
- Show PowerPoint 2 about Lucy’s untidy chest of drawers. Since most of her clothes are in the wash she only has two pairs of shorts and two t-shirts to choose from. Point out that the clothes are messed up inside the drawer so Lucy could get any pair of shorts and any t-shirt.
- Ask: What are the chances of her getting both items of the same colour?
- Students discuss the chances of a same colour outfit occurring, in small groups justifying their ideas as they work.
- Bring the class together to share ideas.
Do students recognise that only four (2 x 2) combinations are possible?
Can they list all the possibilities?
Can they organise the possibilities in a diagram, e.g. tree diagram or two-way table? You may wish to model the creation of a tree diagram or two-way table, and scaffold students to create their own tree diagrams as pairs or as individuals.
Part Two
The context of the learning below could be adapted to suit the current events and cultural backgrounds of your learners. For example, instead of focusing the problem around t-shirts and shorts, it could be framed as “Lucy’s kapahaka group wants to buy new uniforms for their upcoming performance. They have the options of three different kākahu (dresses) and three different tīpare (headbands). What are the chances of Lucy picking the same dress and headband?”
- Lucy washes a green pair of shorts and a green t-shirt and adds those items to the drawers. Now she has three different pairs of shorts and three different t-shirts.
- Ask: Have her chances of getting a same colour outfit improved now?
- Ask the students to act out Lucy taking two items to wear. They will need two opaque containers (e.g. plastic icecream containers) and paper copies of the shorts and t-shirts from yesterday. Without looking they reach into the containers one at a time and remove an item. Tell them to record what happened and place the items back in the containers for the next turn.
- Ask each group to carry out nine trials.
- Bring the class together to discuss the findings.
Are your results what you expected? Explain - Collate the results of all groups.
- What do you notice? Students should see that the sample results vary.
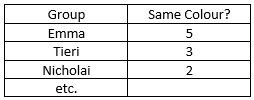
- Put the ‘Same Colour’ frequencies in a dot plot on the whiteboard, like this:
Do students notice that three is the centre of the frequencies? Do they realise that 3 out of 9 equals 1 out of 3, or one-third? - Discuss the number of possible outcomes that can occur with three t-shirts and three pairs of shorts. Add to the two way table or tree diagram from Part One. There are nine possible outcomes.
- Ask: Why would three out of nine be the most common? There is a one third chance of getting a colour match.
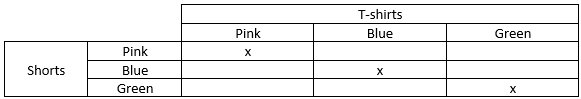
Only three of the nine outcomes are colour matches (marked with x). - If time permits pose other scenarios:
- How can Lucy improve her chances of a colour match?
- Could she ever get a 100% (certain) chance of a colour match? How?
- Could she ever have no chance, zero, of a colour match? How?
- If she had all five t-shirts and all five shorts available, what would be her chances of getting a colour match?
Session Three
In this session students consider combinations in a different context, Build Your Own Sandwich. They move beyond pairings to consider what happens with three or four event combinations.
The context of the learning in this session could be adapted to focus around a relevant school context (e.g. sandwiches available at the school canteen, sandwich fillings at school camp, sandwiches at a local cafe).
- PowerPoint 3 introduces the scenario. The Daily Bread Sandwich bar has an option where you can choose two fillings to go in your sandwich, one from the main selection of meats and one from the extras selection. The options are:
Mains: Ham, Chicken, Beef
Extras: Cheese, Lettuce, Tomato, Avocado, Peppers - Without any discussion, ask the students to work in groups to answer Lucy’s question:
How many different sandwiches can be made with these choices? - Copymaster 3 contains images of the fillings that students might use to find all the sandwiches that are possible. Note that extra fillings are included in the Copymaster for extension. Look for:
- Do the students use a systematic strategy to find all the possibilities?, e.g. organised list, tree diagram, two-way table.
- Do the students use multiplication to count the number of possible sandwiches or do they rely on one by one counting, skip counting or addition?
- Do they consider the impact of changes to the fillings? e.g. Adding another extras topping would increase the number of combinations to 3 x 6 = 18. After a suitable period of investigation, gather the class to discuss the points above.
- Useful extension questions include:
- If Daily Bread wanted more sandwich combinations are they better to add another choice of main or another choice of extras to their menu? (One new main adds 5 new combinations because it can be combined with 5 extras, one new extra adds 3 new combinations because it can be combined with 3 mains).
- Suppose Daily Bread wanted to advertise that you can make 28 different sandwiches. What could they add to their fillings so that is possible? Note that the extra fillings on Copymaster Three make it possible to model the solution to this problem.
- If you were allowed two extras with the main filling instead of one, would that increase the number of possible sandwiches? By how much?
This is a complex problem since duplications need to be avoided, e.g. ham with lettuce and tomato is the same sandwich as ham with tomato and lettuce. The number of possible combinations doubles to 30.
Session Four
In this session students explore a calculator number game called Odds and Evens. The students consider what combinations are possible in the game and, therefore, what is each player’s chance of winning. They then consider how the game is different to a similar game where numbers are not replaced.
- Tell the students that Lucy has a couple of favourite holiday games for times when the weather turns bad, and one of these is the calculator game. Show students how to play the calculator game. You may like to use Video 1 and get two students to demonstrate the game in front of the class.
The calculator game:- Each player has a calculator. One player is designated as “evens” and one player is designated as “odds”.
- Each player enters a number from 1 to 9 into their calculator, without showing the other.
- If the sum of the two numbers is an even number then the “evens” player gets a point, if the sum is an odd number then the “odds” player gets a point.
- Players keep a tally of the scores and play an agreed number of times.
- Students play the game in pairs, at least ten times and record who wins each time. Pairs work together to answer the question: Is the game fair to both players?
Students justify their ideas as they work. Look for students to:- Record the results of their games systematically.
- Use a strategy such as a table or a tree diagram to find all the combinations.
- Knowing all the possible combinations, make decisions about which player, odd or even, has the best chance of winning the game.
- After a suitable time, invite students to share their ideas about the fairness of the game. Some views may be based on experimental results. Players do tend to win about the same number of times. However if you pool the results across the whole class you might find slightly more wins for the even players than the odd players. Expect some students to use systematic ways to find all the possible outcomes, for example “I thought there must be 9 x 9 = 81 possible combinations. It is like the shorts and t-shirts problem.”
Note that if students are listing all possible outcomes rather than drawing an array they need to be aware that the combination of, for example, a 6 and a 5 is not the same as a 5 and a 6. - Look for systems to find all the possible outcomes. A two way table is a tidy strategy, in which the even and odd outcomes can be shaded differently. Use PowerPoint 4 to stimulate discussion.
Seeing patterns in the table helps speed up the shading process, e.g. Every second cell is shaded. Ask the students if there is a quick way to count the number of shaded (even) cells. They might notice that number of shaded cells in each row going down is 5 + 4 + 5 + 4 + …
Can they use properties of multiplication to find the total? (5 x 5 + 4 x 4 = 41) - So how many non-shaded (odd) cells are there?
Students might suggest 81 – 41 = 40, the total number of cells less the even cells. Others might notice the pattern in the number of blank cells going down by row, 4 + 5 + 4 + 5 +… which gives 5 x 4 + 4 x 5 = 40.
So 41 out of 81 possible outcomes are even, and 40 out of 81 are odd. That makes the game close to fair. Do the students recognise that fairness? To realise that 41 out of 81 is very close to 50% requires proportional thinking.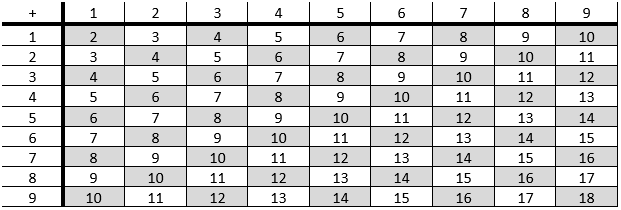
- If time permits, contrast the Odds and Evens calculator game with a variation that Lucy has made up using a pack of cards. Show students how to play the card game. You may like to use Video 2 and get two students to demonstrate the game in front of the class.
The card game:- The game uses 5 playing cards: Ace (which counts as 1), 2, 3, 4 and 5. One player is designated as “evens” and one player is designated as “odds”.
- The cards are shuffled and placed in a pile, face down. Each player takes a card from the pile, and then the two cards are turned over.
- If the sum of the two numbers is an even number then the “evens” player gets a point, if the sum is an odd number then the “odds” player gets a point.
- Players keep a tally of the scores and play an agreed number of times.
- Ask the students to investigate:
- How is the game the same and different to the calculator game?
In the calculator game players choose a number, but in the card game players draw a number randomly. In the calculator game both players can choose the same number in a turn, but in the card game players always have different numbers.
- How is the game the same and different to the calculator game?
- Students can cut up five pieces of paper and label them with digits 1-5. They can act out the game many times. Students may notice that the results tend to favour the odd player.
- Is this game fair or unfair? Why?
The game is unfair because there are 20 possible outcomes, and 12 of them result in an even sum. - How could the game be made fair?
The game could be made fair by changing it so there is an equal chance of either an odd or an even sum. This can be done by have an even number of cards, and by each player having their own set of cards so that it is possible for both players to draw the same number. Your students may find other ways to make the game fair.
- Is this game fair or unfair? Why?
Session Five
This session gives you an opportunity to see if the students can apply multiplication to problems involving combinations, and to apply their knowledge of possible outcomes to think about chance.
The context for this session could be made more culturally relevant to your students by incorporating local or historical places and travel routes.
- Begin by showing the students PowerPoint 5. Lucy’s family travel from Tauranga to Papaioea (Palmerston North), via Taupō. There are four possible routes leading from Tauranga to Taupō and five possible routes from Taupō to Palmerston North. In total there are 4 x 5 = 20 different ways for the family to drive home. Pose the problem from slide 5 and let the students explore it independently using Copymaster 4. Look for them to:
- Identify that multiplication can be used to count the number of different ways.
- Systematically organise the routes using a strategy like a two-way table or tree diagram.
- The second part of the problem explores probability. As seen on slide 6, the family place the Highway numbers, 2, 28, 29 and 33 in a sunhat and randomly select one of those numbers as the route from Tauranga to Taupo. Similarly, they put the Highway numbers, 1, 5, 30, 38, and 43, in the sunhat to select the last leg from Taupo to Palmerston North. Pose the three questions from slide 7:
- What are the chances that the route home will take the family through Taupō? (100% Certain)
- What are the chances that the family will travel through Napier? (2 out of 20 or 1/10)
- What are the chances that the trip from Taupō to Palmerston North will take them by the sea? It is easier to think about which trips are not by the sea at any point. Only the trip down Highway 1 does not touch the coastline. So the chances of a coastal route are four out of five or 4/5.
- If any students are ready for extension ask: How many of the 20 routes from Tauranga to Palmerston North encounter coastline?
Dear parents and whānau,
This week we are studying combinations. We sometimes need to know in how many different ways objects can be paired, or even arranged in threes or other matchings. For example, we might need to do this if we are making up a match schedule for a sporting tournament or to think about the different ways to travel from one place to another.
Sometimes we can use multiplication to calculate the number of pairings for a situation. This can help us to work out the chances of something occurring. This kind of thinking is used to work out the risk of getting a disease, insurance premiums, and the odds of winning Lotto.
At home, you could reinforce this learning by posing questions that involve calculating the cartesian product between two different sets of items (i.e. the total number of pairs of different items that can be created). For example, if Hone has the option of 5 different sandwiches each day, and the option of 3 different pieces of fruit, then the total number of different lunch possibilities for Hone is 15 (5x3).