This is a level 4 number activity from the Figure It Out series. It relates to Stage 7 of the Number Framework.
A PDF of the student activity is included.
Click on the image to enlarge it. Click again to close. Download PDF (347 KB)
convert between fractions, decimals, and percentages
A metre ruler
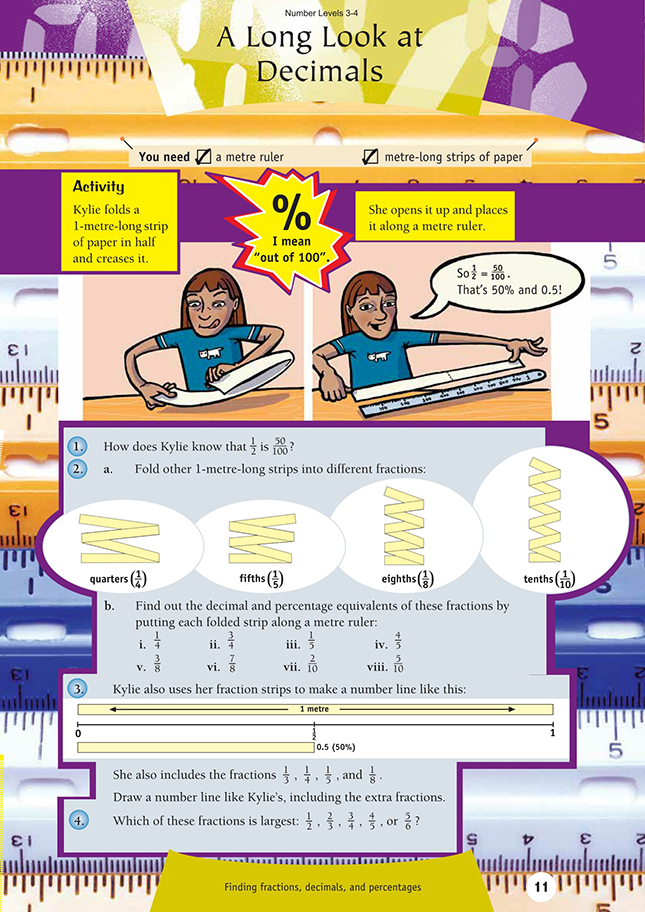
FIO, Level 3-4, Number, Book 1, A Long Look at Decimals
Metre long strips of paper
Although this practical activity is designed to help students to understand the relationship between equivalent fractions, decimals, and percentages, it also provides an opportunity to help them understand what a fraction actually is.
It is important for later work in mathematics that the students understand, for example, that 1/2 is not a complete number in itself. It is, in fact, 1 ( one whole) divided by 2. Similarly, 1/4 is 1 divided by 4, 7/15 is 7 divided by 15, and so on.
From this, you can encourage the students to see “1/4 = 0.25” as “1 ÷ 4 gives an answer of 0.25”. Show them the working out of 1 ÷ 4 = 0.25:
If they use a calculator to get an answer to 1 ÷ 4, they will then be less inclined to see the answer, 0.25, as a “magic” number. The students will have fewer problems in later years if they understand that the line between the numerator and the denominator in a fraction is the division operator (that is, it shows that the numerator is divided by the denominator) and not simply a line separating the top number of a fraction from the bottom.
In the practical activity on this page, the students use a metre (or 100 centimetre) ruler. This reinforces their understanding that percentages are based on 100 or are the number of parts out of 100.
Recurring decimals in percentages (for example, 33.3333%) are generally rounded to the nearest decimal. However, you could discuss with the students fields of study such as science where extra precision may be necessary.
For this activity to work, the students need to fold their paper strips accurately.
The students could use a table to record their answers to 2b. Reinforce their understanding of what a fraction is by getting them to include the division statement for each fraction:
In question 3, the students need to include 1/3. Some of them will know that this is 33.333 centimetres or 0.3333metre or 33.333%, but others will fold a strip of paper to find where the 1/3 mark goes on the number line.
When they have done the above problems, there are several strategies that the students could use toanswer question 4. These include:
• plotting the fractions on the number line (the number furthest to the right on the number line is the largest)
• converting fractions to percentages to find the largest (conversion method: divide the numerator by the denominator and multiply by 100)
• converting fractions with different denominators to fractions with the same denominator (for example, 1/4 = 2/8 and 3/4 = 6/8).
Answers to Activity
1. If Kylie measures the length to her fold mark, it will coincide with the 50 cm mark on the ruler. The full length of the ruler is 100 cm. So one part out of two is the same as 50 parts out of 100.
2. a. Practical activity. Teacher to check
3.
4. 5/6. Two ways of showing how you know this are:
• using the number line you have made. (The one shown here only includes the fractions in the question.)
• converting all the fractions into decimalsor percentages. A table is a good way of
showing this:
Note: Percentages in this table are rounded to the nearest decimal.