Types of Rubbish
This is a level (2+ to 3+) mathematics in science contexts activity from the Figure It Out series.
A PDF of the student activity is included.
Click on the image to enlarge it. Click again to close. Download PDF (1735 KB)
Students will:
- gather, sort, display, and use category and whole-number data and communicate findings based on the data
- use a known relationship (area–mass) to estimate other quantities
- measure volume and mass.
Students should discover that:
- volume and mass are not related (for example, plastic waste is high in volume but low in mass, whereas paper waste is high in both).
classmates
FIO, Sustainability, Levels 2+-3+, Types Of Rubbish, pages 6 - 8
scales
a computer spreadsheet/graphing program
Preparation and points to note
These activities are a good sequel to Is Rubbish a Problem? Because some rubbish sorting is involved, the same hygiene precautions will be necessary.
The students sort the waste into buckets, so 2 variables are being considered: type and volume. A standard bucket or bin can provide an informal unit of volume. Alternatively, the students could use a 2 litre milk bottle to determine the volume in litres of the buckets or bins to be used and then describe the volume of waste in litres. They will need to reach agreement on the extent (if at all) to which the waste should be compacted before measuring.
Students may disagree on how best to classify their rubbish; for example, they may want to sort by soft/hard, wet/dry, or paper/plastic/metal. The categories they decide on must be workable, but they don’t have to match the table shown for Room 4’s rubbish.
The students are required to devise processes, gather data, and work with information that they have found or been given, so these activities lend themselves to a focus on the key competency thinking.
Students may (wrongly) think that volume and mass are related and that objects that take up more space have more mass. Volume does not predict mass; for example, the mass of an albatross with a 3.5 metre wingspan is only about 8 kilograms. Inductive methods involving examples and counter-examples can help students appreciate the complex non-relationship between volume and mass: Which is heavier, a netball or a tennis ball? A tennis ball or a billiards ball? A netball or a bowling ball? A balloon or a tennis ball?
Points of entry: Mathematics
Data gathering is often a messy business. It is in this activity, in more than one sense of the word! Ask: How can rubbish be measured with the resources that you have at your disposal? Should you measure by volume or mass? What units should you use? What categories should you use? How might your choice of categories affect the conclusions you reach? Encourage the students to develop a hypothesis (a theory they want to either prove or disprove) and to follow the steps in the statistical enquiry cycle (see the notes for pages 4–5). Above all, ensure that they reach a conclusion: What is this data telling me? A suitable graph or graphs enables them to share their conclusions with others.
In Activity Two, question 3a, the students are asked to estimate quantities from the pie chart shown, based on the mass provided for waste metal. This is an opportunity to work with them on estimating fractions visually in relation to other sectors of the chart.
The activity introduces some large numbers. Students need concrete examples that can act as frames of reference or benchmarks if they are to make sense of these. This is the role of the bus comparison: all students can visualise a bus (although they have to remember that it is its mass, not its volume, that is of interest here). Perhaps the single most helpful benchmark when it comes to mass is the fact that 1 litre of water weighs 1 kilogram.
Students can create their own benchmarks. They could select a common item of household rubbish (for example, newspapers, advertising fl yers, disposable nappies, or plastic bottles), weigh a representative sample, and estimate how long it would take their household to generate 100 kilograms (or a tonne) of this waste product. Ask How can you refine your estimate?
Points of entry: Science
Find out what your students already know about waste disposal: What happens to waste after it gets put in a bin? Who has been to a landfill? What happens there?
If they don’t already know, get the students to investigate exactly where their rubbish goes and how it is managed. For example: Does the local landfi ll have a comprehensive process for recovering and recycling materials that can be recycled? Is your “local” landfill actually local, or do residents take their waste to a transfer station to be trucked to a landfill far away? Does the landfill charge by volume or mass?
The students should consider the implications of measuring rubbish by mass instead of volume – a common practice. Ask What are the pros and cons of the two methods? If a landfill charges by mass, it is likely to fill more quickly because users are charged the same whether their rubbish takes up lots of space (volume) or not. If a landfill charges by volume, people will try to minimise cost by compacting their waste before dumping it. For example, a bookcase has the same mass whether assembled or disassembled, but taken apart, it occupies much less space so would cost less to dump. In practice, many landfills operate both systems: private vehicles are charged by the carload (more for a station wagon) and/or trailer load, whereas trucks are weighed before and after they dump their load and charged for the difference in mass.
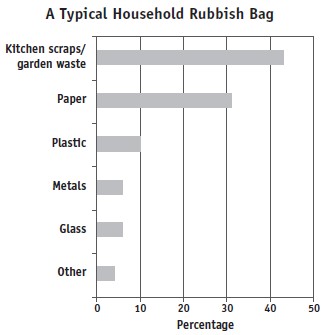
Ask your students to suggest how the make-up of waste nationally will differ from that of their classroom waste and also from that in the typical family rubbish bag or bin (see the illustration on page 5 of the students’ book).
Answers
Activity One
1. a. Practical activity
b. Answers will vary, depending on what is put in the bins that day.
c. Amounts will vary. One day’s rubbish x 5 will provide a reasonable estimate for 1 week. A table or bar graph should be suitable for presenting the data.
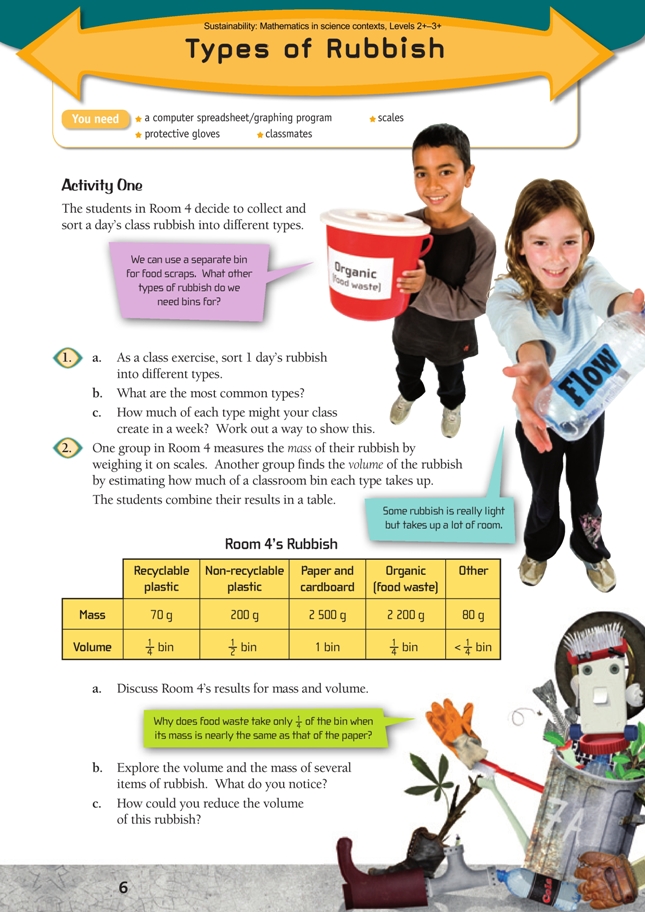
2. a. Discussion will vary. Plastic is light (mass), but some of it takes up a lot of space (volume); paper and cardboard occupy less space than plastic bottles but weigh more; food scraps compress well but can be heavy.
b. Observations will vary but will probably be similar to those for a.
c. The rubbish could be compressed in a compactor. Plastic bottles could be squashed and cardboard cartons flattened. Sheets of paper take up less volume if they are stacked flat instead of screwed up.
Activity Two
1. a. Landfills (which used to be called rubbish dumps or tips) are places set aside for the disposal of solid (non-hazardous) waste. The most common method of disposal is to spread the rubbish and compact it and then cover it with a layer of earth. Some landfills also accept hazardous waste, which
is disposed of safely, as well as whiteware, glass, paper, and so on for recycling.
b. The people who run landfills are more likely to be concerned with volume (space) than mass, but most landfi lls charge by mass because it is easier to measure. Heavy items such as cars can be compressed to take less space, as can most plastics, but polystyrene, although light, is very bulky. Vehicle tyres are big and heavy. Shredding reduces their volume. Unshredded tyres can be a problem; they have a way of making their way to the surface.
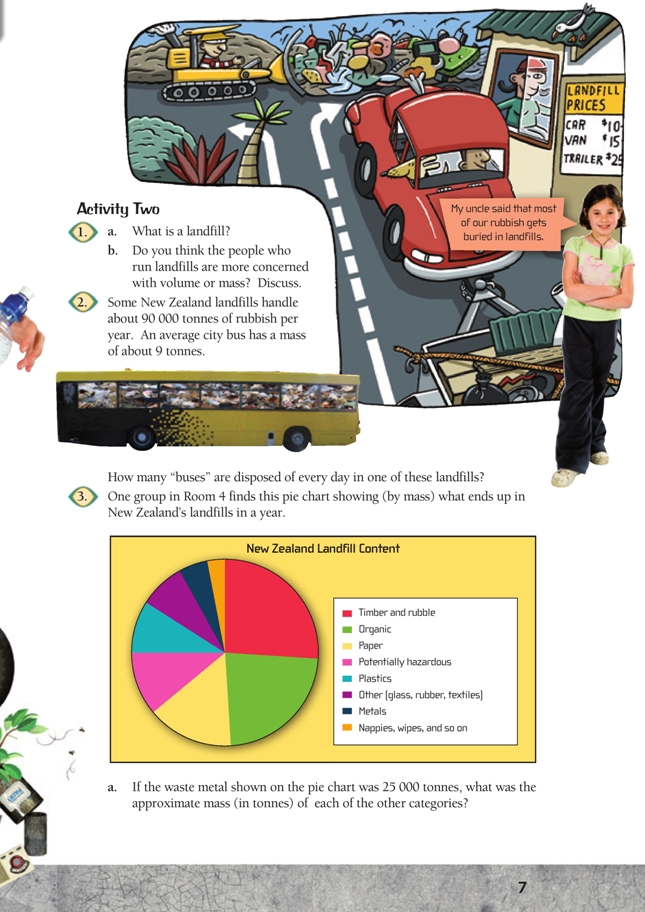
2. About 27. (90 000 ÷ 9 ÷ 365)
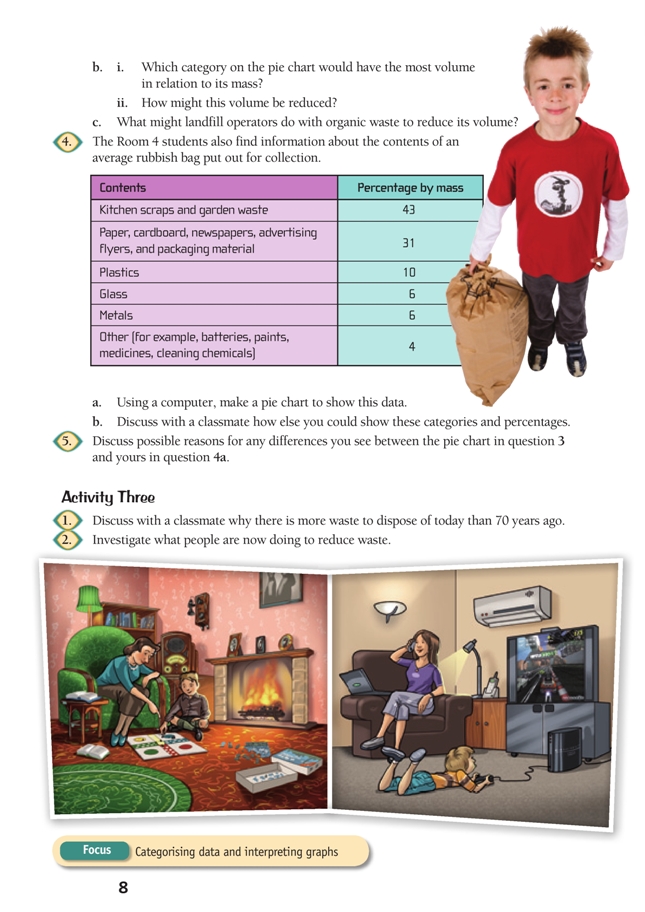
3. a. Estimates will vary depending on the method used. They should be to the nearest 5 000 or 10 000 (greater precision is not possible). Suggested estimates are:
| Type of waste | Tonnes (estimate) |
| Timber and rubble | 130 000 |
| Organic | 115 000 |
| Paper | 75 000 |
| Potentially hazardous | 55 000 |
| Plastics | 45 000 |
| Other (glass/rubber/textiles) | 40 000 |
| Metals | 25 000 |
| Nappies, wipes, and so on | 15 000 |
b. i. Plastics, because they are very light (see Activity One)
ii. Compacting has little effect on most plastics. The best options for reducing the volume of plastics in landfills are to reduce consumption and increase recycling. Burning plastic releases toxins into the air.
c. Much of this waste could be stored separately and composted. Some landfills already do this on a large scale. Material such as tree branches is shredded as a first step.
4. a. A possible computer-created pie chart is:
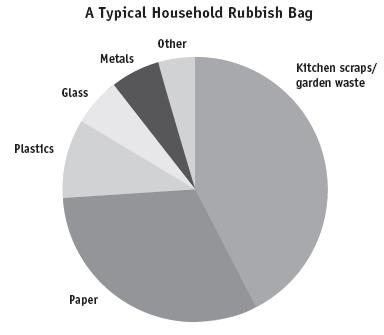
b. You could use a bar graph, or any other representation that shows relative proportions, for example:
5. Landfills receive industrial as well as household rubbish, so they will always have a higher percentage of materials such as metals, timber, and rubble. Households tend to accumulate a lot of paper (for example, from newspapers and advertising). Households without compost bins tend to have a lot of organic waste.
Activity Three
1. Discussion will vary. 70 years ago, most people had far fewer possessions than we do today (and had them mended when they broke), made many of their own clothes (and mended them when necessary), had large vegetable gardens, bought locally produced meat that was not pre-packaged, bought milk and drinks in glass bottles that were recycled, ate mostly home-cooked meals, often did not have cars, and had no electronic products at all. Think of the packaging that comes with most of the items we buy today – all that plastic and polystyrene! Most everyday plastics only came into use in the 1950s and 1960s.
Today, we have many “consumer products” that become outdated very quickly. We often replace hem even if they are working well. If they break down, it is cheaper to get a new one than to get the current one fixed. (You could do some research on when computers and other items such as video games, televisions, and cellphones were invented or became commonly used and how long they are expected to last. You could also fi nd out how far some of the food we eat travels to get to our supermarkets – this affects the amount and kind of packaging needed.)
2. Answers will vary, but they should cover “the 5Rs” (see page 1 of the students’ book).