Dinner Time Ads
This is a level 3 statistics activity from the Figure It Out series.
A PDF of the student activity is included.
Click on the image to enlarge it. Click again to close. Download PDF (1213 KB)
construct a tally chart
construct a bar graph
describe the features of a data set
write investigative questions
This diagram shows the areas of Statistics involved in this activity.

The bottom half of the diagram represents the 5 stages of the PPDAC (Problem, Plan, Data, Analysis, Conclusion) statistics investigation cycle.
Statistical Ideas
Dinner Time Ads involves the following statistical ideas: using the PPDAC cycle,
investigative questions, category data, tally charts, and graphs.
A computer spreadsheet/graphing program (optional)
FIO, Levels 3+ -4, Statistics in the Media, Dinner Time Ads, page 1
Access to evening television
A classmate
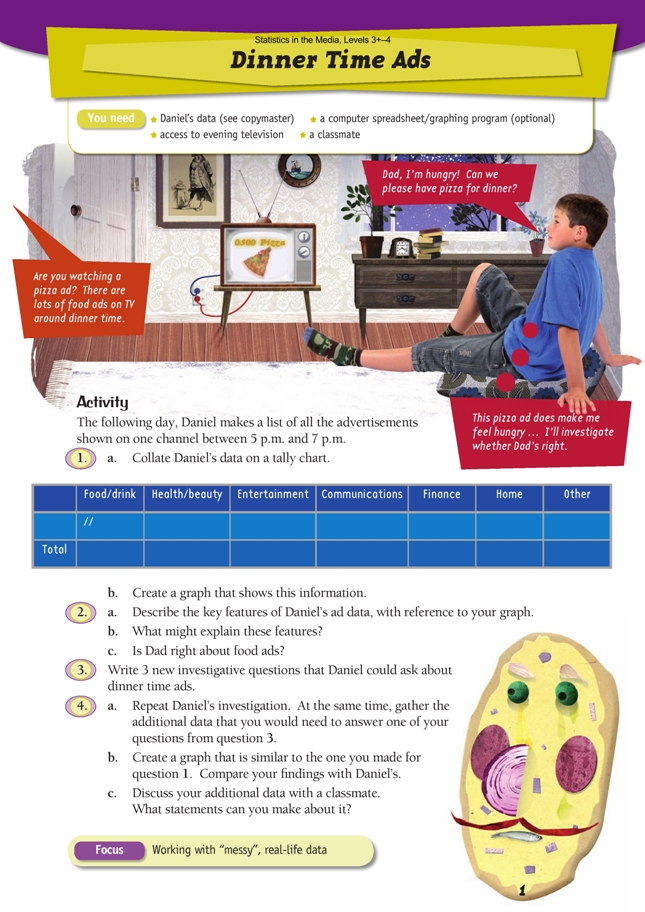
In this activity, a young boy asks himself an “I wonder” question, which he then follows up with a statistical investigation. It is important that students come to view statistics as a means of investigating and answering questions about their world.
Real data is not neat and tidy; it can be diffi cult to classify. For example, is a television service “entertainment” or “communications”? (We have provided broad categories on the student page, but you might want your students to think of their own.) Encourage your students to discuss how they classifi ed the ads (within the categories provided or their own). They should understand that, in some cases, either of two possible categories is fi ne; there is no one “right” answer. What does matter is that the students are consistent in their categorisation: the pizza ad can’t be classifi ed as food in one spot and home in another. If too many ads end up in the
“other” category, the students should reconsider how they are doing their classifying or add one or more new categories. A large amount of data in the “other” category undermines any conclusions and suggests that not enough thought went into defi ning suitable categories.
It is good statistical practice to use fi ndings as the basis for further questions (this is why the PPDAC is a cycle). For example, in this case, the students may wonder if food ads are always so prominent at this time of the day, how frequent they are at other times, or if the day of the week infl uences the types of ads shown. Investigative questions are concerned with patterns (what is typical) rather than single statistics (for example, which is longest/tallest).
Daniel collects data only from 1 day on 1 channel, and from this data, he attempts to generalise about all dinner-time advertising on TV. Discuss with your students whether a generalisation is possible from this data. A useful class exercise would be to have students gather data for different days and different channels. In this way, a much larger sample can be obtained, one that will more accurately refl ect reality. Make full use of the PPDAC cycle in planning this investigation. Challenge the students to find ways of minimising differences due to categorisation
and data-gathering methods. A common framework will ensure that the data gathered by different students can easily be combined.
When students collect their data for question 4, they should ensure that they do so with the additional data in mind. Follow up the students’ presentations of fi ndings by having them discuss and evaluate the effectiveness of the various data displays.
Extension
Advertising (in any medium) offers great potential for statistical investigations. Students could design and conduct a further investigation, this time trying to answer a question that is of personal interest. It could relate, for example, to the kinds of ads that are shown at different times of the day, the lengths of ads, the emotions that ads play on, the relationship between programmes and products, or the advertising of a single product or service.
Answers to Activity
1. a.–b. Answers will vary depending on how you classify some of the ads. Here is one possible tally chart and the graph based on it:
2. a. Descriptions will vary. There were 60 ads screened between 5 p.m. and 7 p.m. The largest category is food/drink, followed by health/beauty. (In the analysis above, the “other” category included fund-raising, holidays, and the shopping mall.)
b. Near dinner time, people are hungry, so they may be easily infl uenced by food and drink ads. The health and beauty ads may attract attention because often viewers are weary at this time; the thought of having greater vitality and energy and easy ways to look and feel good may appeal. The other categories are limited by the number
of spots available, but some viewers will still take note of them.
c. Yes, Dad is right. This data suggests that food-related ads are more common than
other types of ads around dinner time. (However, although your analysis may
show that 25–30% of the ads are food/ drink ads, this is not “most”, and we also
can’t tell from Daniel’s data how common food ads are at other times or on other
channels.)
3. Questions will vary. For example, for food/drink ads, Daniel might ask: What types of food or drink are typically advertised between 5 and 7 p.m.? What age group is most often targeted in these ads? Is there any pattern to the “repeats”?
4. a.–c. Graphs and fi ndings will vary. Your investigation data may be similar to
Daniel’s. Extra investigative questions and data to answer them will vary. For
example, additional information might include how many times particular ads are
repeated during the 2 hours, types of food ad (for example, fast food), or age groups
targeted by the ads. It would also be possible to classify ads according to style
of presentation (for example, animated, talking head, skit, product demonstration).
Key Competencies
• thinking: investigating, making decisions, designing investigations
• using language, symbols, and texts: communicating findings
• managing self: working independently, seeking understanding.