Crossing the Line
This is a level 3 and 4 statistics activity from the Figure It Out series.
A PDF of the student activity is included.
Click on the image to enlarge it. Click again to close. Download PDF (1194 KB)
compare results of experimental probabilities with other people
write the probability as a fraction
This diagram shows the areas of Statistics involved in this activity.
The bottom half of the diagram represents the 5 stages of the PPDAC (Problem, Plan, Data, Analysis, Conclusion) statistics investigation cycle.
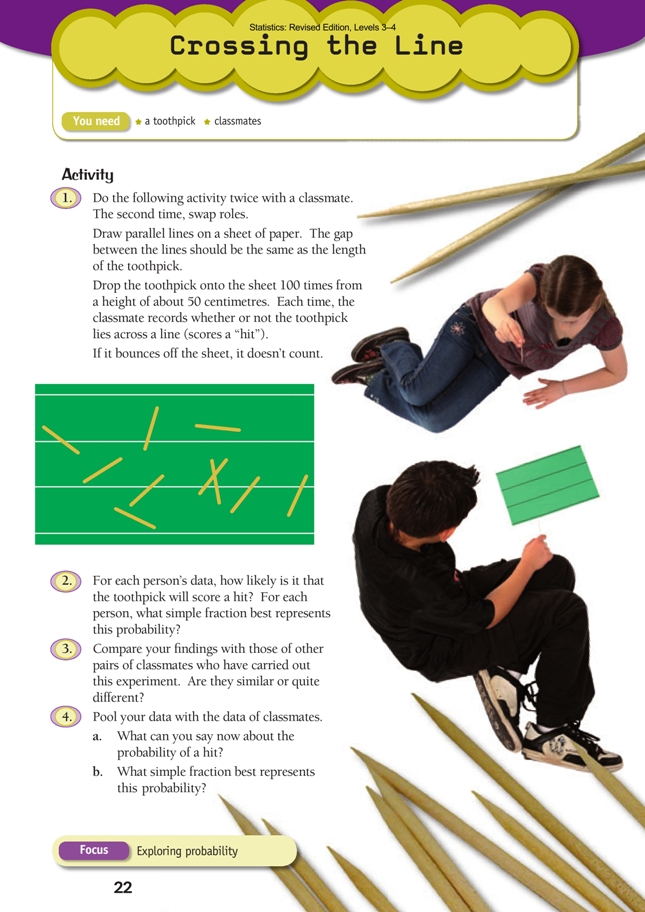
FIO, Levels 3-4, Statistics Revised Edition, Crossing the Line, page 22
Classmates
This page involves a probability experiment. Unlike coin-tossing or dice-throwing
experiments, the probabilities can’t be deduced or calculated by simple reasoning.
Before beginning, it would be useful to have a class discussion about the process and the outcomes that might be expected because many students will not have done anything like this before. It could be a good idea to conduct a pre-experiment to establish the best height for dropping the toothpick. This will be a height that allows the toothpick to hit the paper in a random fashion without frequently skittering off the edge of the sheet of paper. If it proves diffi cult to fi nd such a height, use an A3 rather than an A4 sheet of paper. The size of the sheet is immaterial; what matters is that it is carefully ruled up with parallel lines one toothpick length apart. While the height of the drop should be fairly consistent, consistency is not of critical
importance.
Questions 2–4 all involve assigning a simple fraction to experimental results. Some students may be very uncertain as to how they should do this, in which case the process should be discussed and modelled.
Here is one way of doing this:
• Brainstorm which fractions might be included under the term “simple fraction” (1/2, thirds, quarters, fifths, and tenths). Write these on the board.
• Noting that each experiment involves 100 trials, put up a range of “out of 100” fractions on the board (for example, 26/100, 71/100, 67/100).
• In pairs and then as a class, decide which simple fraction best represents each of the “out of 100” fractions on the board.
This experiment, known as Buffon’s Needle, was fi rst devised in the 18th century by Georges- Louis Leclerc, Comte de Buffon. It has attracted a surprising amount of mathematical interest.
There are a number of very good computer-generated simulations available on the Internet (type Buffon’s Needle into your browser). Statistically and mathematically, it has been shown that the probability of a “hit” is close to 2/3.
Answers to Activity
1. Practical activity. Results will vary.
2. Answers will vary.
3. There will most likely be considerable variation in results.
4. a.–b. If enough results are pooled, you should find that about twice as many of the
toothpicks fall across a line as between the lines. This means that the probability
of scoring a “hit” is about 2/3.
Key Competencies
Crossing the Line can be used to develop these key competencies:
• thinking
• participating and contributing.