The Numbers Don’t Lie
The purpose of this unit is for students to learn and apply ideas about 'sample' to population statistics. This is done alongside the collection of data during physical education (PE) lessons.
- Demonstrate understanding of control variables.
- Develop investigative questions.
- Organise data using a spreadsheet.
- Use technology (CODAP) to process data and produce graphs.
- Produce dot plots and box and whisker plots
- Analyse dot plots and box and whisker plots.
- Understand and use the “median outside the overlap” rule of thumb.
- Write a report that answers a comparison investigative question.
This unit uses many of the same ideas as the Level 4 unit Crunch the Coach.
The overall aim is for students to make a judgement about whether year 9s or year 10s show better improvement during a term of physical education classes. It could also work with any two groups within a class such as “boys or girls”.
The statistics learning is based on the Statistical Investigations series (Part 1, Part 2, Part 3) by Matt Regan, Maxine Pfannkuch, and Pip Arnold that was developed in conjunction with the TLRI research project: Building students’ inferential reasoning: statistics curriculum levels 5 and 6.
There are several components to this unit:
- Students collect and process data about their catching skills.
- Students use initial data to learn about dot plots, distributions, box and whisker plots.
- Students use the Karekare College population from CensusAtSchool to learn about sampling and sample to population inference.
- Students use pre and post PE results for their class to learn about arrow graphs.
- Students use both classes’ improvement data to report on the comparative progress of the two classes and use this to make an inference about all junior students at the school.
Associated Achievement Objectives:
Health and Physical Education:
Personal Health and Physical Development
- Experience a range of personally enjoyable physical activities and describe how varying levels of involvement affect well-being and lifestyle balance.
Movement Concepts and Motor Skills
- Acquire and apply complex motor skills by using basic principles of motor learning.
The learning opportunities in this unit can be differentiated by providing or removing support to students and by varying the task requirements. Ways to support students include:
- modelling the processes of posing questions, designing survey questions, analysing the results, and reporting the findings
- modelling the construction of graphs, tables, and the entry of data into spreadsheets
- providing pre-prepared graph templates to support developing scales for axes and access to digital graphing platforms
- providing prompts for writing survey questions, and descriptive statements for reporting
- grouping students flexibly to encourage peer learning, scaffolding, extension, and the sharing and questioning of ideas
- applying gradual release of responsibility to scaffold students towards working independently
- providing frequent opportunities for students to share their thinking and strategies, ask questions, collaborate, and clarify in a range of whole-class, small-group, peer-peer, and teacher-student settings.
The context for this unit can be adapted to suit the interests and experiences of your students. Sports competitions are often engaging for students. Other physical education skills, perhaps ones that are more relevant to your students, could also be investigated as the focus of this unit. This could be decided upon in collaboration with your students and/or your physical education department.
Note that the statistical enquiry process can be applied to many topics and selecting ones that are of interest to your students should always be a priority. You might collect data to find out which topics most interest your students.
Te reo Māori kupu such as taurangi (variable), tūhuratanga tauanga (statistical investigation), kauwhata ira (dot plot), and kauwhata kauamo (box and whisker graph, box plot) could be introduced in this unit and used throughout other mathematical learning.
- Chromebooks/laptops/desktop computers
- Data collection sheets
- Resources for the throwing and catching tasks
- Karekare College data card sets
- Copymaster 1
- Copymaster 2
This unit is presented as a series of sessions, with each mathematics lesson alternating with a PE lesson. Whilst these learning areas are closely correlated at the beginning and end of the unit, there is scope in the middle of the unit to focus on the development of subject-specific skills. Whilst the PE lessons are focussed on catching and throwing skills; these can be in the context of any catching and throwing game you choose. Note that at the end of sessions 1-7, you should provide time for students to practise small ball skills in a PE context, with reference to their goals, recent discussion, and newly-informed findings. The end of the unit gives more focus to mathematics (statistical reporting).
To participate in this units, students should be familiar with (i.e. are able to follow) the PPDAC cycle. It is also assumed that students have learned about dot plots but have not yet learned how to draw a box and whisker plot.
The statistical software used throughout this unit is CODAP. It is browser based and tutorials in a NZ context can be found at http://karekareeducation.co.nz/category/codap/.
This unit could be run by two classes at the same school, or at different schools and results compared as part of the analysis (see sessions 6 and 11).
Session 1
This sessions focuses on throwing and catching (physical education context) and exploring the idea of control variable (statistics and physical education contexts).
- Explain to students that, as a class, you are going to explore (1) what factors/attributes might affect our ability to throw and catch, (2) if instruction and practice improve our ability to throw and catch and (3) quality data collection.
- Generate a list of ideas for the above points as a class, ensuring that students identify points (1) and (2) might work in conjunction and improve our ability to throw and catch.
- Hold an initial PE activity in which students practise throwing and catching. Draw students’ attention to the techniques of throwing and catching, and to thinking about what attributes the better throwers and catchers might have. This could be a game of dodgeball, handball, netball etc.
- Explain how the baseline data for throwing and catching will be collected.
- Discuss the three tests that will be used to collect throwing and catching data: standing catch, moving catch, and throwing. Provide time for students to consider variables and factors that should be controlled in these tests.
- Provide time for students to carry out the tests and collect data.
Collecting baseline data for throwing and catching
There are three different pieces of information that are collected.
- Stationary catch
- Moving catch
- Throwing
Each student will need their own data sheet (Copymaster 1) to collect their baseline data. The data sheet could be used to collect final data (and mid-point if wanted) as well. Each student also needs a data card (Copymaster 2) to record the combined score for each of the three pieces of information.
Instructions for set up to collect throwing and catching data
Stationery catch
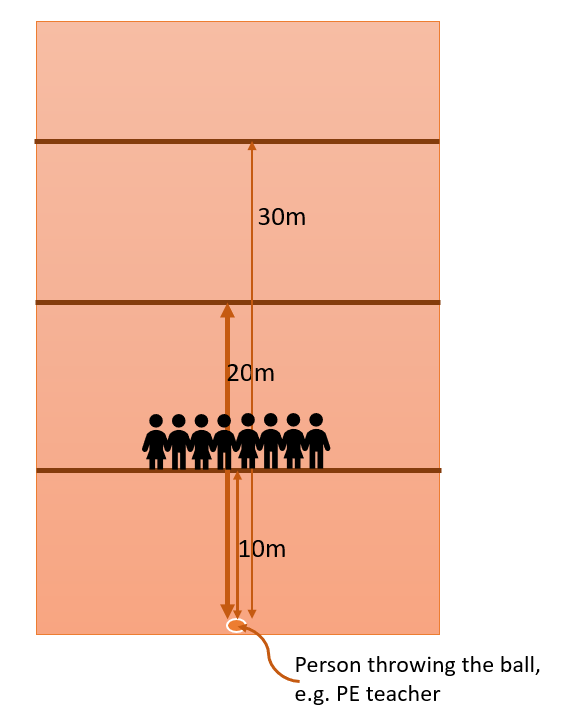
Students will catch the ball at three different distances from the person throwing. There will be three throws at three different distances (10m, 20m, 30m) to catch, a total of nine catches per student.
The students will line up at each of the three distances (10m, 20m, 30m). The teacher will throw the ball three times to each student. This could also be done in pairs. The student records the number of catches for each distance on their own data card.
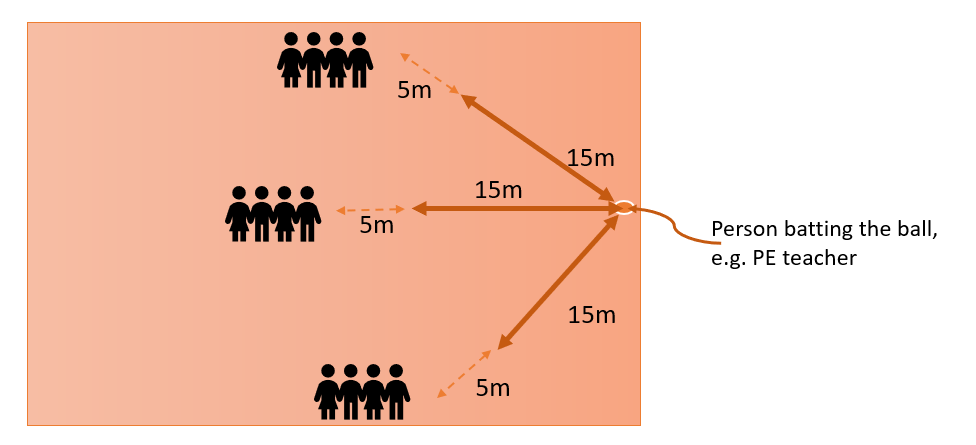
Moving catch
There will be three balls to catch at each of three positions. The starting positions are approximately 20m from the person batting the ball. The person batting the ball will aim to get the ball to land abut 5m from the student, forcing a need to move to catch. Students will line up behind each of the three positions and receive three balls to catch. Students will record the number of moving catches in each position.
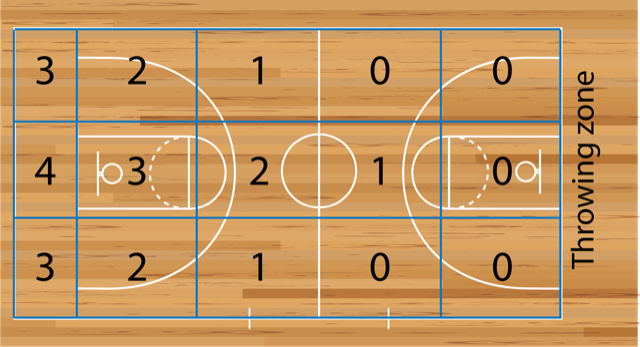
Throwing
The students will get five throws from the throwing zone. Distance and accuracy are important. Where the throw lands dictates the score. The gym is split up into zones based on a blue grid similar to the one below. The 12 larger zones should all be the same size, with the 3 higher scoring zones at the end around half the size. Students make their five throws and record the score for each throw.
At the end of the session have each student complete their data card with their name, year, gender, and a total score for each of standing catch, moving catch and throwing. Collect in the data cards. The data will be entered, along with other data collected, in the next session.
Session 2
This sessions focuses on students learning to organise data in a spreadsheet. Students will use the data to make personal goals for the unit.
Preparation: Prior to the lesson the teacher needs to make a copy of the data cards, one set for each group. The teacher should also prepare a blank spreadsheet with the student names and space to enter each student’s data. Each row of the spreadsheet needs to correspond to one person, meaning the first column is a unique identifier (such as a name) and each other column contains a single variable.
- Introduce the job of Data Entry Administrator using a website such as www.careers.govt.nz. In this session, students will be data entry administrators. Their task is to enter the data from the previous lesson into a spreadsheet and save it as a csv file. This is a good time to learn that the tab key moves across columns and the enter key moves down. They can work in pairs, one person reading the data and one entering it, or work individually using a ruler to keep track of the rows. Consider any community links that can be made here - perhaps an accountant or other data entry expert could talk to your class about their role and daily use of spreadsheet software.
- Teach/remind students about smart goals (Specific, Measurable, Achievable, Realistic, and Timely) and encouraged to write one or two goals for improving their small ball skills during the unit.
Session 3
This sessions focuses on students learning to make box and whisker plots. Students will see what the whole class data looks like.
Preparation: The teacher needs to prepare by drawing axes on the board or on a PowerPoint. This will allow students to quickly and easily place their data cards in position on the whiteboard.
- As a class, discuss how difficult it is to quickly get a good idea of where the class is at just by looking at the numbers on the data sheets. Emphasise that creating a picture/graph would be beneficial to the class. Distribute the data cards, each with a small amount of Blu-Tack.
- For the first variable of interest, such as standing catch, ask students to come and place their cards on the axis on the whiteboard. A class discussion can be had about the shape of the distribution. The teacher can then demonstrate how the median and quartiles are found and what they mean. The end result is the distribution and box and whisker plot for the whole class are on the board. Students could copy this into their books.
- Repeat this activity for the other variables of interest. Each time the students should come up and move their own cards. If the white board is wide enough, it is possible to fit two or three distributions up and this allows for discussion about how different tests have led to different (or similar) distributions.
- Hold a discussion around how this data could inform PE learning.
Session 4
This sessions focuses on students learning to produce digital box and whisker plots.
Preparation: The teacher needs to create a single data file so that all students are working with the same data. This can then be converted to a CSV file, imported and saved in CODAP. Share a link to this CODAP file so that students can easily access it when required in the lesson.
- Demonstrate how to use CODAP to produce a distribution and box and whisker plot for the first variable of interest. Having entered data themselves, and taken part in the data card activities, it will be easier for students to understand what the table is about. They should identify that each dot on the graph represents a person and recognise that the position of the dot is based on data about that person.
- Provide time for students to produce the same graphs independently. Students could also colour the graphs by gender (though at this stage we are not making comparisons).
- Have students produce a graph for each variable of interest. They should copy the graphs into a document file (e.g. Google Doc).
Session 5
This sessions focuses on students learning to to analyse distributions for whole groups.
Preparation: The teacher needs to have printed the relevant graphs or created a booklet for students to work in. Alternatively, students could type their analyses directly into their document file made in the previous session.
By the end of this session, students should have a solid understanding of what the data looks like for the class and how it links to the physical activities and training they are doing.
- Using class ideas and discussion, lead an analysis for the whole group using one of the variables of interest. This could result in a “model analysis”. The four categories for discussion are shape, centre, spread, unusual/interesting.
- Provide time for students to write analyses for each of the remaining variables of interest.
Session 6
This session is focused on students exploring data and creating graphs that compare two sub-groups.
Preparation: The teacher needs to create a file that includes data from the competing class. This file could be saved in CODAP and then a link sent to students.
- Introduce students to doing their first comparison by telling them they will see how they compare with the other class (if there is one).
- Start with the problem to be investigated: e.g. “I wonder if the Year 10 class tends to have better initial standing catch scores than the Year 9 class”.
- Demonstrate how to use CODAP to show a comparison of the two classes for this variable of interest. Lead a class discussion into what this means.
- Provide time for students to use CODAP to reproduce this graph.
- Using class ideas and discussion, lead a more detailed analysis for the comparison. This could result in a “model analysis”. The four categories for discussion are shape, centre, spread, unusual/interesting. Finish the discussion with a conclusion to the posed investigative question for the group. This could be followed up by starting to get students wondering about whether this is true just for these two classes or might be true for the whole syndicate/school/year group etc.
Session 7
This session is focused on students writing an analysis for a comparison question.
- Lead a discussion around what other comparison investigative questions students think they could ask of the data. By the end of the discussion a number of well written investigative questions should be generated and displayed for the class.
- Have students write a comparison investigative question, create a graph to compare the variable of interest, write an analysis, write a conclusion for the group, and then begin to think about how their findings might relate to the whole syndicate/school/year group etc. See the Level 4 Unit, Cars, for further information around writing investigative questions.
- Provide opportunity for students to share their findings with each other. This should be interesting as students will not all have worked on the same problem.
Session 8
This session is focused on students learning to take samples and make a call about the population based on their sample.
Throughout this session the PE context moves to practising and preparing for the final challenges against the competing class.
Preparation: Prior to this lesson, the teacher needs to have made enough sets of the Karekare College data cards for one set per pair of students as well as pre-prepared grids for heights and time to school box plots. Note that gender on the data cards is indicated by the colour of the card so boys need to be printed on a different colour to girls.
- Introduce the purpose of this session, that is to try and see if can we make a call about all year 9s and 10s based only these two classes.
The teacher should emphasise that the class is now going to step outside of the real life situation into a learning space. The learning done here will then be applied back to the real-life situation. Students are going to use another high school’s data from CensusAtSchool to learn about how to do make a population inference. It is a learning situation because students will be able to take multiple samples, in real life they only get one sample.
- Introduce Karekare college by handing out data cards to pairs/groups of students. Describe the population to the students. Tell the students that there are 13 variables altogether and see what variables they can work out. The variables all come from the 2009 CensusAtSchool survey. Provide students with a link to the 2009 CensusAtSchool questionnaire or provide paper copies of the survey questions that were used. When they identify a variable, they should give a reason why they think it is a particular variable.
The variables on the data cards are indicated in the table below.
| Ethnicity | Age in years | Year level |
| Transport to school | Time to school in mins | Height in cm |
| How carry school bag | Weight of school bag in grams | Popliteal length in cm |
| Fitness level | Index finger length in mm | Ring finger length in mm |
- Get students to pose some investigative questions that could be answered using the available variables. Talk about possible “sub” populations. Students might identify that sub-populations can be defined e.g. girls at Karekare College.
- Have students pose comparison investigative questions that could be asked about different “sub” populations of students at Karekare College. Introduce the question “Do boys tend to be taller than girls at Karekare College?” this is the first investigative question we are going to answer about Karekare College.
- Have students start to draw out cards and record the heights on the pre-prepared grid. Hopefully someone will suggest that using all the cards will take a long time. So what can be done instead? Hopefully someone will suggest that they just take some students to get a picture of the school. Suggest that each group selects a handful of students from Karekare College. This is called a sample. Ask “Why might a sample be a better idea than using the whole population?” Some reasons for sampling: more practical, takes less time. A sample can tell us about the population.
- Provide time for each pair of students to take a sample of about 30 boys and 30 girls, and draw a box plot on the pre-prepared grid. Once they have completed this, they can go and see other groups results and hopefully notice that each sample has produced different statistics.
- Discuss with the class who tends to be taller at Karekare College, boys or girls, based on their samples. There will be a mix of answers. Some groups will show boys have a higher median height, others will show girls have a higher median height – this is a problem. Obviously different samples are showing different statistics and in this case the samples are leading to different conclusions. The story is inconsistent and we don’t know who tends to be taller.
- Repeat the same process to answer the question “do students who walk to school tend to take longer than students who bus at Karekare College? Give students time to think about whether they think this is true.
- Have students use samples of about 30 bus-users and 30 walkers and complete a box and whisker plot on a pre-prepared grid. Have students report back to the class. All groups will see the bus median higher than the walk median and have the same conclusion – bus students tend to take longer to get to school. Different samples are still showing different stats but the message is consistent and we can probably be pretty sure bus students tend to take longer to get to school. HOWEVER in the real world we only get to take one sample so how would we know which situation we are looking at? This is the motivation for the next step.
- Using the work from the previous step, support students to develop a way to “make a call”. Develop these ideas using lessons 10, 11 and 12 from the Statistical Investigations on Census at School (Lessons 9-12).
- Have students go back to their work from Session 6 and apply their learning by making a call for the whole junior school based on their class data.
Session 9
This session is focused on students developing their own investigative questions in order to evaluate the improvement of all participating groups. Students can start posing comparison questions about the improvement of different groups. E.g. “I wonder if Year 10s tend to show better improvement in throwing score than Year 9s at our high school?” As the teacher, review and "tidy up" the questions, and record a list of well-written investigative questions on the board.
- Provide time for students to develop an investigative question to work on and write a hypothesis for it.
- Group students together based on their posed investigative question and have them decide on how data can be collected, and make a plan for doing this. Alternatively, the data collection can be organised by teachers. There will need to be some discussion with the class about the factors taken into account when running the tests.
- Provide time for students to collect data as part of their PE lessons.
- Provide time for students to process the data. This can happen on paper initially, for just their class, or a smaller group of students. Using the sheet, students should calculate the improvement scores for each student. This will help to generate discussion about what a positive improvement score means, what a zero score means, and what a negative score means. This is an ideal time to celebrate the best improvers in the class, and for students to reflect on their goals.
- Allow students to use CODAP to process data and produce a graph that helps them answer their comparison investigative question. They can then write an analysis of this.
- Direct students to make a call about who tends to show better improvement for all junior students based on the “median outside the overlap” rule of thumb. This is also the opportunity to discuss other factors for this and whether the results of their investigation match what they would expect (their hypothesis).
Session 10
This session is focused on students reflecting on the results of their investigations. Students should report back to the class on their findings.
As a class, come up with ideas on what the results mean for the PE department and what subsequent actions could be taken as a result of the investigations.
Provide opportunity for students take part in a PE challenge using the skills they have been focusing on. This could be against the other class doing this unit, if there is one.
Dear families and whānau,
Recently, we have been investigating the idea of 'sample' in population statistics. We have been investigating this is the context of throwing and catching small ball skills in physical education (PE) lessons. Ask your child to share their learning with you.