Baby business
The purpose of this activity is for students to make predictions about future weight and height of a baby based on statistical data.
This activity assumes the students have experience in the following areas:
- Solving problems with percentages as proportions.
- Extending patterns involving two variables and finding rules for the relationship.
- Interpreting scatterplots.
The problem is sufficiently open ended to allow the students freedom of choice in their approach. It may be scaffolded with guidance that leads to a solution, and/or the students might be given the opportunity to solve the problem independently.
The example responses at the end of the resource give an indication of the kind of response to expect from students who approach the problem in particular ways.
If a baby has a weight of 4.5 kilograms and a length of 57 centimetres at six weeks old, what is their expected weight and height at age 5 years?

What is the predicted height of the baby when he or she is an adult?
You will need access to growth charts such as those at:
https://www.tewhatuora.govt.nz/for-the-health-sector/specific-life-stage-health-information/child-health/well-child-tamariki-programme/growth-charts
The following prompts illustrate how this activity can be structured around the phases of the Statistical Enquiry Cycle.
Problem
The problem section is about what data to collect and who to collect it from and why it’s important.
- What is the investigation question?
- Is my question a summary, comparison, or relationship question? (The question involves relationships between age and the variables of height and weight.)
- Why is my question important?
- Are all the words (terms) in my question clear to someone else? If not, have I explained or defined those words? (Prediction and expected values might need explanation. Percentiles are used in the charts.)
- What variables will be involved? (A variable is both a characteristic and a way to measure that characteristic) (In this investigation the variables are age, measured in months and years, weight, measured in kilograms, and height, measured in centimetres.)
Plan
The planning section is about how students will gather the data.
- How will I go about answering this question? (Students need to recognise that the two relationships need to be investigated separately.)
- What will I need to know? (The given weight and length will need to be compared with norms for other babies of the same age. From those norms predictions can be made using percentiles.)
- Can I predict possible answers to my question, even before I look at data?
- What might my answer look like? (The answer will be a prediction about the weight and age of the child at 5 years and at adulthood.)
Data
The data section is concerned with how the data is managed and organised.
- How will I interpret the weight and length I am given, using the growth charts?
- How certain will I be able to be about my predictions?
- What factors might influence the growth of the child as it ages.
Analysis
The analysis section is about exploring the data and reasoning with it.
- Have I reflected back on my question so I am clear what I am trying to find out?
- What tools will help me to display the data in different ways? What ways are appropriate to my data and help answer my question? Can I use the charts to explain my predictions?
- What variation is likely from my predictions? How might I allow for that variation?
- Can I make preliminary statements about my findings, starting with “I noticed that...”
- Am I developing ideas about what the answer to my question might be?
Conclusion
The conclusion section is about answering the question in the problem section and providing reasons based on their analysis.
- Have I answered my original question? If not, why not?
- How might I convince someone else I have answered the question?
- Do my displays best show what I have found out?
- Is my summary of findings clearly written so others can understand it?
- What other things have I learned and what further questions do I have?
Examples of work
Work sample 1
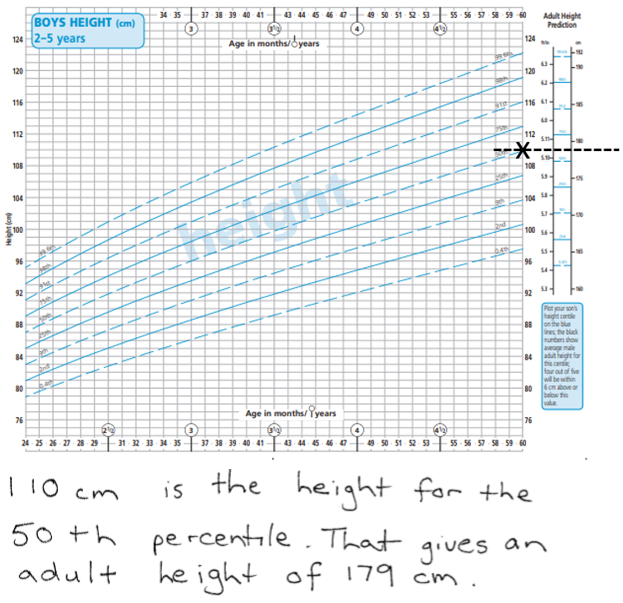
The student uses a deterministic approach to predict the height and weight of the baby.
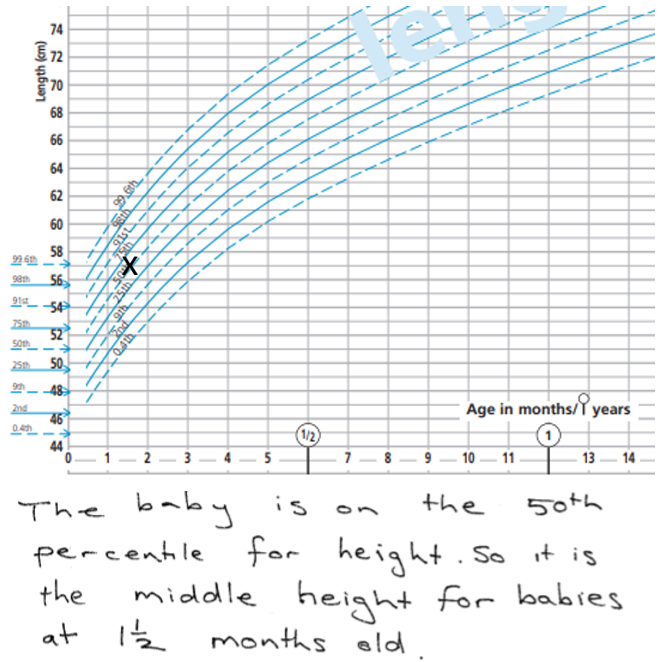
At a procedural level, students need to interpret the data presented in the growth charts. This is evidenced by correctly marking position of the given weight and length on the charts. The horizontal scale varies between charts, on the weight chart the axis is marked in weeks and months. On the length chart the axis is labelled in months and years. Students should also make some statement about the meaning of percentiles.
Click on the images to enlarge them. Click again to close. 
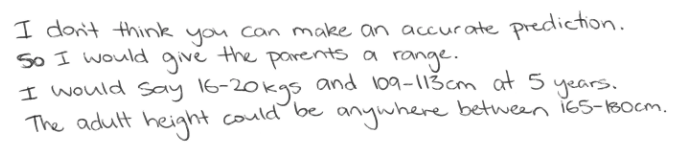
Predictions for weight and height by these students are unlikely to acknowledge any variation from the percentiles at 6 weeks of age.

Work sample 2
The student acknowledges potential sources of variation in making predictions for the weight and height of the baby.
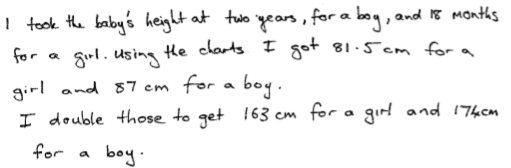
Students who understand that extrapolation from given data is prone to variability are likely to identify sources of variation. The first of those sources is gender.
Click on the images to enlarge them. Click again to close. 
Students might also read about projections of weight and height. The baby growth rates are based on breast fed babies and subsequent good nutrition. Students may note that the accuracy of prediction depends on the baby being well-fed, not falling ill, and not have a genetic or hormone related condition. Students might also look up other ways to predict babies’ heights which also acknowledge variation.
Click on the image to enlarge it. Click again to close.