Long Running
In this unit we take samples of blocks from a bag and use them to make predictions about the blocks that the bag actually contains. We discuss the difference between theoretical probability and experimental estimates of probability.
- Take samples and use them to make predictions.
- Compare theoretical and experimental probabilities.
This unit considers the notions of theoretical probability and experimental estimates of probability. Theoretical probability is the probability that an event will occur according to the ratio: Probability of event = (number of favourable outcomes) / (number of possible outcomes).
Experimental estimates of probability are the probability that an event occurs as found by repeated trialling. In this unit the population is a bag of coloured cubes from which they randomly select samples. Students will learn through experimentation that the more samples they take the closer their estimates of the actual proportions of the population become to the actual proportions and to the theoretical probabilities of selecting various colours.
The learning opportunities in this unit can be differentiated by providing or removing support to students, or by varying the task requirements. Ways to support students include:
- reducing the complexity of the tasks, for example, start with 2 blocks, one of each colour in session 1
- providing additional support in the use of fractions. For example, in session 1, remind students that the “whole” is the set of objects (the total number of cubes) and the “parts” are the subsets of the whole. It is important that students have a strong understanding of the set model for fractions before being introduced to the expression for the probability of an event
- providing additional support, as needed, with ways of describing probabilities using fractions, decimal fractions and percentages
- allowing time for more sharing and discussion of ideas by spreading sessions 3 and 4 over two days.
This unit compares theoretical and experimental probabilities using coloured blocks, found in most classrooms as the context for the problem. This context can be adapted to suit the interests and cultural backgrounds of your students. Many students are interested in kaitiakitanga, guardianship of the environment, so using a context about endangered species may be motivating. Aotearoa has many species in danger of extinction, and scientists conduct regular, ongoing surveys to monitor population numbers, e.g. Maui or Hector’s dolphin, takahe, Chatham Island robin. Cubes in a bag is a metaphor for a wide range of sampling contexts, from predicting the outcomes of games, to the likelihood of the weather being fine for Sports Day. Alternatively, students could select items to use instead of cubes in the probability experiments in sessions 1, 2 and 3. This could be anything that appeals to their interests and experiences, such as All Blacks cards, although they need to be things that are equally likely to be selected.
- Coloured cubes, or alternative items
- Graph paper
- Paper bags, or alternative "non see through" containers
Session 1
In this introductory session we discuss the theoretical probabilities of drawing cubes from a bag containing coloured cubes.
- Put 4 coloured cubes in a bag, two red, one blue, and one yellow.
- Show the students what cubes are in the bag.
- Ask the students to identify what will happen if a cube is selected at random from the bag:
What colour cube will be selected?
What colours of cube could be selected?
What colour is most likely? Why?
Some students are likely to try to tell you what colour cube will come out. It is important for them to realise that they can not be certain what colour will be selected. If one is chosen at random it could be any of the three colours. Red is more likely than blue or yellow because there are more red cubes than blue or yellow cubes in the bag. - Now ask students:
What is the chance of selecting a red/blue/yellow cube?
If students have difficulty identifying simple probabilities such as these, some work with coins and dice is probably required before continuing with this unit.
The important thing for students to understand here is how to work out theoretical probabilities. They will probably know that if there are 4 cubes and half of them are red the probability of selecting a red one is 1/2, but it is useful for them to know that this can be stated more generally:

In other words, the probability of something happening is the number of ways it could happen, divided by the number of things that could happen (as long as all events are equally likely). So the probability of rolling an even number with a normal die is 3 (the number of even numbers) divided by 6 (the number of numbers) which equals 3/6 or 1/2.
- As a class draw a graph of the probabilities of selecting each colour of cube. Label the graph "Theoretical robability of selecting coloured cubes", and discuss what the word ‘theoretical’ means.
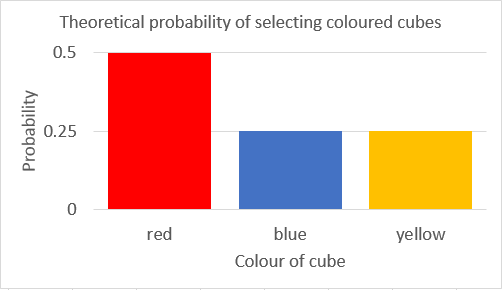
- Discuss what this means in terms of selecting cubes. You are twice as likely to select a red cube as a blue or yellow cube.
- If there is extra time students could be challenged to suggest what cubes would need to be put into a bag to make it match a given graph of theoretical probabilities.
Session 2
In this session we discuss theoretical probability in the context of experimental estimates of probability.
- Reintroduce the bag of cubes and graph of probabilities from Session 1.
- Discuss what will happen if you select one cube at random. Students should now be able to explain accurately what could occur, and how likely each of the possibilities are.
-
Ask what will happen if you select four cubes at random, replacing each after recording its colour. Students are likely to suggest that there will be 2 red cubes, 1 blue cube and 1 yellow cube selected. While this is possible, it is not the only possible outcome, in fact the probability of exactly 2 red, 1 blue, and one yellow cube is less than 20%!
- Ask four students to each come up, select a cube, record its colour and replace it in the bag. Graph the results on the board and discuss the results.
- Repeat several times.
- Ask students to discuss in small groups why the results do not match with what they had calculated in the previous session.
- Share ideas as a class. Hopefully some students will recognise that theoretical probability is only a way of predicting what may occur, it does not tell you what will occur. Ensure that all students understand this.
Session 3
In this session students will investigate some long run probability experiments, observing how a larger sample size affects approximations of theoretical probability.
- Reintroduce the bag of cubes (2 red, 1 blue, 1 yellow) and the graph of theoretical probabilities.
- Ask students to predict what will happen if you select 20 cubes at random, replacing them as in the previous session.
- Record students’ predictions to refer back to.
- Discuss why students made their predictions. Discourage students who have inaccurate probability concepts – estimates should be around 10 red, and 5 each blue and yellow, but not necessarily exactly those numbers.
- Divide the class into five groups.
- Get each group to make a bag with 2 red, 1 blue and 1 yellow counter.
- Ask each group to select four cubes at random, replacing each after recording its colour.
- Combine the results as a class, in a table. How close were the student’s predictions?
- Calculate the proportion of each colour and graph the result.
- Compare the graph to the one from Session 1 and to those from Session 2.
Is this graph more accurate?
Why or why not?
How could we get a more accurate approximation? (Hopefully someone will suggest more samples) - Ask students to make a prediction of the results of selecting 50 cubes at random. Record on the board.
- Get each group to select ten cubes and analyse the resulting class sample of 50.
- Repeat for twenty cubes per group to give a sample of 100.
- Discuss and compare the graphs.
Session 4
In today’s session students choose a long run frequency investigation to carry out in groups.
-
Briefly recap the previous three sessions’ work so that students remember what they have done thus far in the unit.
-
Explain that students are going to carry out similar investigations in groups to compare long run experiments with theoretical probabilities.
-
Ask students to brainstorm the kind of events that they might do an investigation of. The key requirements are: defined theoretical probabilities; and measurable probabilities for the experiment. If students can not think of ideas, suggest a few to get them started:
Probability of suits for a deck of cards.
Probabilities of numbers on dice.
Probabilities of different results for tossing two coins. -
Explain to students that they are to produce a report of their findings which will include:
- An introduction explaining what they are investigating.
- A graph of the theoretical probability for their event.
- Trials of 5, 20, 50 and 100 samples, with graphs of the experimental probabilities for each.
- A summary statement explaining what they have found out.
-
Students work in small groups.
Session 5
In the final session of the week we complete our investigations and share the results with the class.
-
Students to be given time as required to complete their investigations.
-
Students share their results with the class.
-
Discuss as a class:
What is the difference between theoretical probability and experimental estimates of probability?
What is theoretical probability?
What are experimental estimates of probability? -
Make a poster with class definitions of the two terms which can be displayed to remind students. Possible definitions are:
Theoretical probability is what you would guess would happen, and can be worked out by dividing the ways a thing can happen by the possible things that can happen.
Experimental estimates of probability are the probabilities you find when you do an experiment, and get closer to the theoretical probability the more samples you do.