This unit encourages ākonga to assess the validity of a set of statements and then plan and carry out investigations to find out whether the statements are true. Ākonga then carry out statistical investigations of their own.
- Plan and carry out a statistical investigation to assess the reasonableness of a statement.
- Check the reasonableness of answers obtained using a calculator by calculating mentally and using approximations.
In order to assess the validity of statements, ākonga will need to identify the assumptions underlying the statements and the accuracy of the statements. Some criteria for assessing the statements are needed. For example, what measure will be used as an average lifespan?
Ākonga will also need an understanding of the term average. In conversational language, the word average is commonly used to mean something that is not very good. However, in statistics an average is a measure of the centre for a set of data. There are three common measures of centre: mean, median and mode. The mean is calculated by adding all the numbers together and dividing by the number of numbers. The median is the middle score when the data is arranged in ascending order and the mode is the most common score.
This unit can be differentiated by varying the scaffolding provided or altering the difficulty of the tasks to make the learning opportunities accessible to a range of learners. For example:
- implementing optional small-group teaching for ākonga to participate in if they need new teaching, or revision, about the concept of mean, median, and mode
- modelling examples of addition and subtraction strategies that could be used to calculate number problems mentally
- encouraging ākonga to challenge their mathematical thinking by selecting statistical investigations that are complex and/or unique, for example, the number of times we sing ‘Happy Birthday’.
The context in this unit can be adapted to recognise cultural diversity and ākonga interests to encourage engagement. For example, statistical investigations could be related to cultural events such as matariki or diwali.
Te reo Māori vocabulary terms such as toharite (average) and tauanga (statistics) could be introduced in this unit and used throughout other mathematical learning.
- The Statistics New Zealand website may be useful to find average ages and other relevant information. Based on mortality in 2022, a newborn girl can expect to live 89.0 years and a newborn boy 86.1 years.
- Copymaster 1: Advertisement Text
- Copymaster 2: Investigation Example
- Copymaster 3: Investigation Template
- Calculators
Getting Started
- Begin a discussion about the tasks ākonga complete to get ready for school in the morning.
What do you need to do to get ready for school in the morning?
How long does it take you to get ready?
How long do you spend…
- in the shower?
- brushing your hair?
- making and eating breakfast?
- Does it take you the same amount of time every morning or does it vary a bit?
- What is the reason for the variation?
Does it take you the same amount of time every morning or does it vary a bit?
What is the reason for the variation?
- Introduce the advertisement contained in Copymaster 1.
- Introduce / review the concept of averages with the group.
What is an average? (measure of the middle or centre, sometimes assumed to be the normal)
What measures of the middle do we use? (mean, median, mode)
How do we calculate those measures?
Ensure ākonga understand the difference between the use of ‘average’ in everyday speech and its particular meaning in statistics.
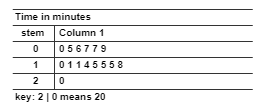
- Ask a group of ākonga to estimate how many minutes they spend each morning preparing and eating breakfast. Display the data as a dot plot or stem and leaf graph. Online tools exist to create the displays. For example
- https://nces.ed.gov/nceskids/graphing/classic/
- https://www.mathsisfun.com/data/data-graph.php
- https://grapher.nz/ (there is a suggested 50 cent charge, per ākonga, to use this website)

- Give ākonga calculators and calculate the mean together. Add all the times and divide by the number of times. The median and mode can be derived from the graphs. Close in from top and bottom to find the median (middle time) and look for the highest frequency to get the mode. Vary the support needed for ākonga to understand how to find these statistical concepts, for some it will be revision and for others it may be new learning.
Are the averages all the same? Why or why not? - Return to Copymaster 1. Encourage ākonga to consider the validity of the statements.
Do you think these statements are accurate?
How would we check their accuracy?
- Split the class into groups and assign each group one of the statements. A tuakana-teina model could work well here. Tell the groups their task is to check whether the statement is accurate. They may need to collect data from their fellow ākonga. As ākonga work, ask them to record the assumptions they are making. These will include:
- the estimated length of the activity each day
- the variations that occur in the length of the activity
- whether the activity occurs for the same amount of time on weekends and weekdays
- the length of an average lifetime
- Once the groups have finished checking the accuracy of the statements, gather together as a class (mahi tahi approach) to discuss the results.
Do you think the statement is accurate?
How did you work that out?
What averages did you use? Why did you choose those measures?
- Make a list of the assumptions each group has made.
Exploring
Over the next few days, groups of ākonga carry out their own statistical investigations about the average time spent on various activities. Consider framing these investigations in a context that is reflective of the cultural diversity represented in your class.
- Discuss the average amount of time spent on a variety of activities. Encourage ākonga to identify activities they would like to find out about.
How long in a lifetime do you think you would spend watching TV?
How long do you think you would spend at whānau events?
How long do you spend sleeping?
- Discuss the assumptions that will need to be made. As a class, decide the assumptions that will be used by all groups and list these clearly. For example, the average lifespan is 89 years for females, and 86 years for males. Some assumptions will be specific to a statement, so groups will have to make some assumptions themselves. For example, average time spent sleeping may involve assumptions about when people slept and woke up, as opposed to checking their phone, reading books or watching television.
- Place ākonga into groups. Again , a tuakana-teina model could work well here.
- Groups list questions for investigation. For example:
In an average lifetime how long will be spent reading?
In an average lifetime how long will be spent eating kai?
- Show ākonga the worked example of the investigation, Copymaster 2 and explain the process they will follow to answer their question.
- Groups work to answer their questions using the investigation template, Copymaster 3. This may involve several small group conferences and/or whole class discussions to support ākonga through this process.
As ākonga work, encourage them to use mental strategies to estimate answers before they are calculated, and confirm the results of calculations. Discuss the strategies ākonga are using and compare strategies used by different ākonga.
What do you think the answer will be? How did you work that out?
Does the answer seem reasonable? How do you know?
Do you think the answer Taika got using the calculator is about right? How could you check?
That’s a good way to work that out. Did anybody use a different method?
You may also need to support your ākonga to convert between units of time. For example, 242 300 minutes is not as meaningful as 168.5 days. Since time measures are mostly based on non-decimal units, such as 24 hours per day and 60 minutes per hour, the calculations can be difficult. Allow ākonga access to calculators for the complex calculation.
Reflecting
Once groups have answered their questions, have them swap questions (without the assumptions, calculations and answer) and work out the answers to each other’s questions. Ask the review group to consider the assumptions that were made and to follow the template to get their own answers.
What answer did you get to the question?
How close was your answer to the conclusion of the investigating group?
Why do you think the answers you got were the same/different?
What assumptions did each group make that were the same? Why?
What assumptions did each group make that were different? Why?
Dear family and whānau,
This week at school we are carrying out investigations to find out the amount of time spent on various activities in an average lifetime. For example, brushing out teeth or sleeping. Please help us time activities around the home to support us with our investigations.