This unit explores a variety of activities (games of chance) where the number of outcomes in the sample space is clearly different from the number of events. Students learn to see the difference between events (for example a score of 4) and outcomes (for example 3 and 1, 2 and 2, 1 and 3).
- Use long-run frequencies to estimate probabilities.
- Compare the results of theoretical and experimental approaches to games of chance.
The concept of chance may be viewed as at variance with the causal, logical and deterministic thinking that characterises much of mathematics. Through life experiences students develop their own views of probability. These views are often not well developed and they may interpret chance to mean that nothing mathematical may be stated about a situation. Therefore, learning about probability poses particular difficulties, meaning, students at all levels harbour misconceptions about probability.
Many students interpret probability as synonymous with the proportion of times they think an event will occur. In turn, they may expect the event to always occur in that proportion. Compound events present particular difficulties, especially when they require a distinction to be made between “and” and “or” in a probability context. Very few students have any intuitive approach to finding the probability of a compound event, so situations need to be explored fairly formally. For many students, traditional approaches of defining the sample space and listing the number of favourable outcomes do not result in understanding. Even constructivist approaches, based on dice games where the scores from two dice are added, often result in misconceptions. Many students can see that there are more ways of getting a score of seven than of getting a score of two, but still cannot calculate the probabilities.
This unit explores the concept of sample space, using activities where the difference between the number of events and the number of outcomes is clearer than in many games used in the past.
It is a good idea to give students a format for recording their work. Basing an investigation on the statistical PPDAC cycle is useful, using the headings Problem, Plan, Data (from the experiment), Analysis (including theoretical probability), and Conclusion. Alternatively, students can develop a theoretical model based on their understanding of the situation, and follow that by testing the model with an experiment. In that case, PPDAC can still be used, with Plan including the development of the theoretical model. Students will need to record experimental results systematically – tally charts are the easiest method. Requiring students to record their initial hunch as part of the initial Problem stage can engage them in the idea of carrying out an investigation and having a stake in the conclusion.
The learning opportunities in this unit can be differentiated by providing or removing support to students, and by varying the task requirements. Ways to support students include:
- providing extended opportunities for students to explore the games of chance with a partner
- modelling the playing of games and construction of grids and tree diagrams
- strategically organising students into pairs and small groups in order to encourage peer learning, scaffolding, and extension
- working alongside individual students (or groups of students) who require further support with specific areas of knowledge or activities (e.g. creating a graph).
The context for this unit can be adapted to suit the interests and experiences of your students. For example, your students might be motivated to explore the fairness of games that are played in their cultures or households, or that were historically popular in different cultures.
Te reo Māori kupu such as putanga (outcome), hoahoa rākau (tree diagram), putanga whakamātau (experimental outcome), tūponotanga whakamātau (experimental probability), putanga tātai (theoretical outcome), tūponotanga tātai (theoretical probability), and tūhuratanga tauanga (statistical investigation) could be introduced in this unit and used throughout other mathematical learning.
- Bags or other containers
- Marbles (counters are an alternative)
- Paper clips
- Dice
Marble Snap
- Introduce the game, “Marble snap” to the class. Place three red and one blue marble in one bag and two red and two blue in the other bag. Invite a student to pull a marble from each bag and predict whether they will be the same (snap) or different. If the marbles are the same they win. Replace the marbles after each trial. Repeat this with a few more students.
- As you play the game, discuss it using the following prompts:
What is your hunch about who is most likely to win?
Do you think the game is fair? (Yes it is, surprisingly.)
What do we mean by a fair game? (A fair game is one in which there is an equal chance of winning or losing.)
How could we tell if the game is fair? (There are two essential approaches – experimental and theoretical).
- Accept and list suggestions from the class for identifying whether or not a game is fair. These may include:
- Do an experiment.
- Do a long run experiment.
- List the possible events.
- List the possible outcomes.
- Use informal diagrams to list the possible outcomes.
- Use a grid to list the possible outcomes.
- Use a tree diagram to list the possible outcomes.
- Suggest that carrying out an experiment is the best place to start. Tell the class that you will ask a number of students to pick marbles from the bags to try to get snap.
How will we record the results? (A tally chart with win and lose is the simplest approach.)
- Carry out 10 trials and record on the board.
What do you think of these results?
Do they mean that the game is fair?
What would happen if we did the experiment again?
How could we improve the experiment?
Encourage students to identify that a larger experiment could be used to obtain the long-run frequency.
- Organise the students into pairs or small groups so that each student can conduct 10 trials. While the students are working ensure that they are conducting the trials correctly, using replacement of the marbles in the correct bags. Collect in the results from the class and summarise on the board.
- Discuss them the results as a class:
What do you think of these results?
Do they mean that the game is fair?
What would happen if we did the experiment again?
The long-run frequency obtained by this experiment should not vary significantly in other similar experiments.
- Return to the students’ other suggestions of determining whether the game is fair. The important ones to work through are the use of grids and tree diagrams to list all possible outcomes. However which order you work through them should be determined by which ideas the students hold. Consider the best approach for introducing these to your class. You might work with the whole class, before allowing students who feel confident to go and work independently. This provides an opportunity for students in need of greater support to work with the teacher and their peers in a guided manner. Alternatively, you could provide a small range of independent tasks for students to work on, that explore both methods, whilst you explicitly teach each method to smaller groups (e.g. half the class).
Grid method
Explore the grid method with the following prompts:
- What colour might the marble in the first bag be?
- Does it have the same chance of being red or blue?
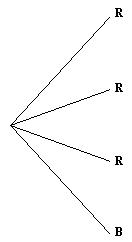
- What are the possibilities of what could happen when we pull a marble from the first bag? It is important that they list red, red, red and blue as the possible outcomes.
- If I pulled a red marble from the first bag what might happen when I pull a marble from the second bag? It is important that they list red, red, blue and blue as the possible outcomes.
- If I pulled a blue marble from the first bag what might happen when I pull a marble from the second bag? It is important that they list red, red, blue and blue as the possible outcomes.
- Let us list these outcomes on a grid.
| Red | Red | Red | Blue | |
| Red | RR | RR | RR | BR |
| Red | RR | RR | RR | BR |
| Blue | RB | RB | RB | BB |
| Blue | RB | RB | RB | BB |
- How many of these possible outcomes are ‘snap’?
How many of these possible outcomes are not ‘snap’?
What does this tell us about the fairness of the game?
Tree diagram method
Explore the grid method with the following prompts:
- What colour might the marble in the first bag be?
- Does it have the same chance of being red or blue?
- What are the possibilities of what could happen when we pull a marble from the first bag? It is important that they list red, red, red and blue as the possible outcomes.
- Draw these outcomes as the four branches of the first level of the tree diagram.
- Take each branch in turn.
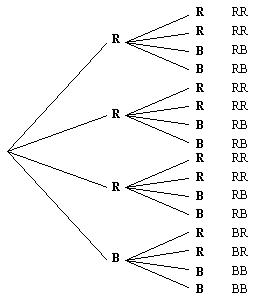
If I pulled a red marble from the first bag what might happen when I pull a marble from the second bag? It is important that they list red, red, blue and blue as the possible outcomes. Draw these four branches as the second level of the tree diagram.
- Repeat this for the other two red branches.
If I pulled a blue marble from the first bag what might happen when I pull a marble from the second bag? It is important that they list red, red, blue and blue as the possible outcomes. Draw these four branches as the second level of the tree diagram..jpg)
- Now let us list the outcomes.
- Discuss:
How many of these possible outcomes are ‘snap’?
How many of these possible outcomes are not ‘snap’?
What does this tell us about the fairness of the game?
Probability tree approach
Probability trees are focused on at Level 7 of the curriculum. It does not need to be introduced at Level 5. Even if some students have suggested it, it might be best to treat it as extension material either later or for some interested students. Students need to see the equivalence of a probability tree with the tree diagrams of method 2. Teaching them to multiply along branches without understanding is counter-productive.
- List the possible events
Students may suggest that the things that could happen are:
RR
RB
BB
BR
If they suggest that this means the game is fair, question But what is the probability of RR, RB etc? We do not know unless we list all the outcomes.
- List the possible outcomes
Students may wish to list all possible outcomes directly, hopefully in a systematic way. Allow them to do this, but compare the use of grids and tree diagrams, pointing out how easy it is to miss outcomes without a diagram.
- Use informal diagrams to list the possible outcomes
Students may invent their own diagrams in order to find all possible outcomes.
Suggestions should be listened to and compared with tree diagrams and grids.
Reflection
Whichever theoretical method or methods has been used to determine the probability of snap, this probability should now be compared with the long-run frequency that has been found experimentally. In probability it is desirable to use theoretical and experimental approaches to verify each other.
Is the answer the same from both approaches?
Why do you think they are different?
How close does the experimental answer have to be before we accept that it is confirming our theoretical answer?
How do the probabilities compare with your original hunch?
There is always a finite chance that the long-run frequency might be quite different to the expected answer. All that we can do in this situation is to collect more data to obtain a longer run.
Is the game fair?
How do we know it is fair?
What is the probability of winning?
How do we know that this is the probability?
Marble Snap Revisited
Have students work in pairs or small groups to explore a number of variations on the game. Are any of the following games fair?:
- Bag one: 3 red marbles, 1 blue marble
Bag two: 3 red marbles, 1 blue marble - Bag one: 3 red marbles, 1 blue marble
Bag two: 1 red marble, 3 blue marbles - Bag one: 2 red marbles, 2 blue marbles
Bag two: 2 red marbles, 2 blue marbles - Bag one: 4 red marbles
Bag two: 1 red marble, 3 blue marbles - Bag one: 4 red marbles
Bag two: 2 red marbles, 2 blue marbles - Bag one: 4 red marbles
Bag two: 3 red marbles, 1 blue marble
Start with a class discussion of how we can determine whether each of the games is fair. Ensure that students are clear that they need to determine whether there are equal chances of winning and losing. Discuss also the need to use both theoretical and experimental approaches in order to verify solutions.
If students use an experimental approach, scaffold them with questions like:
- Are you replacing the marbles after each trial?
- How will you record the results?
- What do you think of these results?
- Do they mean that the game is fair?
- What would happen if you did the experiment again?
- How could you improve the experiment?
If students use the grid method to investigate the theoretical probability, scaffold them with questions like:
- What is in the first bag?
- Can you write those possibilities across the top of the grid?
- What is in the second bag?
- Can you write those possibilities down the side of the grid?
- If you pull a blue marble from the first bag and a blue from the second, what is the outcome?
- Where should you write this outcome on the grid?
- How many different outcomes are there?
- How many of these outcomes are ‘snap’?
- What is the probability of ‘snap’?
If students use the tree diagram method to investigate the theoretical probability, scaffold them with questions like:
- What is in the first bag?
- Can you write those possibilities as the first level of a tree diagram?
- What is in the second bag?
- If you pulled a red marble (etc) from the first bag, what could you pull from the second bag?
- Can you write those possibilities as the second level of the tree diagram?
- On this diagram can you follow the branches through to list the outcomes?
- How many different outcomes are there?
- How many of these outcomes are ‘snap’?
- What is the probability of ‘snap’?
Reflection
Hold a class discussion where students present the results from their investigation into a variation of marble snap.
- Was your version fair? How do you know?
- What happened when you carried out an experiment?
- Can you explain what the theoretical probability is?
- Was there much difference between your experimental and theoretical approach?
- How do the experimental and theoretical probabilities compare with your original hunch?
Dice Differences
This is a game for two players.
- Draw a grid as below.
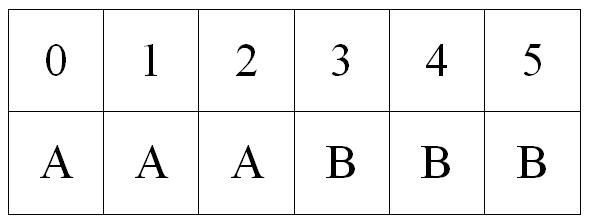
- Roll two dice and the subtract the smaller score from the larger. If the result is 0, 1 or 2, then player A wins. If the result is 3, 4 or 5, then player B wins.
- Discuss:
- How could the PPDAC cycle be used to investigate Dice Differences?
- What problem could be investigated?
- What is your hunch about who is most likely to win?
- Is the game fair? If it is not, then how could you make it fair?
The same approach used with “Marble Snap Revisited” may be used here also. Start with a class discussion of how we can investigate the probabilities of the game. Ensure that students are clear that to know whether a game is fair they need to determine if there are equal chances of each player winning. Also discuss the need to use both theoretical and experimental approaches in order to verify solutions. The same format should be used for recording their work, such as the PPDAC cycle. Discuss the desirability to record the number of times each score is rolled, rather than just the number of times a player wins the game.
If students use an experimental approach, scaffold them with questions like:
- How will you record the results?
- Are you recording how often each number turns up?
- What do you think of these results?
- Do they mean that the game is fair?
- What would happen if you did the experiment again?
- How could you improve the experiment?
It may be useful to hold a class discussion and summarise the experimental results from the whole class in order to determine the long-run frequencies for 0, 1, 2, 3, 4 and 5.
If students use the grid method to investigate the theoretical probability, scaffold them with questions like:
- What numbers are on the first die?
- Can you write those possibilities across the top of the grid?
- What numbers are on the second die?
- Can you write those possibilities down the side of the grid?
- If you rolled a three with the first die and a five with the second, what is the difference in score?
- Where should you write this outcome on the grid?
- How many different outcomes are there?
- What is the probability of getting a score of zero etc?
- How many of the outcomes belong to player A?
- What is the probability of player A winning?
If students use the tree diagram method to investigate the theoretical probability, scaffold them with questions like:
- What numbers are on the first die?
- Can you write those possibilities as the first level of a tree diagram?
- What numbers are on the second die?
- If you rolled a three with the first die, what might you roll with the second die?
- Can you write those possibilities as the second level of the tree diagram?
- On this diagram can you follow the branches through to list the outcomes
- How many different outcomes are there?
- What is the probability of getting a score of zero etc?
- How many of the outcomes belong to player A?
- What is the probability of player A winning?
It is useful to record how often each event occurs rather than just which player won, as it enables the number of times each event occurs to be compared directly with the theoretical probability for that event.
Reflection
- Hold a class discussion where students present the results from their investigation into “Dice Differences”.
Was the game fair?
Which player stood the best chance of winning?
How do you know?
What happened when you carried out an experiment?
Can you explain what the theoretical probability is of player A / B winning?
Was there much difference between your experimental and theoretical approach?
How do the experimental and theoretical probabilities compare with your original hunch?
How could we make the game fair?
There are many different ways in which the game can be altered to make it fair.
P(0) = 6/36
P(1) = 10/36
P(2) = 8/36
P(3) = 6/36
P(4) = 4/36
P(5) = 2/36
We might give player A the odd numbers, or just 1 and 2, or 0, 1 and 6 etc.
The AND/OR game
The AND/OR game is a game for two players, A and B, played with a grid like the one below, and three counters. The game requires two spinners like the ones below, with paper clips to spin on them, or two modified dice with sides 1,1,1,1,1,3 and 1,1,1,1,1,5. Students will follow the PPDAC cycle to investigate the OR game first, determining whether the game is fair. Then they will investigate the AND game, and compare the probabilities of the two games.
What problem could you investigate about the probability of the OR game? What problem could you investigate about the probability of the AND game?
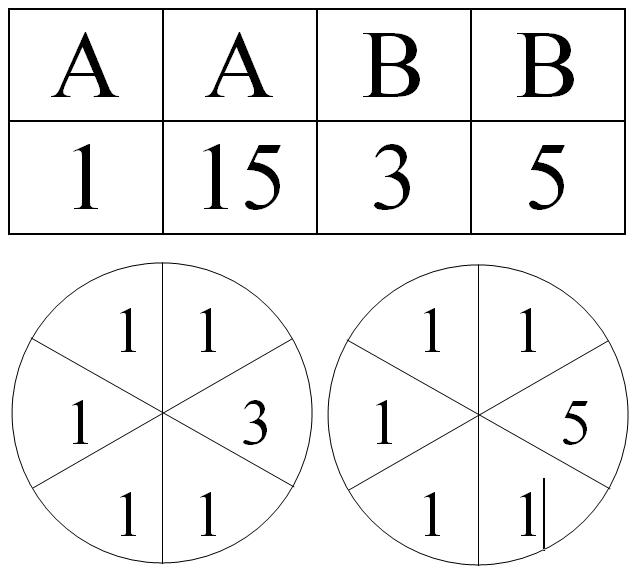
The OR game: The spinners are both spun (each player can spin one spinner, using a pen to hold a paper clip in the centre of the spinner, the paper clip is then flicked, recording the sector it lands in), or the two dice rolled. The product of the two resulting numbers is found. If the product is 1 OR 15, then player A wins. If the product is 3 OR 5, then player B wins.
What is your hunch about who is most likely to win?
The AND game: The spinners are both spun or the two dice rolled. The product of the two resulting numbers is found, but in this game each player must get both their numbers to win. Player A must get 1 AND 15 to win. Player B must get 3 AND 5 to win. If the product is 1 or 15, then player A covers that number with a counter. If the product is 3 or 5, then player B covers that number with a counter. The first player to cover both of their numbers wins.
What is your hunch about who is most likely to win?
If students use an experimental approach, scaffold them with questions like the following:
- How will you record the results?
- Are you recording how often each number turns up?
- What do you think of these results?
- Do they mean that the game is fair?
- What would happen if you did the experiment again?
- How could you improve the experiment?
- Are the probabilities of player A winning the same for the AND game and the OR game?
It may be useful to hold a class discussion and summarise the experimental results from the whole class in order to determine the long-run frequency.
If students use the grid method to investigate the theoretical probability, scaffold them with questions like:
- What numbers are on the first die or spinner?
- Can you write those possibilities across the top of the grid?
- What numbers are on the second die or spinner?
- Can you write those possibilities down the side of the grid?
- If you rolled a one with the first spinner and a five with the second, what is the outcome?
- Where should you write this outcome on the grid?
- How many different outcomes are there?
- Are the probabilities of player A winning the same for the AND game and the OR game?
- Can you determine the probability of Player A winning the OR game?
- Can you determine the probability of Player A winning the AND game?
If students use the tree diagram method to investigate the theoretical probability, scaffold them with questions like:
- What numbers are on the first spinner?
- Can you write those possibilities as the first level of a tree diagram?
- What numbers are on the second spinner?
- If you spun a three with the first die, what might you spin with the second spinner?
- Can you write those possibilities as the second level of the tree diagram?
- On this diagram can you follow the branches through to list the outcomes?
- How many different outcomes are there?
- Are the probabilities of player A winning the same for the AND game and the OR game?
- Can you determine the probability of Player A winning the OR game?
- Can you determine the probability of Player A winning the AND game?
Reflection
- Hold a class discussion where students present the results from their investigation into the AND/OR game.
Is the OR game fair?
Is the AND game fair?
Are the probabilities of winning the same for the AND game and the OR game?
Can you determine the probability of Player A winning the OR game? How do you know?
Can you determine the probability of Player A winning the AND game? How do you know?
What happened when you carried out an experiment?
How do the experimental and theoretical probabilities compare with your original hunch?
Can you explain why the probability of Player A winning the AND game is not the same as Player A winning the OR game?
Why is the theoretical probability of winning the AND game too difficult to work out?
What is the probability of Player A winning the AND game?
The OR game is a straightforward game like Dice Differences, where the event of a player winning is determined by one event. The AND game is a game with complex probabilities. The chance of winning the AND game is primarily determined by the probability of the rarest of the possible events, since common events like (1, 1) are repeated without affecting the probability of winning. Working out the probability of winning the AND game requires a more sophisticated use of probability trees than is available to students at level 5 in the curriculum. Using a probability tree which ignores repeated outcomes (since they don’t affect who wins) the probability of player A winning is 0.2396 (4dp) and 0.7604 (4dp) for player B winning, but students are not expected to work this out. The key concept here is for students to understand that the probabilities of AND games are different to the probabilities of OR games, and to realise that in some situations, experimental estimates of probability are the best way to find the probability of an event.
The Three Coin Game
A final activity is “the three coin game”. This is also a game for two players and is played on a board as illustrated below. It could also be used as an assessment.
One person to be A, and the other is B.
Play the game on this board, using a counter and a coin: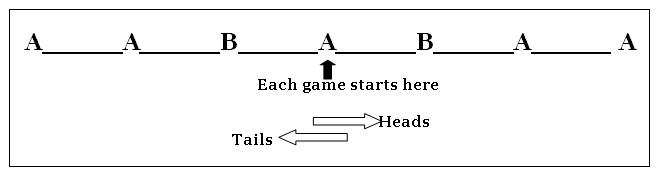
Rules of the game:
- Player A tosses a coin
- Player B moves the counter, starting at the central “A”. Move one space to the right for a head and one space to the left for a tail.
- A tosses the coin again and B moves the counter right for a head or left for a tail.
- A tosses the coin a third time and B moves the counter right for a head or left for a tail.
- If you end up on an “A” after the three tosses, player A wins. If you end on a “B”, then player B wins.
- Each player records the outcomes and winner of each game.
- Start the next game back at the central “A” again.
Students could investigate “the three coin game” using the PPDAC cycle, recording their hunch about the probability of a Player winning.
What problem could you investigate about The three coin game?
What is your hunch about the probability of player A winning?
If students use an experimental approach, scaffold them with questions like:
- How will you record the results?
- What do you think of these results?
- What would happen if you did the experiment again?
- Is the game fair?
- How could you make the game fair?
It may be useful to hold a class discussion and summarise the experimental results from the whole class in order to determine the long-run frequencies for wins for Player A and Player B. Students should realise that the game is not fair, and that some locations on the game line are impossible.
If students use the grid method to investigate the theoretical probability, scaffold them with questions like:
- What are the possible results for the toss of the first coin?
- Can you write those possibilities across the top of the grid?
- What are the possible results for the toss of the second coin?
- Can you write those possibilities down the side of the grid?
- If you have made a grid for the first two coin flips, how can you include possibilities for the third coin flip? (make two grids, one for heads on the third coin, one for tails)
- How many different outcomes are there?
- What is the probability of player A winning? Of player B winning?
- Is the game fair?
- How do the experimental and theoretical probabilities compare with your original hunch?
If students are using the tree diagram method to investigate the theoretical probability, scaffold them with questions like:
- What are the possible results of the first coin toss?
- Can you write those possibilities as the first level of a tree diagram?
- What are the possible results of the second coin toss?
- Can you write those possibilities as the second level of a tree diagram?
- What are the possible results of the third coin toss?
- Can you write those possibilities as the third level of a tree diagram?
- On this diagram can you follow the branches through to list the outcomes?
- How many different outcomes are there?
- What is the probability of player A winning? Of player B winning?
- Is the game fair?
- How do the experimental and theoretical probabilities compare with your original hunch?
Reflection
Hold a class discussion where students present the results of their investigations into The Three Coin Game.
- How did the results of your experiment compare with the theoretical probability you calculated?
- How do the experimental and theoretical probabilities compare with your original hunch?
- What did you learn?
- What is the probability of player A winning? Of player B winning?
- Is the game fair?
- How could you make the game fair?
Dear families and whānau,
As part of our mathematics programme we have been investigating the results of theoretical and experimental approaches to games of chance. Ask your child to teach you one of the games we have explored in class, and to tell you about the probability of winning the game