This is a level (2+ to 3+) mathematics in science contexts activity from the Figure It Out series.
A PDF of the student activity is included.
Click on the image to enlarge it. Click again to close. Download PDF (1579 KB)
Students will:
- read a linear scale on a thermometer and record temperatures
- plot 3 series on a time-series graph.
Students should discover that:
- the slope of the graph (which represents the rate of change) is different for each tin
- temperature change is proportional to volume (the larger a volume of water, the longer it takes to heat).
tap water
3 thermometers
a computer spreadsheet/graphing program
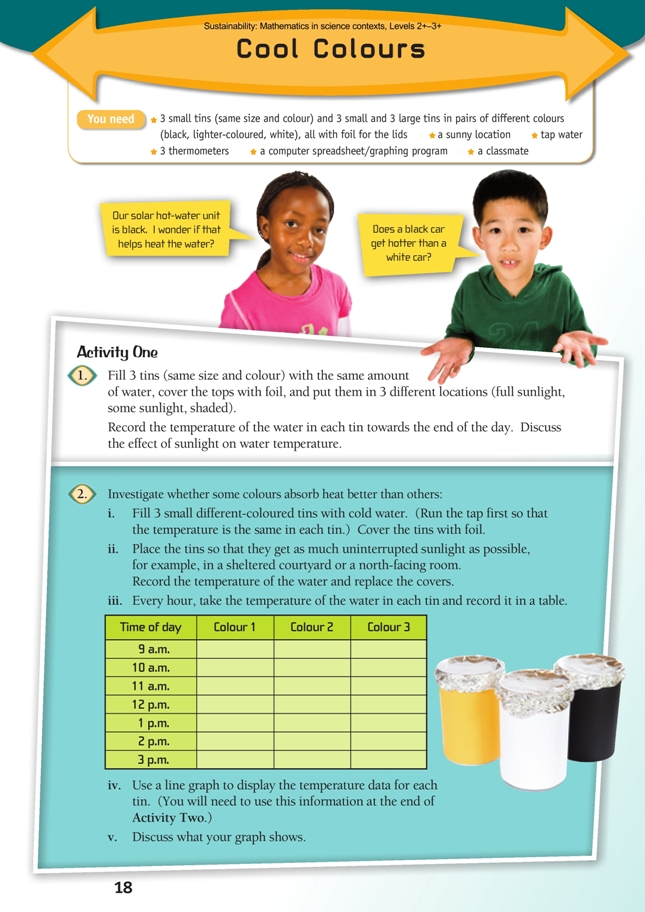
3 small tins (same size and colour) and 3 small and 3 large tins in pairs of different colours (black, lighter-coloured, white), all with foil for the lids
a classmate
FIO, Sustainability, Levels 2+-3+, Cool Colours, pages 18 - 20
Preparation
Try to find a spot that gets consistent sunshine throughout the day. Alternatively, run the experiment indoors using 3 identical desk lamps, each focused on a different tin.
The tins should be the same size, of the same material, and painted with acrylic art paint or tightly wrapped with coloured material. They need to be covered by lids made of foil or plastic wrap, with the same kind of lid for each tin. For Activity Three, catering tins are suitable containers.
The 3 colours need to be quite distinct; the darkness is more important than the shade. For example, 3 blue tins are fine as long as one is very light blue, one medium blue, and one very dark blue.
The students should ensure that the sides of the tins, not just the foil, receive plenty of sun. The foil will reflect light and heat away from the water (have an insulating effect).
This is a practical activity that will require students to work well together, listen actively, and contribute ideas. As they do so, they will be using and developing the key competency participating and contributing.
Points of entry: Mathematics
This activity exemplifies the stages of the statistical enquiry cycle: problem (Does colour affect heat
absorption?), plan, data gathering, analysis, and conclusion. Reinforce this framework with your students at every opportunity. They won’t always go through the complete cycle, but they should always be able to see how what they are doing fits into it.
Once the students have done the observations in the Investigation, they graph their data and are challenged to look for and interpret patterns. A pattern is a line of any kind, a cluster or clusters of any kind, any regular/ repeating feature. Where there is a pattern, there is something interesting going on – there must be a cause.Learning to look for patterns and possible explanations is a crucial part of statistical learning.
In this context, the students create a time-series graph and are given two others. In all 3 graphs, the data points for each tin form a line. These lines rise at different rates as they go from left to right. In the third graph, the lines head downwards at the end. In no case do the lines in a graph cross each other. These are the patterns that all students should be able to identify and describe.
Interpreting the patterns involves going a step further. A rising line always means that the variable (in this case, temperature) is increasing; a descending line means it is decreasing. The steeper the line, the faster the increase or decrease. If a line is horizontal, the variable is constant (not changing). When interpreting graphs, the student needs to know the context and read the labels on the axes.
In each of the 3 graphs in this activity, one line climbs higher and faster than the others; this line represents the temperature of the darkest coloured tin. Not only does this tin get hottest, it gets hotter faster. It is very important that students can relate the lines to what is happening to the water in the tins.
Have the students compare their results with those of other groups and try to explain any differences. (Did some groups position their tins next to a light-painted wall that was radiating extra heat? Did some sit their tins on grass and others on concrete? Did groups use different paints? Did groups take water from different taps?) You could use this to discuss the idea of fair testing (see the glossary in Forces). Ask How would changing [a particular variable] affect the results?
Points of entry: Science
Tap into the students’ prior experience of colour and heat absorption. Ask: On a very hot day, what is it like walking barefoot on asphalt/concrete, light concrete/dark concrete? Why is white a good colour to wear on a very hot day? Why are so few houses painted in dark colours?
See the answers for an explanation of why dark colours absorb light and light colours reflect light. Relate this to the students’ experience of the glare that comes off very white surfaces when the sun shines directly on them.
Probe the students’ ideas about heat transfer. Ask How is the water getting heated inside the tins? (The sunlight heats the surface of the tin by radiation, and then the warm metal heats the cool water by conduction.) This difference can be illustrated by holding your hand near a light bulb (radiant heat) and then touching the body of the lampshade (conduction).
In Activity Three, the students should discover that the large tin did not get as hot as the smaller container. Large volumes heat more slowly.
As a science extension, students could investigate some of the interesting properties of water. It has a high specific heat, which gives it relatively unusual heating properties. It is slow to heat up and slow to cool down, and at phase changes (freezing or boiling), it maintains a constant temperature. That is, once it starts to boil, it remains at 100º Celsius until it is completely boiled away.
Answers
Activity One
1. Practical activity. You should find that the water in the tins that were in the sun or part-sun is
warmer than the water in the tin that was in the shade.
2. Results and discussion will vary. Water from the tap is typically around 15 or 16°C. Over the
course of the day, the water in each tin will heat up but at different rates for each colour. Darker
colours will tend to heat up faster (absorb heat better) than lighter colours.
Activity Two
1. a. The rate of temperature rise will decrease, and the water will stop getting warmer. If the cloud persists, the water may start to cool.
b. If the air temperature (ambient temperature) is greater than that of the water, the air will gradually warm the water. But the air can’t make the water any hotter than itself. When the air temperature drops, the water will cool until it is no warmer than the air.
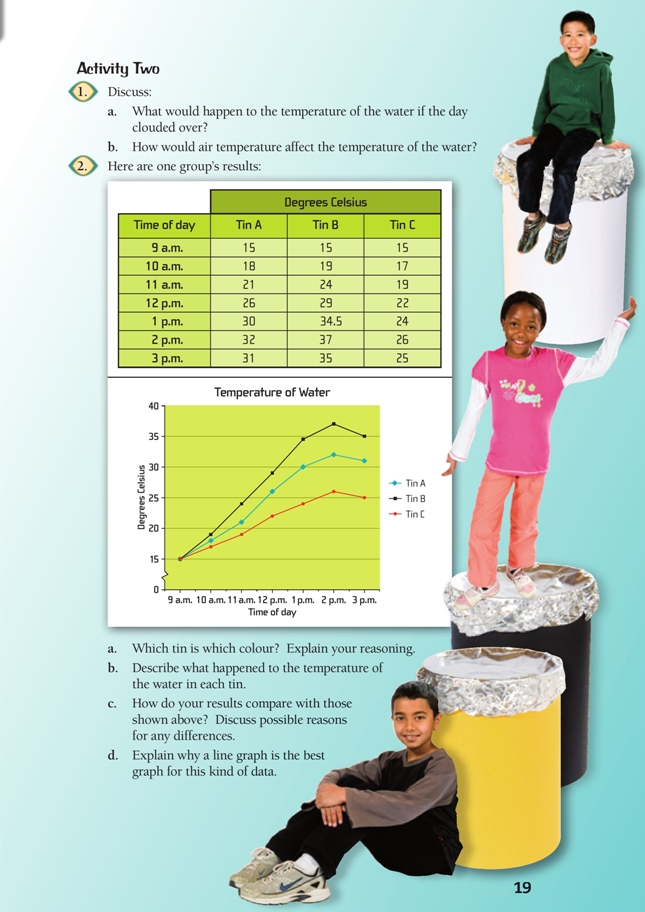
2. a. The darkest tin is the top line (tin B) and the lightest tin is the bottom line (tin C). This is implied by findings from the investigation: dark colours absorb more heat than light colours.
b. The temperature of all 3 tins started at 15°C, increased to a peak about 2 p.m., and then cooled slightly. Tin B warmed up faster and reached a higher temperature than tin A, which was faster and hotter than tin C.
c. The results of your investigation should be similar, but the slope of the lines will vary depending on the colours used, the volume of water, and exactly how sunny the day was. On a really hot, sunny day, water temperatures will increase rapidly, while on a cool cloudy day, the temperatures may not
change much at all.
d. The data was gathered over time (from a series of observations), so it is best shown as a time-series graph (a particular type of line graph). The 3 series or data sets (the different tins) can conveniently be plotted on the same set of axes.
Activity Three
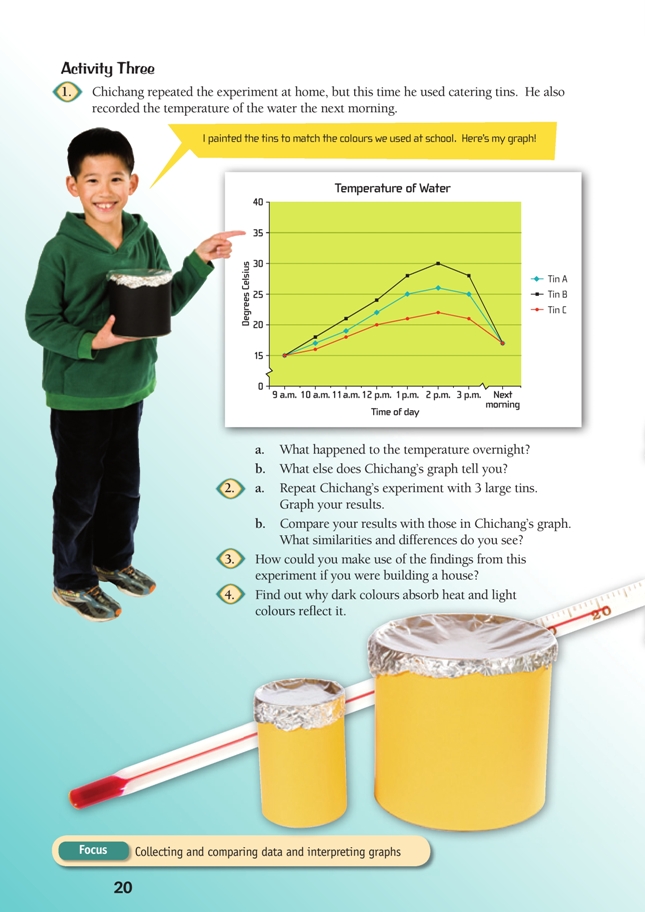
1. a. All the tins cooled down to the same temperature (17°C). (This would have been the ambient [air] temperature, which was slightly higher than the initial water from the tap.)
b. The larger tins didn’t heat up quite as much as the smaller tins – the maximum temperature was 30º (compared with 37º). The next morning, the temperature of the water was slightly higher than that of the initial tap water, which suggests that the ambient temperature was about 17°C in the morning.
2. a. Graphs will vary, but they should be similar in shape to the graph shown.
b. The actual temperatures that you record will depend a lot on your local weather conditions; your tins may be hotter or cooler. The lines on your graph should look similar to those on Chichang’s graph, but their slopes will vary depending on how sunny the day was. (On very hot, sunny days, the tins will absorb more heat, with the result that water temperature will increase much more rapidly.)
3. If you wanted maximum warmth, you could paint the roof a dark colour. If you wanted your house cool, you could paint the roof white or silver.
4. What we see as colour is a measure of how well the surface reflects light.
If light of all wavelengths is absorbed, none comes back to the viewer, so the surface appears black. If all wavelengths are reflected, all light bounces off the surface and right back at the viewer, so the object appears white.
This is why the Moon, which doesn’t generate any light of its own, appears white in the sky but goes “away” during the lunar cycle. When the rays of the Sun reach the Moon, the Moon reflects them back to us. When the Moon moves behind Earth (it’s in Earth’s shadow), no light is reflected back to Earth and the Moon blends into the black night sky.
For coloured objects, only some wavelengths are refl ected and we see only those. Different
wavelengths have different colours.
To summarise: light-coloured objects are light because their material is reflecting almost all
wavelengths, so very little light is absorbed by (and therefore heats) the material. Dark-coloured
objects refl ect almost no light, so most of it is absorbed as heat.