Long-term Plan Mathematics and Statistics
School: Rongopai Middle School
Year: 20XX
Team/Syndicate: Tui (Rooms 5, 6, 7)
Classes: Year 8
School Philosophy (from School Implementation Plan)
Rongopai Middle School seeks to provide high quality opportunities to learn Mathematics and Statistics. Principles that guide our approach are:
- Realistic Contexts – the use of real life and imaginary contexts to support our students to appreciate the important role of Mathematics and Statistics for modelling the world they live in.
- Equity – the selection and adaptation of tasks to make them accessible to all students, and the monitoring of achievement to check that all students are making significant progress over time.
- Expectations – the belief that Mathematics and Statistics can be learned by all students given appropriate experiences, at a level that is defined by the New Zealand Curriculum as fitting for their age and class.
- Communities of learning – the structuring of learning experiences that position other students as ‘expert others’ and provide students with the chance to work collaboratively in groups, and independently.
- Understanding and procedures – the balancing of the relationship between knowledge of facts and procedures, and the development of rich, connected concepts through problem solving and investigation.
- Representation – the application of a broad range of representations, including materials, words, pictures, diagrams, and symbolic systems, as tools for communicating Mathematical and Statistical ideas, solving problems, and thinking further with concepts.
- Digital technologies – these technologies enhance students’ opportunities to learn when they are used to connect multiple representations, to engage students in predictive thinking, and to free up working memory for higher order thinking.
Rationale (Team Syndicate)
Achievement Data
Two main sources of data are used to evaluate relative strengths and weaknesses in achievement; PACT analysis against the Learning Progressions Framework, and norm referenced data from Progress and Achievement Testing (PAT). These sources are used to target aspects of Mathematics and Statistics that warrant emphasis, and identify target groups of learners for additional support. PAT was used in late February and the results used to validate decisions made from the PACT data. Adjustments to the long-term plan were made at that point and are discussed below.
Learning Progressions Framework (and Curriculum Levels)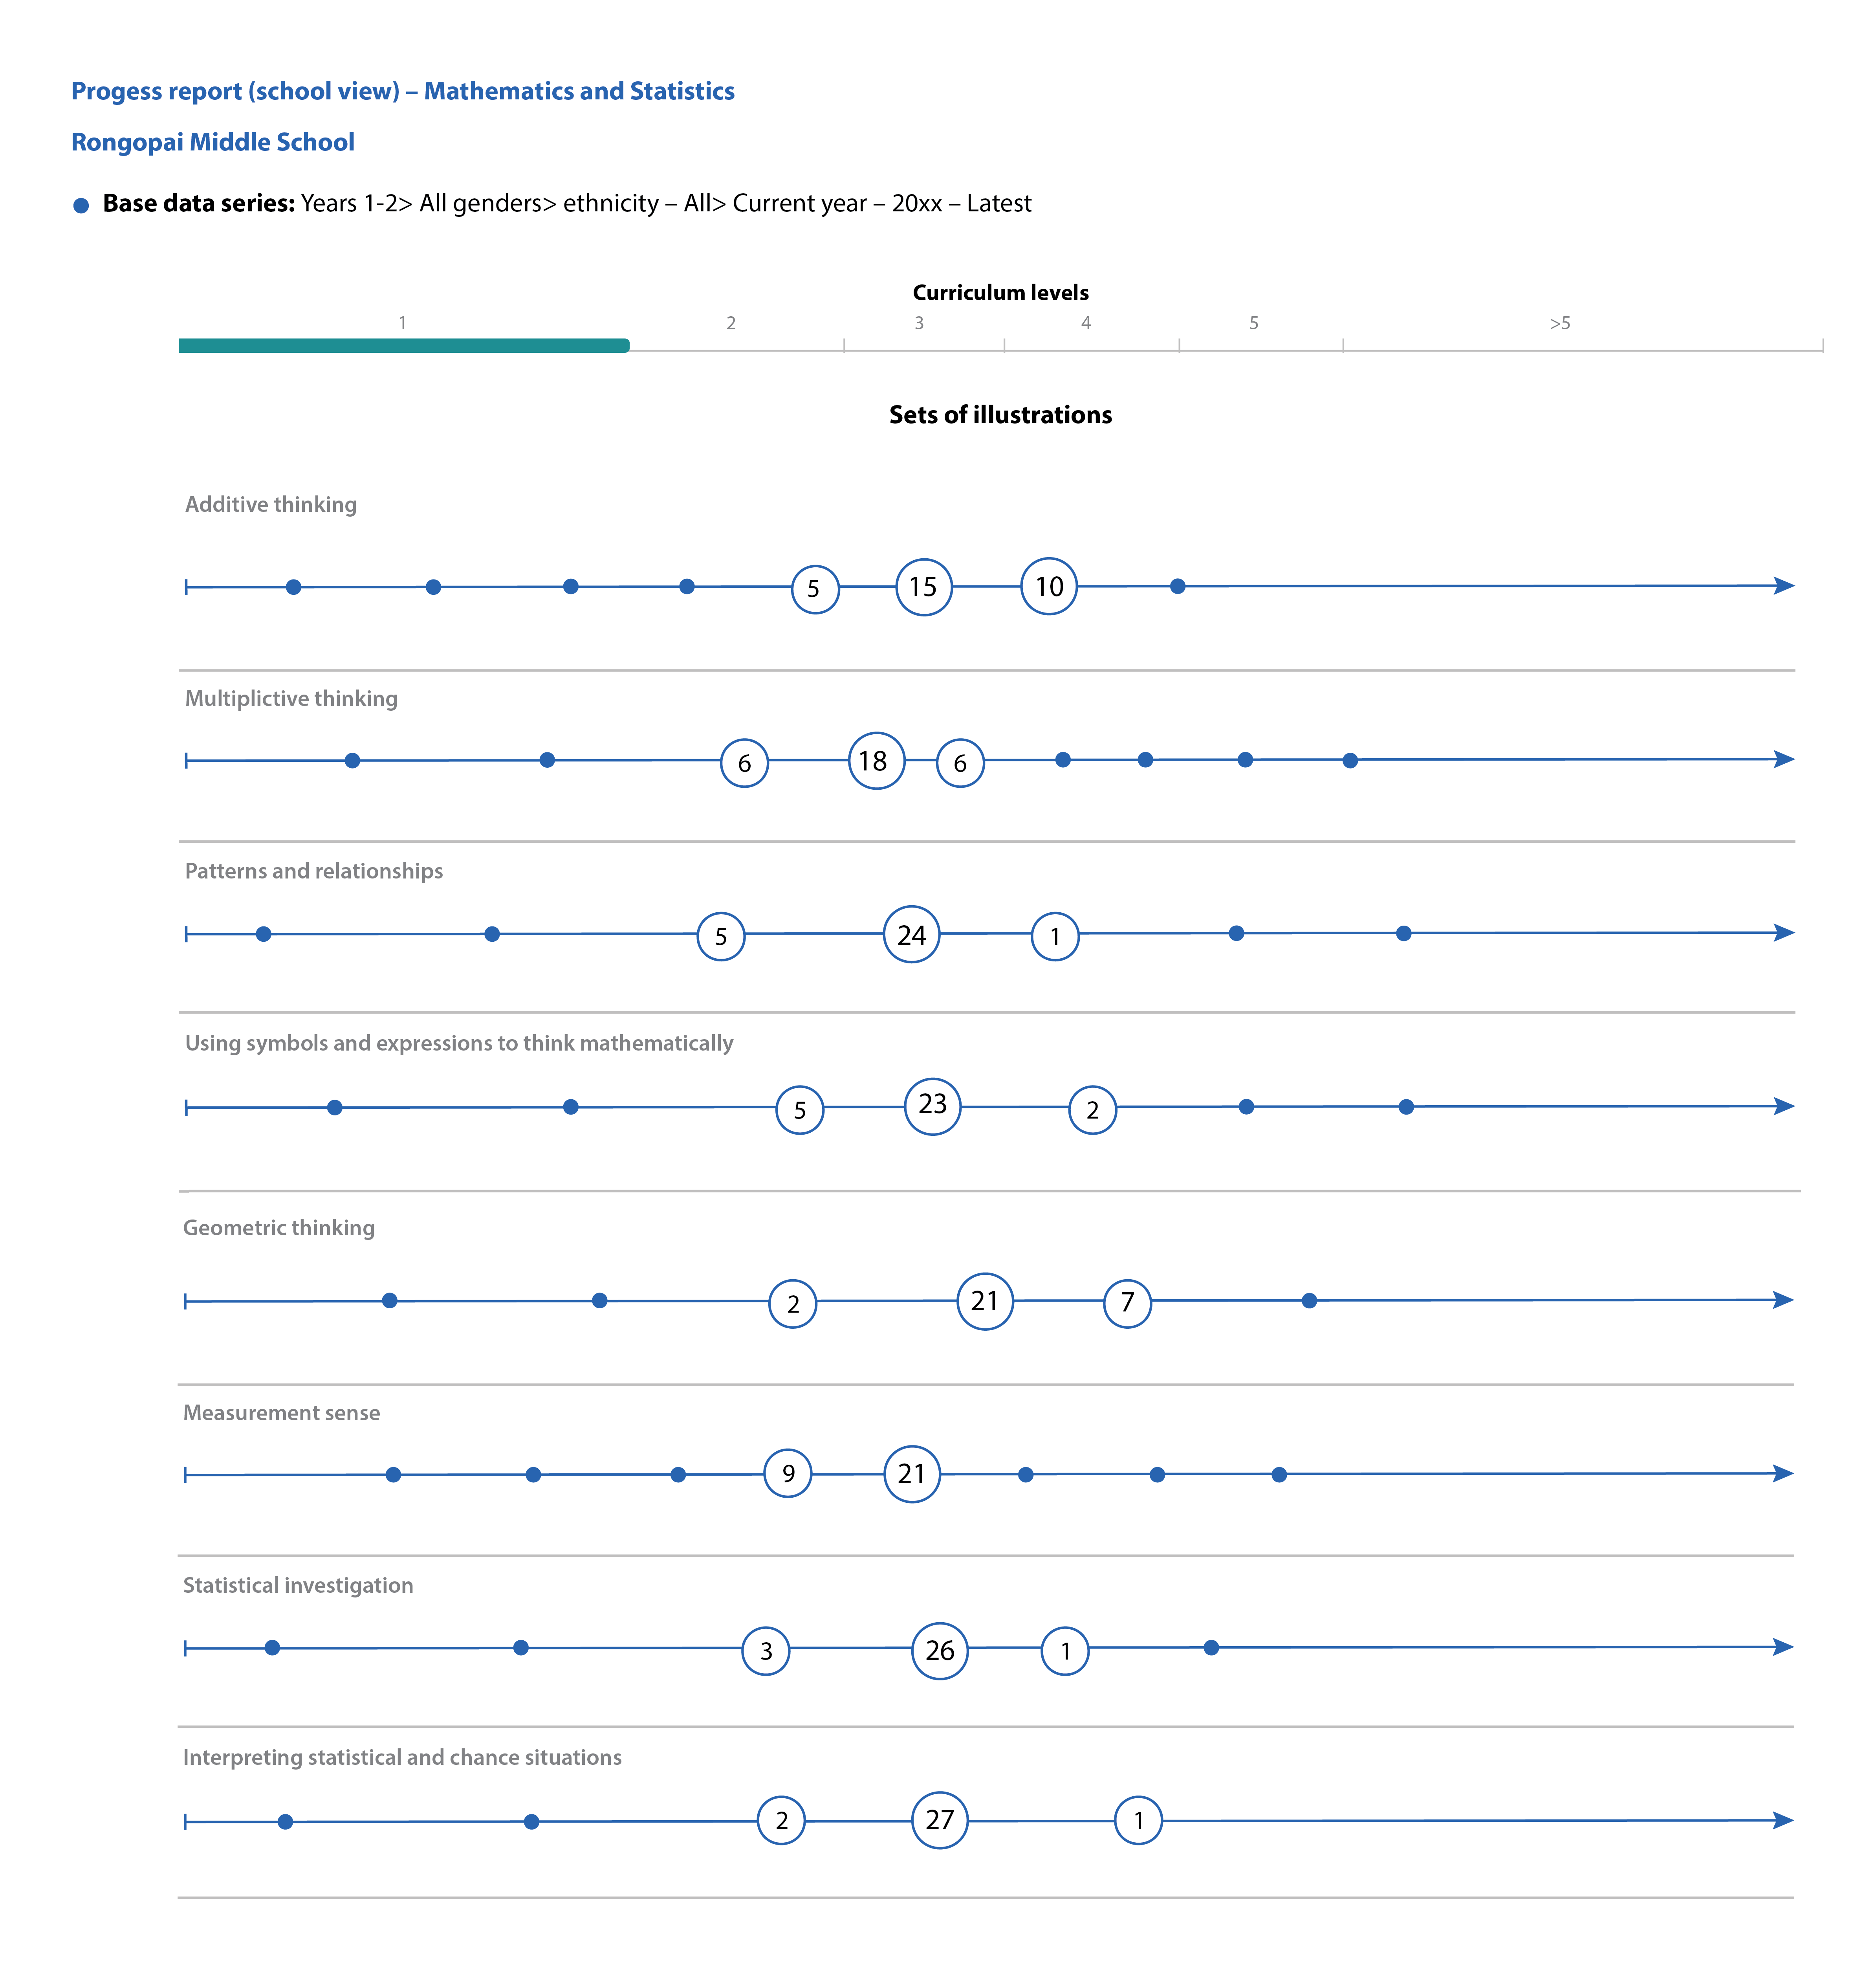
Late last year teachers of our students provided their best judgements for each student in relation to all aspects of The Learning Progressions Framework. These judgments were available for analysis using the PACT tool. The PACT reporting tool was used to look at patterns of progress by aspect and to identify target groups of students in each class, those at risk and those who are high achieving.
Progress reports were created for each class then compared to establish strengths and weaknesses across the aspects (See figure to the right. Click on the image to enlarge it. Click again to close).
Distributions were viewed to ascertain the proportions of students working at expected levels, three and four, of The New Zealand Curriculum (NZC). These data suggest that collective achievement at the beginning of the year can be summarised in the table below:
|
Aspects below expectations |
Aspects at expectations |
Aspects above expectations |
|
Multiplicative thinking |
Additive thinking |
Geometric thinking |
Those aspects listed as below expectations are identified as priority areas for unit planning in Terms One and Two. A re-evaluation of learning priorities will take place mid-year to inform unit planning in Terms Three and Four.
Target Groups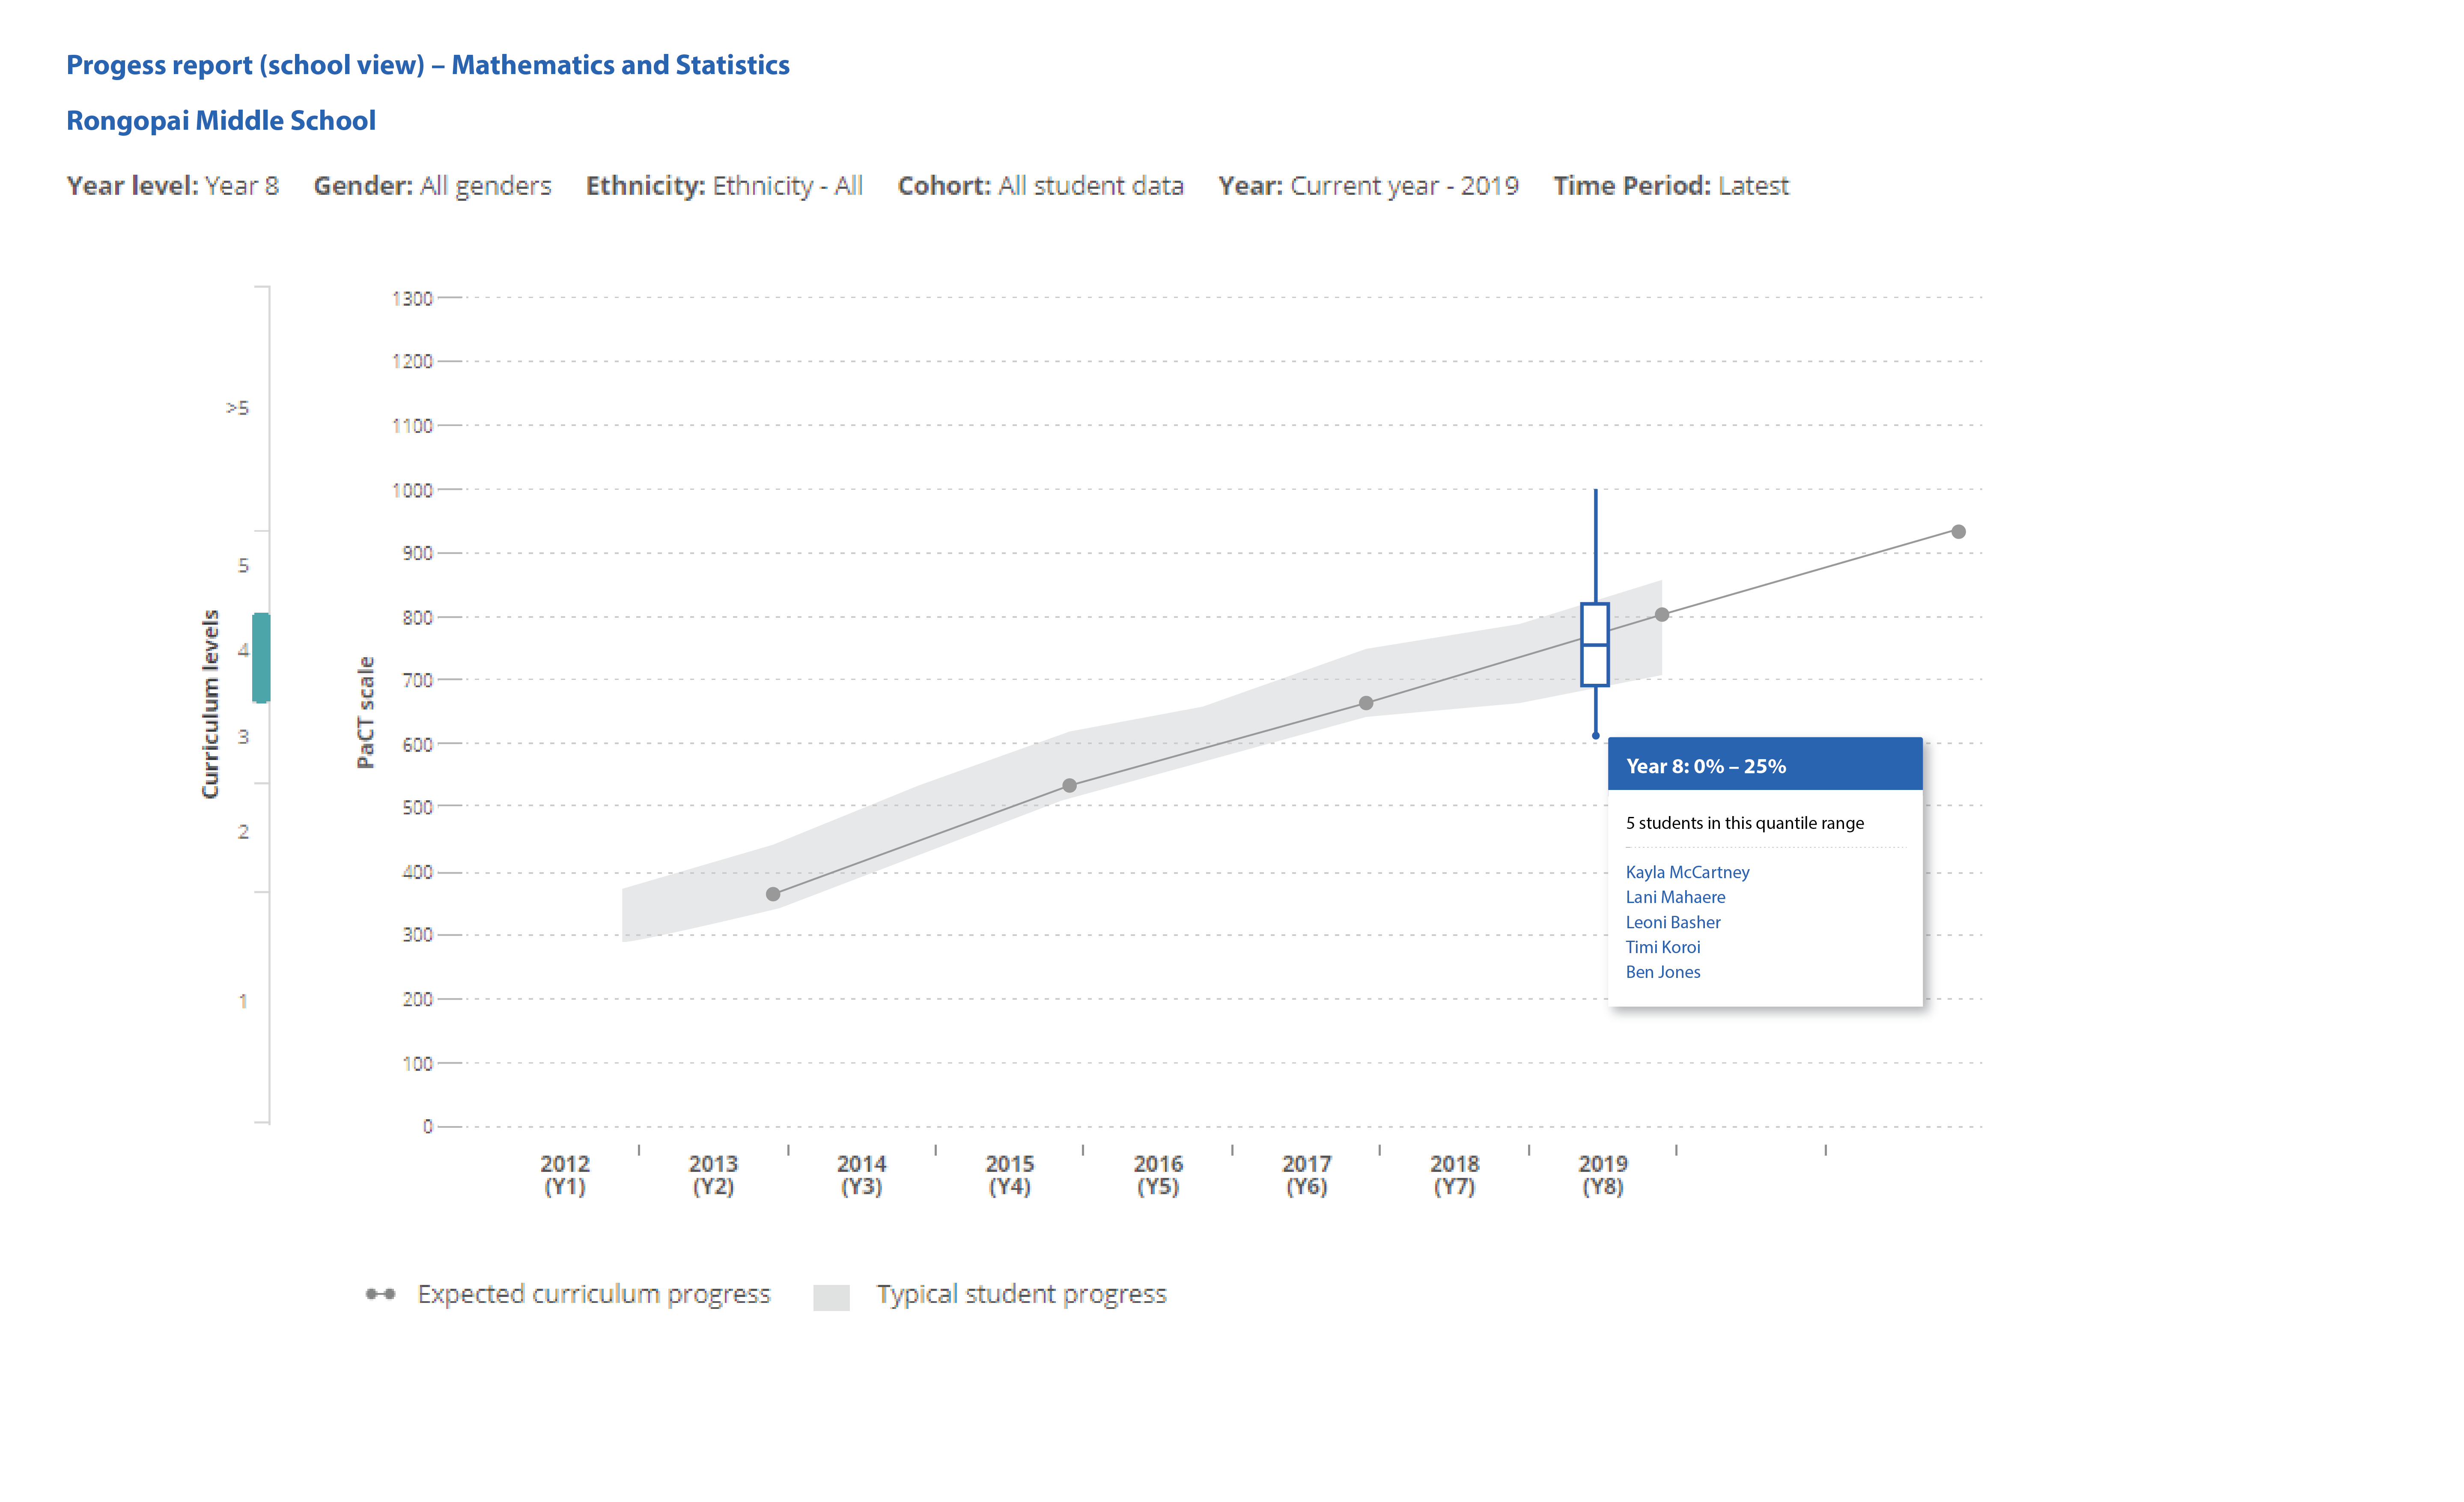
PACT progress reports are used to identify target groups for each class. The figure to the right (click to enlarge, click again to close) gives an example of a class progress report. Students in the quartile 0% - 25% for Year 8 were classified as potentially ‘at risk’ and in need to additional support in class to improve their progress. Students in the 75% - 100% quartile for Year 8 are identified as potentially needing extension work to sustain their progress. Both target groups are checked against PAT data at the beginning of March to support judgments from PACT.
The target groups are:
|
Room 5 |
Room 6 |
Room 7 |
|
At Risk Teri Sullivan |
At risk Lew Brooks |
At risk Kayla McCartney
|
|
Extension Kelly Ahipene |
Extension Jill Wagstaff |
Extension Su-Lee Chan |
Progress and Achievement Tests
 Students sat Mathematics PAT tests at the beginning of March. Most students attempted the Year 8 form, and the students designated as ‘at risk’ were given the Year 6 form. Both tests give students a PATM scale score, so the Year 6 form was designed to give those students greater accessibility and success.
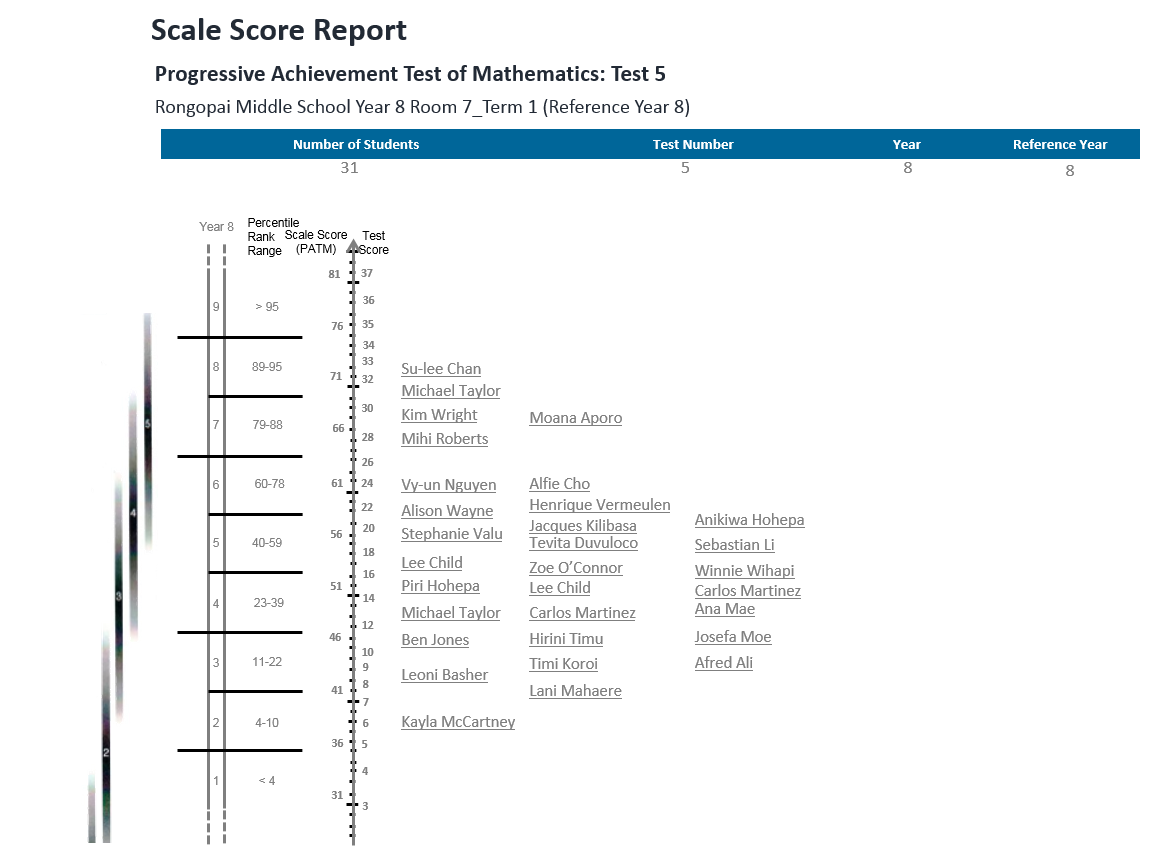
PAT results are analysed in three ways; support the previous PACT judgments, confirm areas of strength and weakness, and check the makeup of target groups. PAT scale reports are created for each class (see figure to the right; click to enlarge, click again to close). The data show that the pattern of judgments against PACT aspects are reasonably consistent with PAT results, but are mostly conservative. For example, most students in Room 7 are assigned steps at Level 3 of the New Zealand Curriculum yet generally score in the Level Four band for PAT.
The item analysis report from the PAT test (PDF, 122KB) confirms the general strength of students in Geometric Thinking and sound achievement in Statistics and Additive Thinking with whole numbers. The relative lower achievement in Multiplicative Thinking and Measurement Sense are also confirmed. Success rates for items involving fractions, decimals, percentages and ratios are well below expectations for Year 8. The algebra items for PAT indicate misconceptions with the equals sign, and weakness in the generalisation of sequential patterns.
Long Term Planning Decisions
Our syndicate prioritises topics for units based on the following criteria:
- Areas of mathematics and statistics identified in the data where achievement of our students is relatively weak.
- Our collective knowledge about sensible sequences of learning experiences, for example, multiplicative thinking strongly supports understanding of equivalent fractions, decimals and percentages.
- Interests of our students, and occasions that are significant cultural events for our school community, for example, Matariki is celebrated in late Term Two every year.
We did not include a statistical investigations unit of work in this plan as an investigation planned as part of a Health and PE unit on advertising and food choices provides an opportunity to notice students' capability in the two statistics aspects.
The long term plan for terms one and two (PDF, 101KB) includes hyperlinks to units of work; each unit is mapped against the aspects of the LPF, and against the strands and achievement objectives from the NZC. This was made by filling in the school's long-term planning template (docx, 19KB).
The sequence of units for term three and four will be determined late in term two and will be dependent on students’ progress as well as the need to balance across aspects of the LPF. We anticipate that a focus on decimals, percentages, operations on fractions, decimals and percentages, geometry, statistical investigation and probability will be needed. For each unit, links to other related resources and assessment suggestions (PDF, 219KB) have been collected in a separate document.