This unit analyses and extends a game of chance using both experimental and theoretical probability.
- Find the theoretical probability of an event occuring.
- Use more than one way to find a theoretical probability.
- Check theoretical probabilities by trials.
- Identify what a fair game is and how to make an unfair game fair.
This unit involves five key ideas:
- Calculation of theoretical probabilities.
- Trialling to estimate probabilities.
- Calculating expected values.
- Experimental results vary from predictions based on theoretical probability.
- Fairness of a game.
Calculating theoretical probabilities involves finding all the possible outcomes and establishing the fraction of all outcomes which result in a specific event occuring. Tools to find all the possible outcomes include tree diagrams of counts, tables, and network diagrams.
In most real-life situations involving elements of chance, it is not possible to calculate a theoretical probability. However, it is possible to estimate probabilities by using experiments. Conducting lots of trials can provide an approximation of the fraction of events that are of interest. A trial is a single occurrence of the situation. Generally, undertaking more trials increases the reliability of the probability estimates.
The learning opportunities in this unit can be differentiated by providing or removing support to students and by varying the task requirements. Ways to differentiate include:
- physically acting out the game to get a sense of the possible events that can occur
- developing students’ concepts for fractions, decimals and percentages in more tangible contexts before working on probability
- using collaborative groups so students can discuss, and explain ideas, and justify claims using mathematical and statistical reasoning. Organise these groups to be composed of students with mixed levels of mathematical confidence and knowledge to encourage these collaborative learning processes
- choosing simpler situations than the four-cube game to use at first, to establish models for all possible outcomes, such as tree diagrams.
The context for this unit is a set game provided by the teacher. You might choose games that students are more familiar with to develop probabilistic thinking, such as two up, snakes and ladders or Yahtzee. You might also frame playing the game in contexts that are familiar to your students, such as fundraising or adventure chases. Consider also game-related contexts that are relevant to current learning from other curriculum areas, current events, and your local community. The idea of unfair/fair games could be related to a class or school-wide games competition, to games at a school fair, or to sporting events from throughout history.
Te reo Māori vocabulary such as kauwhata porowhita (circle graph, pie graph), kauwhata pou (bar graph), tūhuratanga tauanga (statistical investigation), pāpono (event, probability), hoahoa rākau (tree diagram) could be introduced in this unit and used throughout other mathematical learning.
- PowerPoint
- Spreadsheet
- Sufficient multi-link cubes so that each group of students can have 5 red, 5 blue and 5 green cubes.
- Paper bags to draw the cubes from.
- Calculators.
Session 1
In this lesson we look at the cubes problem.
- Introduce the situation of the bag and the four cubes. You might present it as a game of chance at a fundraiser for Kapa Haka or a sports team. Place two red and two blue cubes in a paper bag. Shake the bag and without looking take out two cubes. A win occurs when two red cubes or two blue cubes come out. A mixed pair of cubes is a loss.
Act out the game a few times so students understand how it works. - Tell the class about Jo and Brian (use the names of students in your class)
Jo says that there are three things that can happen (we will call these events). The three events that could happen are red-red; blue-blue; and red-blue. Jo thinks that the chances of winning are two in three or two thirds. Write the symbol 2/3.
On the other hand, Brian says that the chance of getting a matching pair is one half. He says there are two colours, so each colour has an equal chance of coming out of the bag. - Ask the students to discuss who they think is right. Jo and Brian cannot both be right. In fact, they could both be wrong!
- Organise students into small groups. Provide each group with a paper bag and two red and two blue cubes. Ask the groups of students to play the game and try to find out if Jo or Brian are right, or if they are both wrong.
- As students discuss the problem roam the room. Look for:
- Do students attempt to find all the possible outcomes in some way?
- Do they recognise the difference between an outcome (a specific way the two cubes might come out) and an event (the result of grouping the outcomes, such as two red cubes)?
- Gather the class and discuss their views.
Who wants to share their thoughts about Jo’s argument?
Is she right? How do you know? Justify your view.
Many students are likely to say that Jo is correct. There are three possible events, red-red, blue-blue and red-blue. Acting out the cube drawing confirms that there are only three possible events.
Who wants to share their thoughts about Brian’s argument?
Is he right? How do you know? Justify your view.
Some students are likely to contradict Brian’s idea. They may do so on the basis that the two colours are being mixed together, so the situation is more complicated than one-half same colour and one-half different colours. - Does anyone think that neither Brian or Jo have correct arguments? Please explain.
Some students may attempt to create a model of all the outcomes. That may take the form of a list of possibilities, such as:
First cube Second cube
Red Red
Red Blue
Blue Blue
Blue Red
The list matches the appearance of the events when drawing two cubes and aligns with Brian’s half chance view, since two out of four events are a matching-colour pair. Ask students to conduct a brief experiment with six trials of drawing two cubes. Require a system for recording the results, such as a tally chart that can be added to in Session 2. You may need to model the creation and use of such a system before asking students to create their own.
Red-Red Blue-Red Blue-Blue // /// / - Gather the class to share results.
Are the results for each group the same? Why is there so much variation?
Students might comment that, because luck is involved, they should expect some variation. Others might add that six is a small number of trials and many more are needed to get a pattern. - From our few results does it look like either Jo or Brian are correct?
Extends students’ thinking by asking them to estimate and discuss the proportions for each result, using fractions, decimals, and percentages.
Session 2
In this lesson, we go further with the problem by experimenting to estimate the probability of a win.
- Recap on the problem from the last session and frame it within a relevant, chosen context.
We want to know the probability of getting two same-coloured cubes from a bag containing two red cubes and two blue cubes.
What did we find out yesterday?
Discuss the position students took about Jo and Brian’s claims.
Recall the small trial. What did that show? - One way to estimate the probability of a win is to conduct an experiment. Many of you said six trials was too little yesterday.
How many trials of taking out two cubes will be enough evidence?
Look for students to assert that more trials will give more reliable results. Reliability needs to be balanced with the practicality of the time it takes to a lot of trials. The trial will only give an estimate of the probability, not an exact measure. - Let the students work in pairs to collect evidence by drawing two cubes out of a bag. They should conduct a total of either 24 of 36 trials, including the six results from before. Ask students to record the results using the same tally chart you introduced in Session One.
- As the students work roam the room and look for the following:
- Are they recording the results systematically?
- Are they developing a sense of the relative frequency of outcomes?
- Do they use the language of fractions?, e.g., About one half of results are a mix of colours.
- Bring the students together and record the results using a spreadsheet (see Spreadsheet One). This will allow you to combine all the trials of the class and graph the proportions.
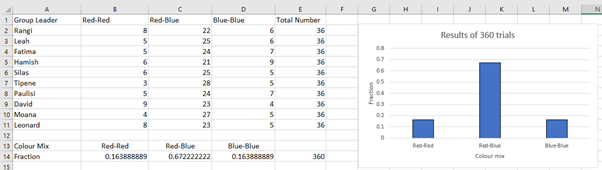
Discuss the results. The spreadsheet displays the fractions as decimals. That make interpretation difficult unless students are familiar with common fraction to decimal conversions. - What do you notice about the results from different groups?
Students should observe variation due to sampling but also recognise that a mix of colours is much more common that both single colour mixes.
Which result should we trust more, the data from one group or from the whole class? Why?
Students are likely to say that the larger sample size is better without full appreciation of long-run frequency.
What fraction of the trials were a win in which both cubes were the same colour?
Students might notice that the fraction of losses was about 0.66. They might also say that the Red-Red and Blue-Blue fractions need to be combined. Add the decimals to find the total is 0.33.
What should the decimals add to? Why?
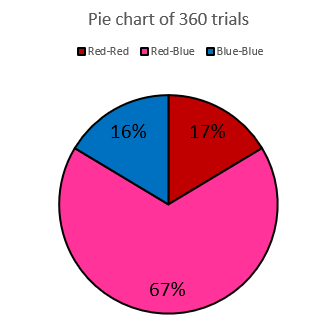
Since the sum of probabilities is always one, the decimals should add to one. - Use the second tab on Spreadsheet One to show the results in a pie chart. Students might see more easily that the fractions for Red-Red and Blue-Blue are about one sixth each. In total the same colour mixes account for about one third of the data. The other two thirds of the data are mixed colour trials (Red-Blue).
Does anything surprise you about the results?
Whose view, Jo or Brian’s, matches the evidence? Explain. - Ask students to write a summary of the investigation so far. Ask them to take a position on the Jo and Brian debate and give reasons for supporting one or none of those views.
Session 3
In this session, students build on the arguments of the last two sessions and attempt to connect theoretical probability with experimental results.
- Act out drawing the first cube out of the bag.
What could this first cube be?
Students will say that the outcome will either be a red cube or a blue cube.
Does it matter which red cube I get or which blue cube I get?
Students will usually say that it doesn’t matter. - Take the cubes out of the bag and put stickers on them. Label one red cube “1” and the second red cube “2”. Do the same thing with the blue cubes then place all four cubes back in the bag.
- What could be the first cube?
Look for students to reconsider the two-possibility idea to include four outcomes, Red 1, Red 2, Red 3, and Red 4.
Animate the PowerPoint to begin a tree diagram of possible outcomes. You might act out drawing the various cubes as you create the limbs to show how each limb represents a physical outcome.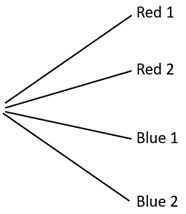
Ask students to copy the diagram. - Act out drawing Red 1 as the first cube. Trace that arm of the tree diagram.
What cube might come out second?
Students should say that Red 2, Blue 1 or Blue 2 might come out. - Animate the PowerPoint to show how all three possibilities can be represented as arms. Ask students to copy the additions to the tree diagram
- Replace the four cubes and draw out Blue 2.
If my first cube is Blue 2 what might the second cube be?
How might I show that on my tree diagram?
Let students attempt the additions before animating the PowerPoint.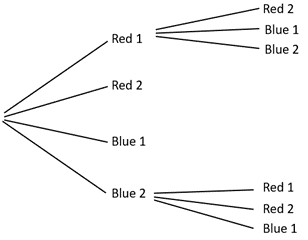
- Ask students to complete the tree diagram and animate the PowerPoint to check their work.
How many possible outcomes are there? (12)
What fraction of those outcomes are wins in the game? (4/12 = 1/3) - Animate the PowerPoint to identify the winning outcomes of two matching colours.
Whose claim, Jo’s or Brian’s, is correct? Is neither person correct?
Students should conclude that neither person is correct since the probability of winning is only one third, not two thirds or one half as claimed. - Show Slides Two and Three of the PowerPoint to show how two other students created models of all the outcomes.
How are all the outcomes shown? (arrows and cells)
Which arrows and cells are wins in the game?
Session 4
In this session students develop the idea of expected values. At this level the expected values are estimated first then experiments carried out to see if the estimate match results from trialling.
- Recap on the four-cube game and what students know about the chances of winning and losing (1/3 and 2/3). Use the Spreadsheet and PowerPoint to refresh their memories about the experimental results and the models of all outcomes.
Do the theoretical models (tree diagram, network diagram, and table) match the experimental results? Explain. - Distinguish between an event, such as two red cubes being drawn, from an outcome, such as Red 1 then Red 2, or Red 2 then Red 1.
Using what you know I want you to make some predictions. Let’s start!
Suppose you played six four cube games.
How many games would you expect to win? How many games would you expect to lose?
Write down your predictions. - Discuss the estimates and why students made them. Look to see that students use the probability of a win or loss and apply the fraction to the number of games. For example, “One third of six equals two so I expect to win two games.” Some students might say that they do not expect the trial results to match the one third and two third expectation. Those students are indicating that they expect variation. You might set up a competition for the best estimator for added motivation.
- Ask six teams to each play one game rather than carry out the trial sequentially.
See how many students predicted the correct number of wins. Extend the predictions to the number of wins expected when playing 12, 18, 24 and 30 games. With ten or more groups in a class, it is quick to carry out these numbers of games. Collate the results in a table:
Number of games Expected value (wins) Experimental value (wins) 6 2 3 12 4 3 18 6 5 24 8 8 30 10 11 - What do you notice in the table?
Students should see that the expected values and experimental values are usually close but there is some variation, especially with smaller numbers of games. Realising that this variation decreases proportionally as the number of games increases is likely to be difficult at this level. - Finally, ask students to predict the number of wins if 600 games are played. Look for an online simulator to use by searching for “Marbles in a bag simulator”. Those tools allow for many games to be played rapidly.
Session 5
In this session students revise the four-cube game to make it fairer.
- Ask students to recall why the game is unfair. That means there is a higher probability of losing than winning.
Today we find other ways to make the game fair. Is there a way to adjust the rules so that the game becomes fair?
Ask students to discuss their ideas in groups. - As a class, discuss the ideas that they produce. Possible alterations include:
- Changing the cubes in the bags, e.g., adding another red cube, removing a blue cube, doubling the number of blue cubes.
- Changing the number of cubes drawn to one or three. That involves changing what constitutes a win.
- Providing prizes for a win that counter the probabilities of losing. For example, $1 to enter and $3 for a win.
- Ask students to choose a variation for making the game fairer.
You need to provide evidence that your change makes the game fairer. Evidence must include:- Experimental results with a lot of trials
- A model of all the outcomes that shows the probability of a win
- A statement that connects the experiment and your model.
- Let students work on their modifications in small teams. Roam as they work. Look for:
- Do students systematically trial the revised game?
- Do they record the results and calculate fractions, possibly as decimals or percentages using a spreadsheet?
- Do they create tree diagrams or other models and interpret the outcomes correctly?
- Do they distinguish outcomes and events?
- Can they express probabilities as fractions?
- Gather the class and create a class display about modifications to the four cubes in a bag game. Consider what means of presentation will enable students to express their mathematical understanding in a meaningful and effective manner (e.g. video, PowerPoint, verbal presentation, infographic, written summary).
Dear parents and whānau,
This week in maths we have been looking at drawing different numbers of coloured cubes from a bag. We calculated the theoretical probability of drawing certain combinations of coloured cubes. We also experimented to check these probabilities. Finally we played games based on this idea and tried to make the games fair.
Ask your child to tell you about the rules of one game that we played and play it with them. Make sure they can tell you when a game is fair and when it is not.
Enjoy investigating probability with your child.