Christmas tree
This problem solving activity has a statistics focus.
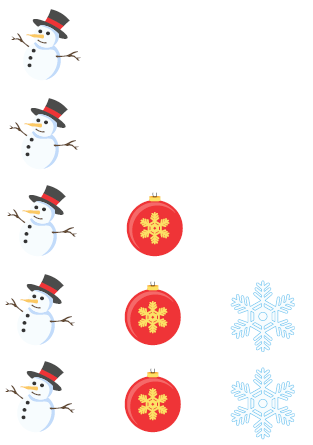
Mum wants to know which decorations she has the most of. Can you help her sort them out?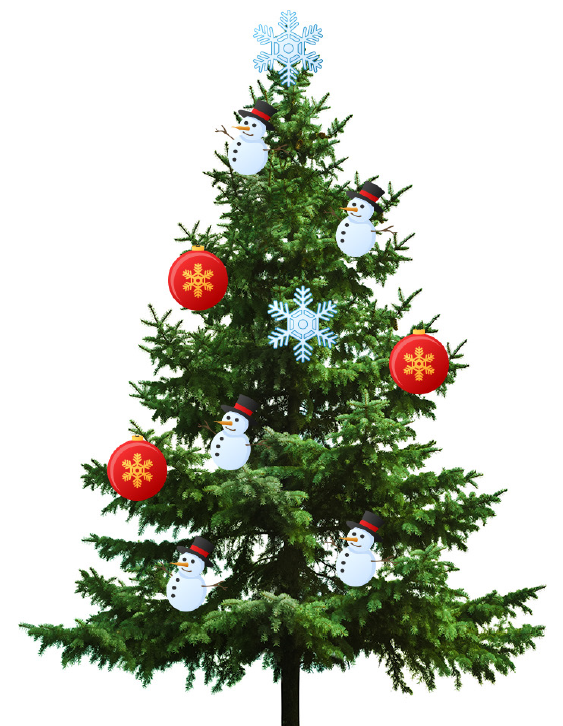
- Sort objects into categories and display the results.
- Count the objects in a category.
- Devise and use problem solving strategies to explore situations mathematically (use equipment).
This problem involves sorting objects into categories and then counting them. This experience is the foundation for displaying data in pictograms.
- Christmas decorations
- Copymaster of the problem (English)
- Copymaster of the problem (Māori)
The Problem
Mum wants to know which decorations she has the most of. Can you help her sort them out?
Teaching Sequence
- Display a box of Christmas decorations (limit to 4 types with fewer than 10 of each). Ask the students for ideas on sorting the decorations so that they could tell someone what was in the box.
- Sort the decorations into types in line with students' suggestions or a method of your own choosing.
- Discuss the results.
- Share ideas for displaying the results – e.g. as a real object "graph".
- Pose the problem for the students to work on. Which decorations does mum have the most of? As they work they may choose to cut out the objects to form groups or they may redraw them.
How are you sorting the decorations?
How many baubles are there?
Which decoration are there the most of? - Share solutions. To prove the solution to the problem you could create a real object or digital picture graph (e.g. on PowerPoint).
Extension
Students can decorate their own Christmas tree, count the decorations, and create a picture graph to show the numbers of different decorations used.
Solution
The decorations which mum has the most of are the snowmen - there are 5 snowmen, 3 red baubles, and 2 snowflakes. There are many ways of displaying the decorations to answer Mum's question. As this problem develops the skills required for graphing the students may decide to cut out the shapes and put them into columns for comparison.