Readers' Polls
This is a level 3 and 4 statistics activity from the Figure It Out series.
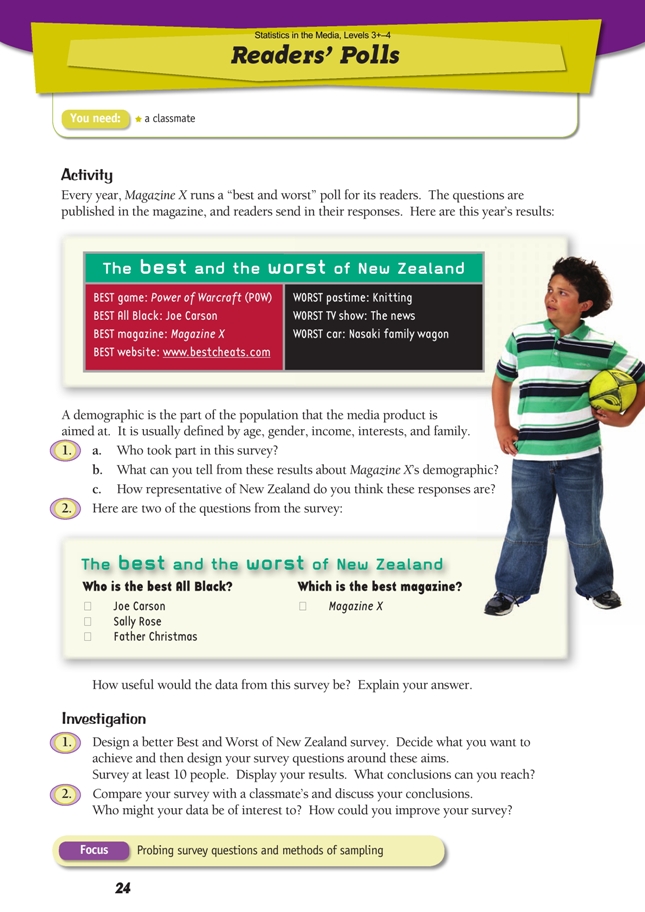
A PDF of the student activity is included.
Click on the image to enlarge it. Click again to close. Download PDF (1125 KB)
critique a survey
design a survey
conduct a survey
collate and display survey results
This diagram shows the areas of Statistics involved in this activity.
.gif)
The bottom half of the diagram represents the 5 stages of the PPDAC (Problem, Plan, Data, Analysis, Conclusion) statistics investigation cycle.
Statistical Ideas
Readers’ Polls involves the following statistical ideas: using samples to make generalisations about populations and exploring representation and survey bias.
A classmate
It is important for students to have some understanding of how information from a sample group can be used to generalise about a population. Generalising can only be done if the sample is representative of the population. Readers’ polls from magazines can only generalise about that magazine’s readership group. Magazine X readers are not representative of the general population. In this magazine, it may be that the readers’ poll is designed to be humorous because the questions are biased and lead the respondent to answer in a certain way. However, the poll can still show the students how bias can impact on conclusions and help them be more discerning in evaluating surveys.
Investigation
Students may enjoy making a deliberately biased survey by asking leading questions and giving limited response options. After they have done this, ask them to rewrite their surveys, removing the bias. They could give both surveys to groups of people and compare the results.
Extension
The students could look for readers’ polls in magazines that they read or have access to. Have them analyse and discuss whether these surveys are unbiased and make conjectures about how representative the results would be of a wider demographic. Have the students complete the surveys, give the same surveys to another demographic group, and compare results.
Answers to Activity
1. a. Those readers of Magazine X who chose to fill in and return the survey (many readers may not have bothered)
b. A likely answer is that the readers are young people, probably young males.
c. The readers of Magazine X are from a specific demographic and don’t represent
the wider population of New Zealand.
2. Not useful at all. The questions and their listed possible answers are narrow and are leading the respondents to answer in a certain way.
Investigation
1. Survey forms and results will vary.
2. Answers will vary. Given the very small sample, this data is unlikely to be of interest to anyone outside the class. You could improve your survey by modifying questions that are not understood or that do not gain useful information. You could improve your data by asking a larger and more representative sample to answer your questions.
Key Competencies
Readers’ Polls can be used to develop these key competencies:
• thinking: engaging in sense making, discerning if answers are reasonable
• using language, symbols, and texts: communicating fi ndings, demonstrating statistical literacy
• relating to others: understanding others’ thinking, accepting and valuing differing
viewpoints
• managing self: reflecting.