Scrum Power
This is a level 5 statistics activity from the Figure It Out theme series.
Click on the image to enlarge it. Click again to close. Download PDF (841 KB)
find mean, mode, median, range of data sets
compare data sets and justify method of comparison
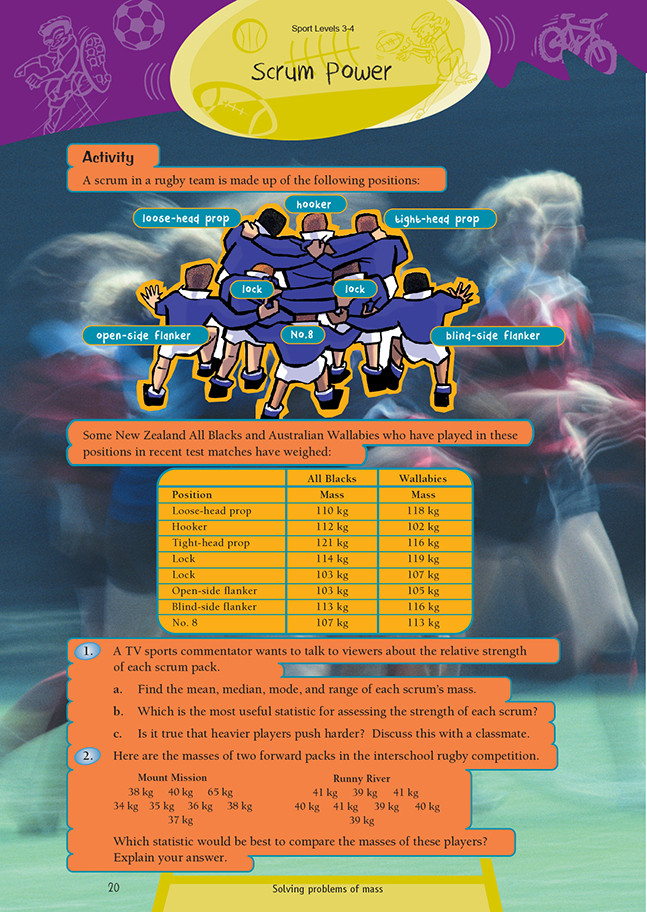
FIO, Levels 3-4, Theme: Sport, Scrum Power, page 20
This activity is based on real data from test matches between the New Zealand All Blacks and the Australian Wallabies. The students could get some feel for how big these forwards are by working out how many of their own classmates would make up a player of that mass. Given that most 10-year-olds weigh about 40 kilograms, most of the players weigh almost three times as much as one student.
The number of pieces of data is small (eight in each set), so finding the mean, mode, and median will only give rough indications of the expected mass of each forward pack because with small samples, each statistic can be distorted quite badly.
The mean or average is found by adding all of the data and dividing this total by the number of data readings or records. So the mean for each pack of forwards is:
All Blacks: 110 + 112 + 121 + 114 + 103 + 103 + 113 + 107 = 883, and 883 ÷ 8 = 110.4 kilograms
Wallabies: 118 + 102 + 116 + 119 + 107 + 105 + 116 + 113 = 896, and 896 ÷ 8 = 112 kilograms
The students will find the median by putting all the masses in order and finding the middle one. There are eight numbers, so the middle will be halfway between the fourth and fifth numbers. So for each team, the median is:
All Blacks: 103, 103, 107, 110, 112, 113, 114, 121. Halfway between 110 and 112 is 111.
Wallabies: 102, 105, 107, 113, 116, 116, 118, 119. Halfway between 113 and 116 is 114.5.
The mode in this case is not useful. The Australian pack has a single most common mass of 116 kg.
This could be taken as an indication of strength, but it does not take the lower masses into account.
In the same way, the mode for the All Blacks is 103 kilograms, which is the lowest mass listed and takes no account of the much heavier masses.
Although heavier packs of forwards are usually able to push harder, many other factors come into the strength of a scrum, for example, fitness and technique. However, the mean is probably the best indicator when comparing pack masses. This is the statistic that broadcasters use.
Question 2 explores how the mean can be distorted by an outlier or extreme score. The presence of a 65 kilogram player in the Mount Mission team skews the mean mass. This gives the Mount Mission pack a mean mass of 40.4 kilograms, while the Runny River pack has a mean mass of 40 kilograms. This is a false picture of pack strength because six of the Mount Mission pack are lighter than their Runny River counterparts. In this case, the median gives a better idea of the pack strength: 38 kilograms for Mount Mission and 40 kilograms for Runny River
Answers to Activity
1. a. For the All Blacks, the mean is 110.38 kg, the median is 111 kg, the mode is 103 kg, and the range is 18 kg.
For the Wallabies, the mean is 112 kg, the median is 114.5 kg, the mode is 116 kg,
and the range is 17 kg.
b. Sports commentators usually use the total pack mass and the mean as an indicator of scrum strength.
c. Heavier players may be able to push harder, but fitness and the way they push
(technique) also have a lot to do with pushing strength.
2. The total mass of each scrum will tell you which of the two packs as a whole has the greater pushing power. Mount Mission has a total mass of 323 kg and Runny River 320 kg. The statistics for the two teams are:
Mount Mission has one player (65 kg) that skews the mean. It tells us that the average mass of the Mount Mission forwards is bigger than that of the Runny River forwards. The 65 kg also means that the range is not useful as a statistic.
However, the mode tells us that most of the Runny River forwards are bigger than most of the Mount Mission forwards. The same is true of the median. Since the Mount Mission scrum has one very big person and the rest are comparatively
small, the median is probably the most accurate statistic to use.