Rent or Buy?
This is a level 5 statistics activity from the Figure It Out theme series.
A PDF of the student activity is available.

Click on the image to enlarge it. Click again to close. Download PDF (629 KB)
calculate mean, median, mode from data tables using calculator
FIO, Levels 3-4, Theme: Moving House, Rent or Buy? pages 2-3
A calculator
A classmate
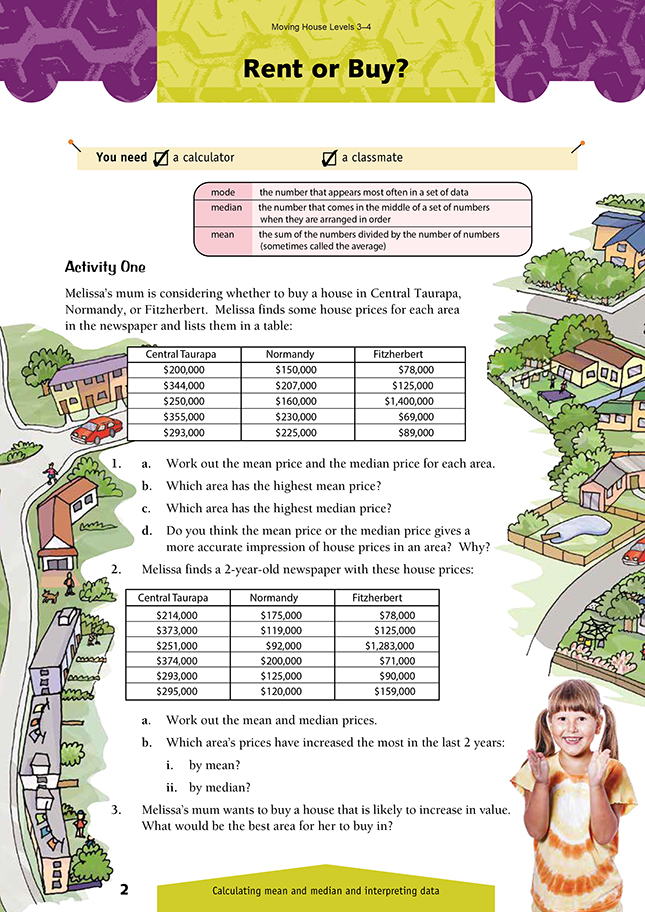
Activity One
This activity requires the students to find the mean (the sum of the prices divided by the number of prices, often known as the average) and the median (the middle value in any ordered list). These measures are specifically identified in a level 5 objective and will require discussion before the students start work. The terms are defined in a panel on page 2 of the students’ book.
The students should list the amounts in ascending or descending order so that they can easily find the median.
Students should realise that both mean and median are best attempts to find a single number to represent a group of numbers. The main disadvantage of the mean is that one unusually big or small number in the group can greatly distort it. The main disadvantage of the median is that it totally ignores all numbers in the group except the middle one. Both are used in real life, and students need to understand the difference so that they are not misled by statistics in advertising or propaganda.
Fitzherbert is clearly an area of modestly priced houses. This is evident from the median but not from the mean, which is severely distorted by one house priced at more than 10 times any other advertised property. For this reason, the median is a better indicator of house prices in the area.
Let your students explore how to manipulate the numbers in one of these lists (for example, Normandy), without altering (i) the mean, (ii) the median, or (iii) both. They will discover that as long as the total of the asking prices remains the same, so will the mean, and as long as the middle value in the list is unchanged, the median will remain the same.
In question 2b, the answer is Normandy in both cases. However, be careful when discussing question 3. The students should note that six house sales is a very small statistical sample on which to base judgments or make projections. They should also note that house prices cannot be guaranteed to increase in line with the current trend. A downturn in the national economy, or local factors such as the closure of a major industry, or the development of a new access road or motorway bypass, can impact heavily on property values and sales.
Activity Two
This activity is an exercise in comparing the costs of renting and buying. This time, the students compare the mean and mode (rather than the mean and median, as in Activity One). They may find it easier in question 1 to list the weekly rents in order before working out the mode (most common value) and mean. This scenario is, of course, a simplified one: it ignores the fact that a person buying a house ends up with a valuable asset while the person who rents has nothing to show for the years of payments.
In question 2, the students need to note that the costs relate to different periods ($800 per month, $195 per 2 months, and $1,000 per year). In the third column, they calculate the yearly equivalent for each cost.
To compare renting and buying, the students first need to either convert weekly rent to yearly rent or divide the cost of owning a house by 52 to get the weekly cost.
When doing question 3, the students may find it helpful to make another chart using the new data.
Investigation
The students could explore the first part of question 1 by using the For Rent section of the classified advertisements in the newspaper or by contacting a local real estate agency that manages rental properties. Newspapers also regularly publish tables showing the number and value of house sales in their readership area; these could provide the data needed for the second part of this question.
The students need to think about the statistics such tables present. Do they use the mean or median sale value? Why is this? These pages also often show the percentage increase or decrease in sale value from one period to another. More able students could do a study of one of these tables and present the data graphically, using a computer spreadsheet. In question 2, the students think about the advantages and disadvantages of renting and buying. There are opportunities to go into the
issues as deeply as you or the students wish. They may like, for example, to investigate what difference it makes if they start saving for a house early on in their earning career.
Links
This activity could form part of a unit on Safeguarding Consumers.
The students imagine that their family is moving to a town in Queensland, Australia and needs to rent a property. Using the Internet, they investigate how their family could go about finding and choosing a suitable property. What factors should they take into account? The students should consider the possible pitfalls and the safeguards that are available to protect them during and after the process.
Suggested achievement objectives are:
Social Studies
• how and why individuals and groups seek to safeguard the rights of consumers (Resources and Economic Activities, level 4)
• why and how people find out about places and environments (Place and Environment, level 4).
Answers to Activities
1. a.
b. Fitzherbert
c. Central Taurapa
d. The median price gives the more accurate impression, because one very high or very low price, such as the $1,400,000 house in Fitzherbert, can push up the mean price in what is evidently a cheaper area.
2. a.
b. (i) Normandy
(ii) Normandy
3. Normandy, because prices there are rising the most. If current trends continue, it will show the biggest increase in the foreseeable future.
Activity Two
1. a. $260
b. $270
2. a.
b. Owning a house is cheaper unless the rent is less than $235 per week. Both the mean annual rent (52 × $260 = $13,520) and the mode annual rent (52 × $270 = $14,040) are higher than the annual cost of owning a house. Note that this excludes the deposit needed to buy a house.
3.
Now the annual cost of owning a house is $13,450, but this is still cheaper than the mean annual rent. Weekly rent would need to be less than $258.65 to be cheaper than the cost of owning.
Investigation
Answers will vary.