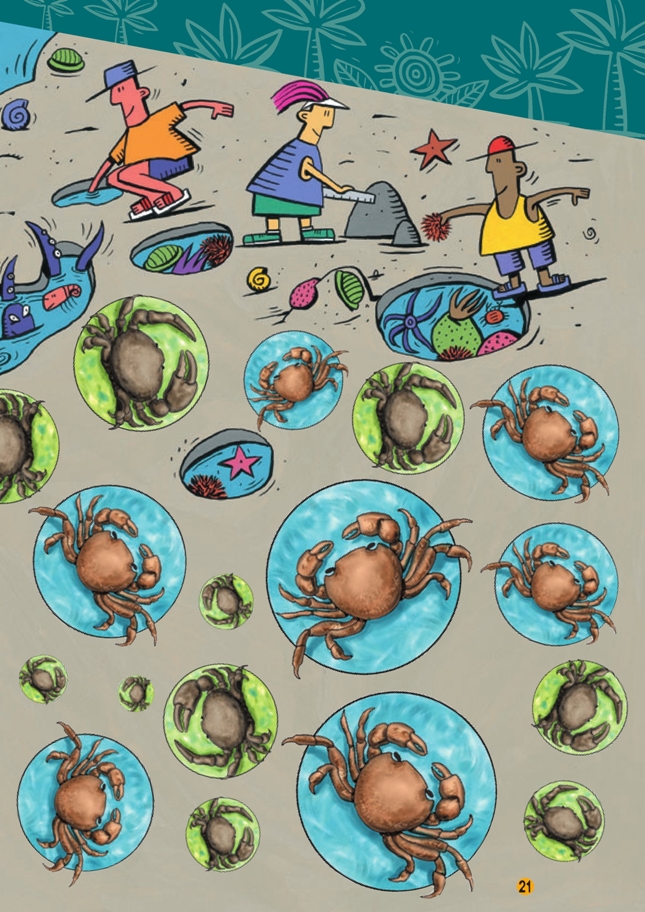
Claws!
This is a level 4 measurement and statistics activity from the Figure It Out theme series.
A PDF of the student activity is included.

Click on the image to enlarge it. Click again to close. Download PDF (918 KB)
interpret a tide chart
measure in millimetre with a ruler
create a graph to show data
A ruler
Students must interpret the scale of the tide timetable correctly to work out the actual time for low tide. This can be done using the symmetry of the tide curve. Look at a portion of the tide timetable:
The low-tide time gives the line of reflective symmetry in the curve. As can be seen from the portion of the curve above, this is just after 12 p.m., probably about 12.15 p.m. By similar reasoning, the low tide for tomorrow will be about 1.45 p.m. (The tides get a bit later each day, so the curve will not have perfect reflectional symmetry.) The period of time between 1 p.m. and 2.30 p.m. tomorrow is
probably the best time to explore the pools because it does not clash with lunchtime. (See the Ministry of Education’s Making Better Sense of Planet Earth and Beyond [Wellington: Learning Media, 1999] pages 94, 95, and 100 for cross-curricular links with tides and moons.)
For question 2, be sure that students measure the crabs in millimetres. This is a good time to remind them that the prefix milli means one thousandth, so there are 1 000 millimetres in 1 metre. Centi means one hundredth, so there are 100 centimetres in 1 metre.
The data gathered is numeric, so the stem-and-leaf graph and dot plot are the most suitable graphs for students of this level. Students may like to draw different graphs for the two different species of crabs.
For the stem-and-leaf graph, all the measurements have a tens digit and a ones digit. The tens digits 0, 1, and 2 are the stem. The ones digits are the leaves:
The boxed digits show how a 15 millimetre measurement would be recorded.
A dot plot resembles a number line with dots used to show the number of crabs that have measurements of that size.
A more advanced graph of this data is called a histogram. In this type of graph, the x axis (horizontal axis) shows the measurements divided into bands and the y axis (vertical axis) shows the numbers of crabs.
The number of crabs in each band is known as the frequency. The band goes up to, but does not include, the number that starts the next band. For example, there are four crabs shown in the 10–15 band. This does not include the 15 millimetre crab.
Histograms are used to show continuous data, that is, data that can take any value within a range. Measurement data is usually continuous. Discrete numeric data has a restricted number of values. For example, the number of people in a household must always be a whole number (1, 2, 3, …), so this numeric data is discrete.
Answers to Activities
1. Between approximately 11.30 a.m. and 1 p.m. today or between 12.45 p.m. and 2.15 p.m. tomorrow. (Both times would clash with lunch, but the programme could be altered to suit.)
2. Practical activity. Measuring the crabs accurately is difficult, so measurements may
vary from student to student. A dot plot of the crab sizes could look like this:
A stem-and-leaf graph could look like this:
A histogram could look like this: