Where to?
This is a level 3 statistics activity from the Figure It Out theme series.
A PDF of the student activity is included.
Click on the image to enlarge it. Click again to close. Download PDF (309 KB)
interpret data from a tally chart
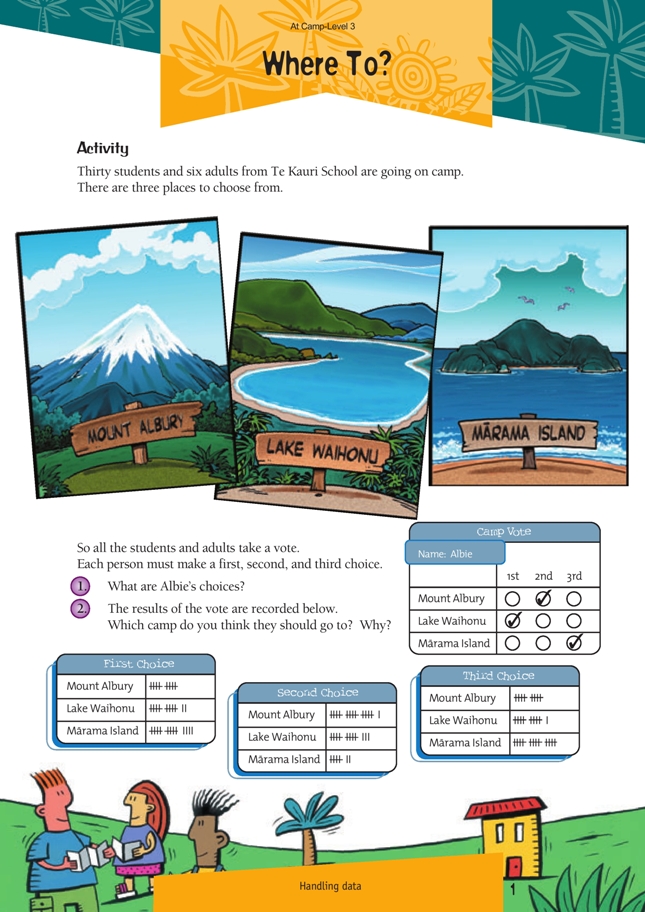
To solve this problem, students will first have to interpret the tally charts that show how many first, second, and third choices each location received. Some students may not realise that is the tally mark for five. Its likely origin is a hand of fingers with the thumb crossed over the palm to signify a complete five.
Students can decide which campsite is most popular in a number of ways. These include:
• based on the most popular first choice (In this case, Màrama Island would win because it has 14 first votes to Lake Waihonu’s 12 votes and Mount Albury’s 10 votes. Under this system, Màrama Island is preferred by a narrow margin.)
• based on the least popular third choice (Using this system, Mount Albury would win because only 10 people voted for it as third choice, as opposed to 11 people for Lake Waihonu and 15 people for Màrama Island.)
• based on a weighting given to each vote, for example, three points for a first choice, two points for a second choice, and one point for a third choice.
Under this system, Lake Waihonu would win by a narrow margin.
Students should realise that, as these three methods show, there is no clear favourite.
Answers to Activity
1. First choice: Lake Waihonu
Second choice: Mount Albury
Third choice: Màrama Island
2. Answers will vary depending on the method used to work out the favourites, for example, based on the most popular first choice, based on the least popular third choice, or using a weighting system. There is no clear favourite.