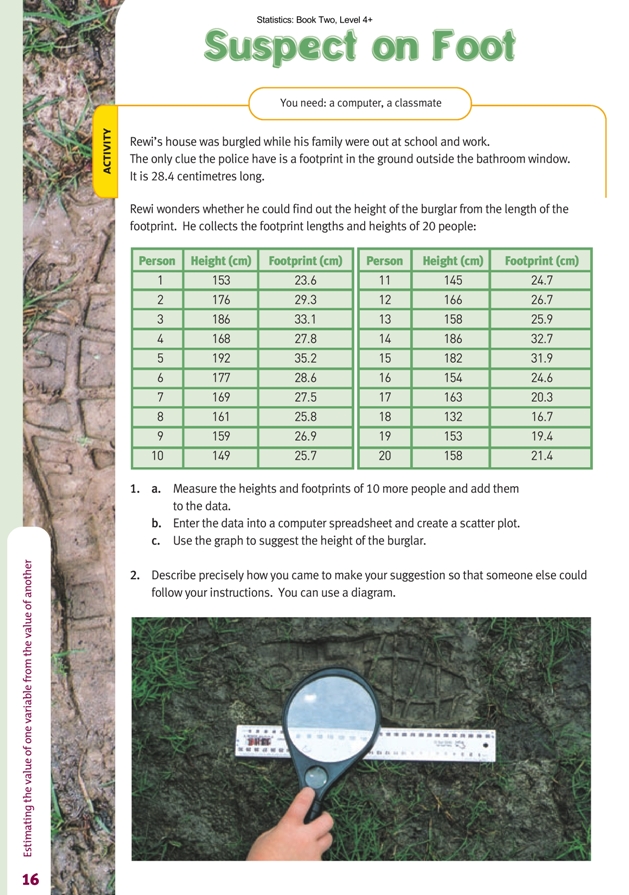
Suspect on Foot
This is a level 5 statistics activity from the Figure It Out series.
A PDF of the student activity is included.
Click on the image to enlarge it. Click again to close. Download PDF (637 KB)
create a scatter plot
interpret information from a scatter plot
FIO, Level 4+, Statistics, Book Two, Suspect on Foot, page 16
A classmate
This activity introduces students to the idea that scatter plots can be used to find relationships between two sets of data (in this case, between height and footprint length). Data of this kind is said to be bivariate.
Because scatter plots plot a point for each individual piece of data, it is easy to see whether there are any patterns in the data. If there were none, the data would be spread evenly across the entire area of the graph.
Wherever the points “bunch” (that is, where they are more dense) or form a line of any sort, the pattern suggests a relationship.
This leads to the concept of correlation, that is, the relationship or connection between two sets of data. For instance, does height increase as foot size increases? If so, there is said to be a positive correlation between these two variables. If one thing decreases as another increases, there is said to be a negative correlation. Often there is no correlation at all.
Where there is a correlation, the students should be wary of assuming that a change in one variable is causing a change in the other. Correlation does not imply causation. A third factor may be influencing both variables. For example, a person may find there is a correlation between their indigestion and their consumption of sundried
tomatoes. But the cause of the problem may be the olives that they always eat when they eat the tomatoes.
When the students are entering their data in a spreadsheet (question 1b), they should work down the spreadsheet until all 30 rows of data are in place. (The data in the students’ book has been shown side by side to save space.)
Question 1c asks the students to use their graph to make predictions about height based on footprint length. Ask them to manually put a trend line on their scatter plot before they get the computer to do this so that they can compare the two lines. For information on trend lines, see the notes for Wim’s Waffles (page 4 of the students’ book).
When estimating the height of the burglar, the students should give a range rather than a precise value. This recognises the fact that, while there is some connection between height and footprint, it can’t be expressed as a precise rule.
Once they have established that there is some kind of relationship, the students could extend their trend line to predict the height of someone with much bigger feet than those shown. This is known as extrapolation (the making of predictions that go beyond the range of available data). Making predictions within that range
is known as interpolation.
Answers to Activity
1. a. The additional 10 measurements will vary.
b. Graphs will vary, but they should be similar to this one:
c. Somewhere between 165 and 178 cm would be reasonable. (See the graph below, where the shaded area shows this range.)
2. Answers will vary. A possible answer is: mark the line that best fits the trend of the data on the graph; find 28.4 cm on the footprint axis; go horizontally to the line you have drawn, then down to the height axis; and read the approximate height off your graph. Allow a reasonable range on either side of this value because there is
no precise link between foot size and height.