Open or Closed?
This is a level 2 and 3 statistics activity from the Figure It Out series.
A PDF of the student activity is included.
Click on the image to enlarge it. Click again to close. Download PDF (1564 KB)
investigae open and closed survey questions
construct a graph
This diagram shows the areas of Statistics involved in this activity.
The bottom half of the diagram represents the 5 stages of the PPDAC (Problem, Plan, Data, Analysis, Conclusion) statistics investigation cycle.
Classmates
Activity One
This activity helps the students to differentiate between closed and open questions. The simplest closed questions are those that require a yes/no (or sometimes, a yes/no/don’t know) response. A poll of class members, using a single closed question (for example, “Do you have a pet?”) would immediately show the limited value of data gained in this way.
Question 1 shows that closed questions limit the kinds of responses people can make. This is often an advantage. It certainly makes the collation of category data* much easier. But care needs to be taken when deciding on the options that are to be offered. If the options offered do not cover the needs of most respondents, people will get frustrated and refuse to take the survey seriously, or they will choose the “other” category. If lots of people choose the “other” option, this undermines the value of the rest of the responses. The risk of this happening can be reduced
by trialling survey questions before using them. This will usually reveal badly worded questions (“What is this question asking?”) and shortcomings in the options being offered (“I can’t tick any of these answers.”).
Activity Two
Activity Two is designed to get students thinking about the wording of questions and the options made available. Questions 1 and 2 illustrate the importance of identifying the purpose for which information will be used rather than haphazardly dreaming up questions and options. The students get the opportunity to take this learning into account and to consolidate their understanding when they conduct their own small surveys in the Investigation.
Answers to Activities
Activity One
1. The range of possible favourite colours is limited, so it would not be diffi cult to list them all.
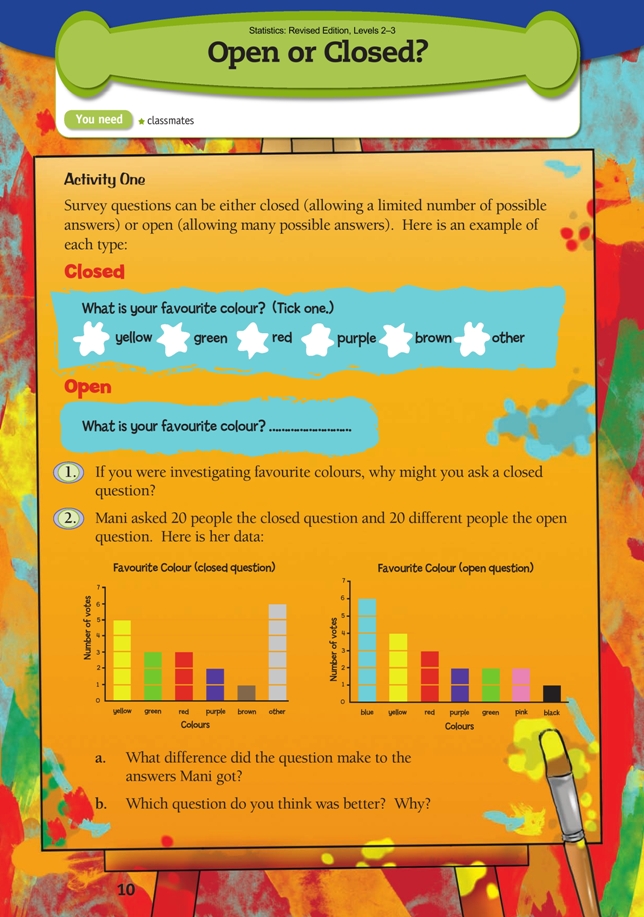
2. a. The graph from the open question data gives a clear picture of which colours are most/least popular. The problem with the graph from the closed question data is the tall “other” bar. While the graph suggests that yellow is the most popular colour, we can’t be sure. It may be, for example, that the six “other” votes were all from people who liked blue (not offered as a choice).
b. The open question was better because everybody got to name their favourite
colour and we are not left wondering what the “other” people would have chosen if
they had had the chance.
Activity Two
1. a. Open. This question may be too open and get answers such as “often” or “hardly ever”. You may get better information from a closed question with carefully
chosen options such as “twice a day”, “once every day”, “twice a week”, “once a month”, “only on Sunday”, or “as a special treat”.
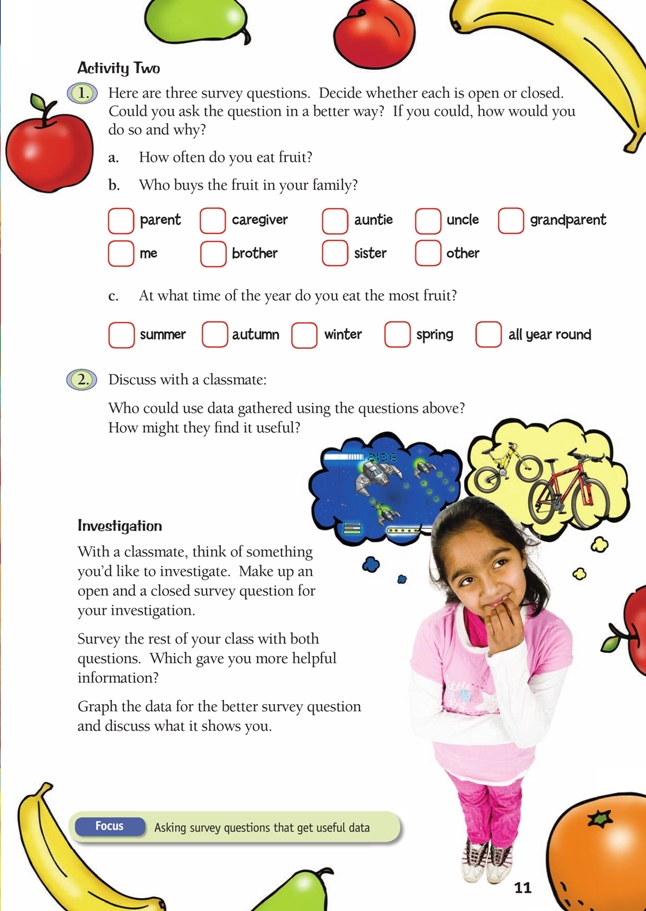
b. Closed. The options could be improved.
It seems odd to separate out auntie and uncle, brother and sister, but not mother
and father. Also, the question could be confusing for those with family members
who may buy fruit for their own eating rather than for the household as a whole.
So a better question might be “Who buys the fruit for your household?”
c. Closed. It is unlikely that this question will get meaningful answers. Different
types of fruit are plentiful and affordable at different times of the year and most
people eat what is available at the time.
Also, does it make any sense to include eating “most fruit” “all year round”?
2. The data might be useful in a class or school survey as the basis for discussion on healthy eating habits. However, it is unlikely that data gathered using these questions would be sufficiently detailed or accurate to be of much use to producers and suppliers. Surveys are often used to fi nd out more about the people who buy certain products. Such surveying is called market research.
Investigation
Practical activity. Results and discussion will vary.
Key Competencies
Open or Closed? can be used to develop these key competencies:
• thinking
• relating to others.