Short and Sharp
This is a level 2 statistics activity from the Figure It Out series.
A PDF of the student activity is included.

Click on the image to enlarge it. Click again to close. Download PDF (1559 KB)
construct a stem and leaf graph
make a conclusion based on the data
compare two graphs
This diagram shows the areas of Statistics involved in this activity.
The bottom half of the diagram represents the 5 stages of the PPDAC (Problem, Plan, Data, Analysis, Conclusion) statistics investigation cycle.
FIO, Levels 2-3, Statistics Revised Edition, Short and Sharp, pages 8-9
Classmates
The focus of these pages is on stem-and-leaf graphs. As these graphs require and reinforce knowledge of place value, you may need to refresh this concept with your students before beginning the activities.
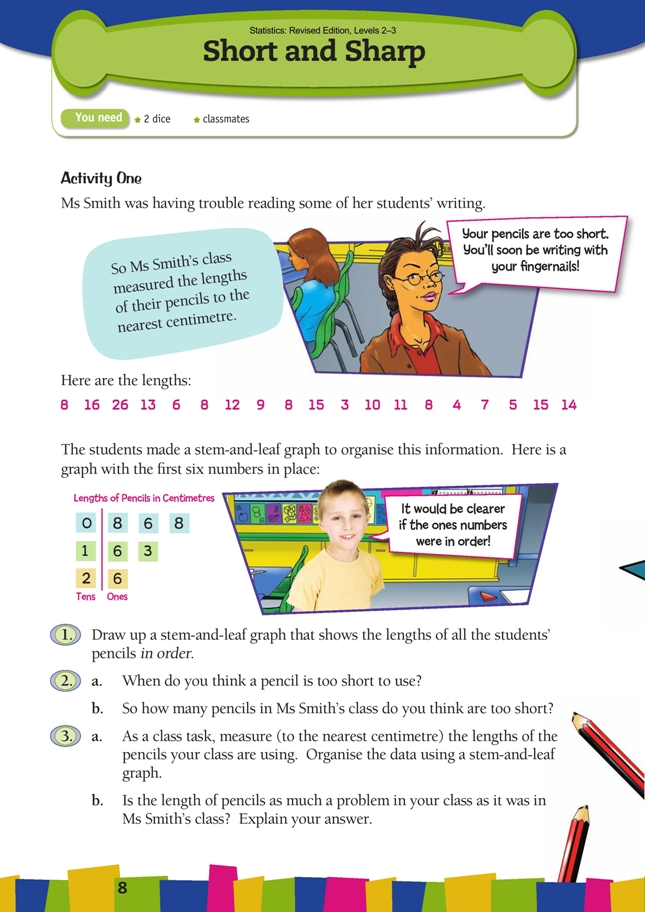
Activity One
In this scenario, Ms Smith thinks that the trouble she has reading her students’ handwriting could be related to the size of the pencils they are using. In terms of the PPDAC cycle, a problem is recognised and an hypothesis formulated. Data is then collected and analysed and conclusions reached.
The finished graph for question 1 is shown in the Answers.
Key features of stem-and-leaf graphs:
• The numbers on the stem are equally spaced and in numerical order.
• The digits down the stem represent tens (1 represents 10, 2 represents 20, and so on).
• When the data set contains numbers less than 10, these numbers appear as leaves alongside the 0 on the stem.
• Every number must be represented by its own leaf, even if there is a leaf of the same value already there.
• The stem only needs to be long enough to accommodate the least and greatest number in the data set. (If the least number is 27, the fi rst number on the stem will be 2; if the greatest number is 81, the last number on the stem will be 8.)
• The numbers in the stem form an unbroken sequence, even if there are no leaves to attach to some of them.
Unless the data set is very small, it is usual to create a stem-and-leaf graph in two stages: first, enter the leaves as they appear in the data and second, reorganise them in numeric order.
When answering question 2, remind the students of the original problem: Ms Smith thought that short pencils might be making her students’ writing hard for her to read. How can they decide what “too short” means?
Question 3 involves students replicating the fi ctional scenario by gathering real data from their own classmates and then reaching a conclusion. Stickies are a convenient way to make the stem and- leaf graph in this question. The students measure their pencils to the nearest centimetre and then write just the ones digit for the length on a sticky. The stem of the stem-and-leaf graph is drawn on the whiteboard, and the students come up with their stickies and locate them on the correct “branch”. The stickies can easily be organised in numeric order as a second step in the process. Students should be able to identify exactly where their particular piece of data has got
to in the finished graph.
Activity Two
These three investigations are designed to embed learning about stem-and-leaf graphs. As elsewhere, it is vital that the students do not stop with the creation of a graph. Even in presumably random data, such as house numbers and birth dates, there will be patterns to be discovered (“Look: eight of us have birthdays on the 12th of the month!”). As part of the Conclusion phase of the PPDAC cycle, the students need to think about what meaning, if any, lies behind these patterns.
Activity Three
Activity Three introduces the students to a simple probability task. Unlike the previous activity, where everyone was working with the same data sets, in this activity, everyone does the identical task but comes up with a different data set and a different graph. This does not mean, however, that there will be no similarities and patterns. For example:
• Everyone’s data will certainly be between 1 and 36.
• The 20s and 30s branches are likely to be notably shorter than the units and 10s branches.
• The units branch is likely to be the longest of all.
If the students were to pool their data, it is likely that they would fi nd that about half the leaves on their graph were units leaves.
Challenge your students to explain these patterns. To do so, they could create a product table like the one below and relate it to their data.
Answers to Activities
Activity One
1.
2. a. Answers will vary. Try a pencil in your hand. How long at least does it need to be to rest comfortably between your first two fingers, supported by your thumb (or
however you hold your pencil)? Probably somewhere between 8 and 10 cm.
b. Answers will depend on your definition of too short. For example, if you decide that 6 cm is too short, there would be 4 pencils in Ms Smith’s class that are too short.
3. a. Practical activity. Results will vary.
b. Answers will vary. What is important is that you use the same definition of “too
short” for the pencils in your room as you used for the pencils in Ms Smith’s room.
Activity Two
1.–2. Graphs and answers will vary. The data your class collects will determine what you can say about it.
Activity Three
1. a.–b. Results and graphs will vary greatly.
Here is a sample data set:
2. a. The data sets are likely to be very different because they are being decided by chance (probability). But the stem-and-leaf graphs will all have no more than four
“branches”, and the fi rst two branches are likely to have a lot more leaves than the
last two. (Can you explain why?)
b. In Activity Two, everyone was working with the same data sets, so their graphs
should have been the same. In this activity, even though everyone does an identical
task, the data sets will differ greatly because they are determined by chance.
Key Competencies
Short and Sharp can be used to develop these key competencies:
• relating to others
• participating and contributing.