Too Much Telly?
This is a level 2 statistics activity from the Figure It Out series.
A PDF of the student activity is included.


Click on the image to enlarge it. Click again to close. Download PDF (1966 KB)
answer questions from a chart
compare information from two graphs
make a conclusion based on data
This diagram shows the areas of Statistics involved in this activity.
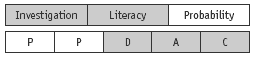
The bottom half of the diagram represents the 5 stages of the PPDAC (Problem, Plan, Data, Analysis, Conclusion) statistics investigation cycle.
FIO, Levels 2-3, Statistics Revised Edition, Too Much Telly? pages 6-7
Classmates
Activity One
In this activity, the students are asked to interpret and compare three sets of data presented as double horizontal dot plots. They may not have encountered graphs exactly like these before. If this is the case, invite them to make sense of them without your assistance.
For questions 1 and 2, it is important that the students write their statements down. This disciplines them to formulate ideas completely and commit to them. Once they have done this, their ideas can be challenged on the basis of the data and either justified, modified, or rejected.
The three data sets are multivariate in that, for each student, the variables of (i) day of week, (ii) hours watching TV, and (iii) hours doing homework all have to be considered.
For question 3, the students could find the total amount of time each of the three Room 6 students spent watching TV and doing homework and compare the two amounts. Jessie watched 14 1/2 hours of TV and did 2 hours of homework; Nina watched 10 hours of TV and did 5 hours of homework; Ruka watched 11 hours of TV and did just over 4 hours of homework. So all three spent a total of 15–16 1/2
hours on watching TV and doing homework. Jessie spent only about 1/7 of this time on homework, Nina 1/3 , and Ruka about 1/4.
So yes, it appears that the more TV these students watched, the less homework they did.
It is important that students realise that they can’t generalise from the very small data sample available about the relationship between TV watching and homework, or even about the habits of these three students.
Activity Two
Again, challenge your students in pairs or small groups to interpret these two graphs without assistance from yourself. Dot plots are visually powerful, eminently accessible graphs. Once the students have had the opportunity to delve into the meaning of the graphs, encourage them to answer questions 1 and 2. As before, they should express their points in the form of written statements, able to be contested.
Encourage the students to use phrases or statements such as “nearly all” or “hardly any”. They need to be wary of statements that include “most”. Students sometimes look for the most frequently occurring value (for example, 2 hours’ homework in Room 6) and make incorrect statements, such as “Most people in Room 6 do 2 hours’ homework each week.” (In fact, although 11 people in that room do 2 hours’ homework each week, the remaining 19 people do more or less than that). Another problem associated with the word “most” is that, to some people, it means “more than half” (a simple majority) while, to others, it means “substantially
more than half”.
Answers to Activities
Activity One
1. Possible comments include:
• All three students spent more time watching TV than doing homework.
• All watched more TV on Friday and Saturday than on other days.
• None did any homework on Friday or Saturday.
• All did half an hour of homework on Sunday.
2. Possible comments include:
• Jessie watched the most TV (14 1/2 hrs) and did the least homework (2 hrs).
• Nina watched the least TV (10 hrs) and did the most homework (5 hrs).
• Jessie and Ruka watched some TV every night, whereas Nina had 2 nights where
she didn’t watch TV at all.
• Jessie did the least homework and only for 15–30 minutes at a time, whereas Nina
and Ruka completed 2 hours’ homework on at least 1 day.
3. On the basis of the data presented, “yes” (Jessie).
Activity Two
1. Comments might include:
• Most Room 6 students watched between 11 and 16 hours of TV, while most
Room 5 students watched between 7 and 12 hours of TV.
• Most Room 6 students did between 1 and 3 hours of homework, while most Room 5 students did between 2 and 4 hours of homework.
• Overall, the students in Room 5 watched a lot less TV and did quite a bit more
homework than those in Room 6.
• Both classes had students who watched considerably more or less TV than most
of their classmates or did more or less homework than most of their classmates.
• Compared with those in Room 5, far more Room 6 students did only 1 hour or less
of homework in the week.
• A lot more Room 5 students than Room 6 students did 4 or more hours of homework in the week.
Discussion points:
This data is for only 1 week. So:
• It may be that Room 5’s teacher always sets more homework or simply that Room
5 was finishing a project that week.
• It may be that, if a different week were surveyed, Room 6 might have more
homework than Room 5.
• Room 6 and Room 5 may be different year levels, which could make a big difference.
You might discuss why a few students watched no TV or did no homework, or why others watched far more TV (were they sick for a few days, during which time they watched lots of TV and did no homework?) or did more homework (were they slow or extra thorough, did they choose to do extra, or were they leaving an ongoing project until the last week?).
2. Opinions will vary, depending on your own experiences and values.
3. a.–b. Answers will vary.
Key Competencies
Too Much Telly? can be used to develop these key competencies:
• thinking
• using language, symbols, and texts
• managing self.