Giant Mystery
The unit explores relationships between the hand length, width, span of a person and their height and other body measurements. By using the hand print of a giant, students are able to use the relationship between hand size and body size to find out how big the giant is.
- Measure accurately using centimetres and millimetres.
- Organise and record data, in tables and graphs.
- Interpret trends and identify number relationships.
- Apply mathematical knowledge to practical problem solving.
In this statistical project students investigate the relationship between two variables: hand size and height. They collect a set of data for the investigation by taking measurements from a sample of people, then create dot plots to explore potential relationships. They interpret their data displays to identify the relationship between hand size and height, and communicate their findings to their classmates, considering the limitations of their results.
Because the project involves collecting measurement data, it provides plenty of opportunities for students to practise measuring and recording length accurately. It also develops students’ understanding of the relationship between measurement units: metres, centimetres and millimetres.
The learning opportunities in this unit can be differentiated by providing or removing support to students and by varying the task requirements. This could include providing additional workshops to scaffold students’ work. Possible workshops include:
- measuring accurately in centimetres and millimetres
- use of Excel
- interpretation of dot plots
- converting between metres, centimetres and millimetres.
More general methods of differentiation could include providing opportunities for students to work in small groups and pairs to encourage peer-learning and extension (tuakana-teina). You could also vary the sample size (i.e. the amount of information students are expected to collect), and vary the cognitive demands associated with surveying a sample by providing appropriate graphic organisers. Provide sentence starters to assist students with interpreting their data and writing summary statements.
The context for this unit can be adapted to suit the interests, experiences, and cultural makeup of your students. The unit focuses on the context of a giant. Increase the relevance of this context by working together with students to brainstorm who the giant might be. This could draw on students’ knowledge of relevant, culturally-located myths and legends, picture book characters, or animated movie characters. You could also read about the Guinness World Records for the world’s tallest man (Robert Wadlow - 2.72 m tall with feet measuring 47 cm in length, and hands measuring 32.3 cm from his wrist to the tip of his middle finger) and the world’s tallest woman (Rumeysa Gelgi - 215.16 cm tall with hands measuring 24.93 cm and 24.26 cm).
Te reo Māori kupu such as mehua (measure), mitarau (centimetre), mitamano (millimetre), mita (metre) kauwhata ira (dot graph, dot plot), raraunga (data), tirohanga tauanga (survey, statistical survey), and matapae (predict, prediction) could be introduced in this unit and used throughout other mathematical learning.
- Rulers: 30 cm, 1m, tape measures
- Access to Excel or similar
- Giant hand print (photocopy of teacher's enlarged to fill an A3 page)
- Construction material
- People of varying ages
Prior experiences
Before working on this unit, students should have engaged in practical measurement exercises where they measured items of varying length using metres, centimetres and millimetres. They should also know the relationship between metres, centimetres and millimetres. This knowledge will be further developed throughout the following sessions, however, it is also an important prerequisite to collecting the required data (i.e. measurements).
Session 1
In this session we introduce the problem and start collecting data.
- Introduce the session within a context that is relevant to your students.
- Show the students a photocopy of the giant’s hand. Ask the question:
We know the length, width and span of the giant’s hand… using this information, can we determine their height? - Discuss the possible relationship between their hand size and their body height. Record students’ ideas on a class chart.
Encourage students to suggest that it might be worth measuring and recording: body height, hand length, hand width, hand span. - Gather information to investigate the possible relationships.
- Discuss the size of the sample needed to provide reliable information (the larger the sample size, the more reliable the data.
- Discuss the range of ages (junior, middle, adolescent, adult) and genders (male, female) as variables.
- Briefly discuss how to measure accurately with the tools provided (e.g. no gaps between measurements, start the measurement at 0, measure in a straight line). Provide the students with a table to use when recording data, or support them to construct one. Get the students to measure themselves and a partner. Ask students to record this data in their table. Collate it, as the teacher, on a spreadsheet (ensuring that students do not see each other’s data). You could share data with other classes to get a larger sample of people.
- The students could also gather more data from their family and whānau. This would give a greater range of ages and heights.
Session 2
In this session we create scatter plots of the relationship between height and hand measurements.
- Discuss:
What relationship are we trying to determine? (Relationship between height and hand size.)
How can we determine whether there is a relationship between the various pieces of information we have gathered?
How best could we show that relationship?
- Show the students how to create a scatter plot. Get them to plot some data manually as well as with a digital tool as this will give them a better idea of how the computer generates scales for the axes.
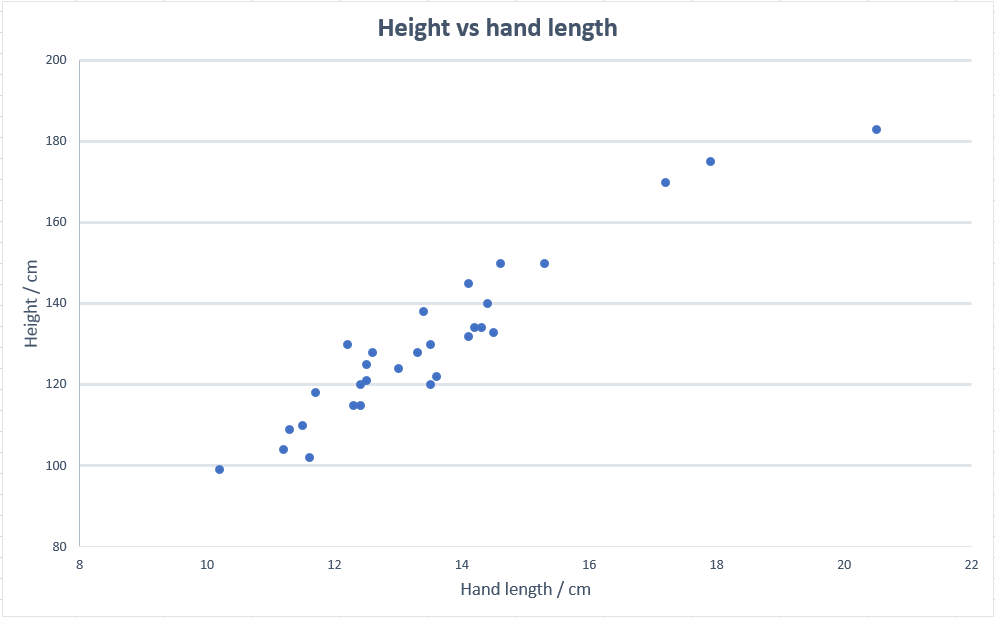
- Develop scatter plots for each of the following: height versus hand width, height versus hand length, and height versus hand span.
- Discuss the appearance of the graphs.
Can you see any patterns or relationships?
Using the information on the graph can you predict a person’s height or hand size? Try using the sentence “if they are X cm tall, I think their hands will be X cm in length because the data shows that…”
What relationships are you identifying? A person is (?) times their hand length, or their hand width is one-tenth of their height?
Which hand measure is the best predictor of height? Why?
Can you use this information to work out the giant’s height?
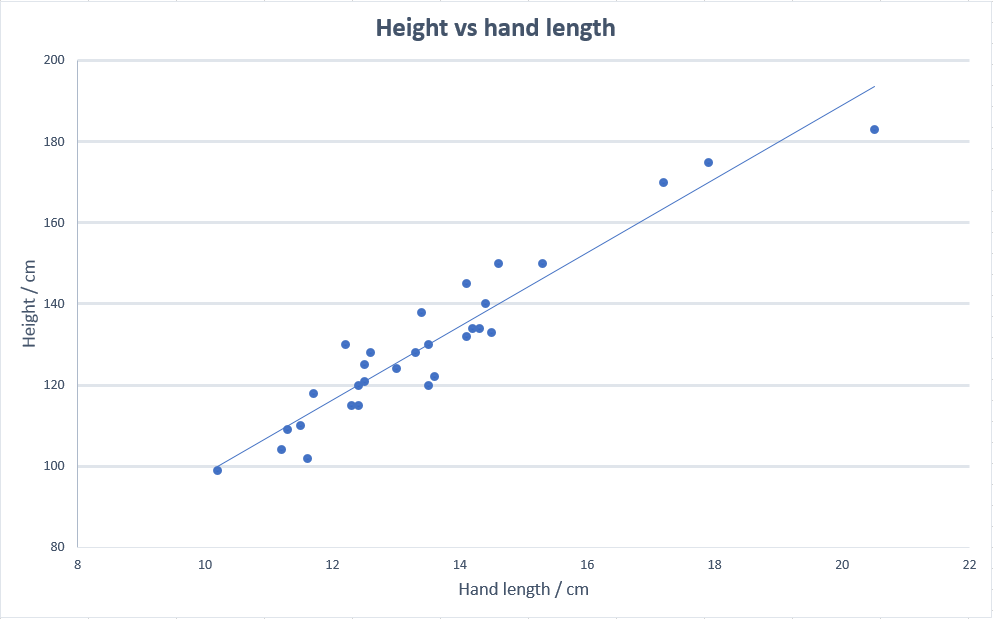
- You may like to discuss the amount of variance (i.e. how far the plots are spread out - this shows how much a random variable differs from its expected value) and the range within which the relationships fall. This gives an opportunity to discuss lines of best fit and apply them to constructing the giant.
- Explore whether the prediction will be different if you know that the giant is young or old, male or female. Excel allows you to sort the data in ascending or descending order and draw a scatter plot of only the junior children, or males, etc… if you want.
Session 3
In this session we create a silhouette of the giant.
- Discuss possible relationships between other body parts.
- Determine a list of body parts to be measured.
Will the giant be 2-dimensional or 3-dimensional? - Can we use a simple length measurement to predict the size of other parts of the giant? For example: head length/width, foot to hip length, shoulder width, foot length, arm length, waist circumference, head circumference, or thigh/calf circumference.
- Record the predicted measurements on the board.
- Get the students to measure the identified measurements for themselves and a partner. They should clearly identify which relationship they are trying to predict (e.g. relationship between height and shoulder width etc.) Ask students to record this data in a table and then use it to create a scatter plot. Discuss the importance of keeping the data confidential by not attaching any names to the data. If you shared data with other classes in the first session (when recording height), then you should also share the data from this session.
- Repeat the same discussion from the previous session. Ask:
Can you see any patterns or relationships?
Using the information on the graph, can you predict a person’s … or …?
What relationships are you identifying? A person is (?) times their …., or their … measurement is …?
Which of your measures is the best predictor of the other variable? Why?
Can you use this information to work out the giant’s height or to to determine the size and proportion of the giant? - Encourage students to explain the relationships they see in their data, and use these to predict a specific part of the giant (e.g. head width). Collate these predictions.
Using the class’s predictions, make a 2-dimensional silhouette of the giant using newspaper or butcher's paper. Look up the tallest known man and woman and compare your giant to these people.
Session 4
In this session we discuss the accuracy of our findings.
- Discuss:
How accurate is your information?
Using only a hand print, what other measurements can you predict?
How accurate were your predictions? - Discuss how a small change in the length of hand measurement makes a big difference to the predicted height.
- Ask: Should we measure the hand length in centimetres or millimetres if we’re going to use it to predict the giant’s height? Why?
- For several people use the relationship you have established for hand length and height. Measure their hand lengths in both centimetres and millimetres and use both measurements to predict their height. Does the accuracy of the hand length measure give a better prediction of height?
- Ask: If we used thumb length as the predictor for height would it be more or less accurate than hand length? Why?
- Get the students to investigate these questions in small groups and report back their results.
Session 5
In this session students are challenged to investigate other things we might be able to find out about the giant from their hand print. Challenge students to carry out an investigation in pairs or small groups. Support them to work through the steps of the PPDAC cycle. Support them to present their findings in an engaging and informative manner (this could provide a link to explanation writing, visual presentation skills, using digital tools to create a video or speech, and oral language skills).
Students will have many ideas about this such as:
- How many steps will the giant take to walk from your house to school?
- How long will it take them?
- What size would the giant’s house be?
- How much would the giant eat each day?
- What would their food bill be for a week?
- How big would the giant have been when they were a baby?
- How many balls of wool would you need to knit the giant a jersey?
Dear family and whānau,
This week in maths we are investigating a mystery. A giant has left a handprint and we are using the measurement of the handprint to work out how big other parts of his body are. To do this we need to collect some measurements from other people for comparisons. Please allow your child to measure your hand, height, and a few other parts of your body. They will add this information to our class spreadsheet, which will be kept confidential. Ask them to let you know what we find out by the end of the week and explain to you how we figured this out.