Figure me out
This unit is designed to engage your class for at least the first week of the school year. It provides students an opportunity to work collaboratively and independently on challenging mathematical tasks. It also provides you, their teacher, with opportunities for you to learn about their current level of achievement.
- Find whether a given whole number is prime or non-prime (composite) and whether the number is a multiple of three.
- Use exponents, square roots, factorials and place value to write expressions for whole numbers.
- Represent category data using bar charts and interpret those charts.
- Calculate common measures of centrality; mean, median and mode.
- Use scale maps to identify the distance from home to school.
- Represent a three-dimensional object using plan views.
- Use trials and theoretical models (tables, tree diagrams) to estimate or find the probability of an event.
The mathematics in the unit is varied. However, there is a general requirement for students to think multiplicatively rather than additively. The shift from additive thinking to integration of additive and multiplicative thinking is an essential requirement at Level 4. Indicators of multiplicative thinking are:
- Use of the properties of whole numbers under multiplication and division, which includes:
- The distributive property, e.g. 6 x 24 = 6 x 20 + 6 x 4 so 144 ÷ 6 = 120 ÷ 6 + 24 ÷ 6;
- The associative property, e.g. 15 x 36 = 3 x 5 x 36 = 3 x 180;
- Inverse, e.g. If 57 ÷ 3 = 19 then 19 x 3 = 57.
- Integration of all four operations accepting the conventional order of operations:
12 + 7 x 16 - 20 = 12 + 112 – 20 = 104 - Flexibility with the use of notation for powers (using exponents), square roots and factorials (roots are also powers), and multiplication and division by decimals:
- 2.4 ÷ 0.6 = 24/10 ÷ 6/10 = 4
- 5! = 1 x 2 x 3 x 4 x 5 = 120
- 63 = 6 x 6 x 6 = 216
Specific Teaching Points
Most of the tasks are open ended so students can operate at a level that suits them. Encourage students to experiment with expressions as much as possible rather than operate ‘in the known’.
Also encourage students to work in systematic ways. To identify an unknown student which clues will be most useful? Why?
How will students check to see that they have identified the correct student? What will they do when several students have similar data?
This unit is set for students to learn, and practice, outcomes at Level 4 of mathematics in the New Zealand Curriculum. All tasks can be altered to cater for the range of readiness and interests of students in your class. A main purpose of the unit, for all students in the class, is to engage in collaborative inquiry. Many suggestions are given with specific sessions about how to simplify or add more challenge to the tasks. Most activities are open ended so students can engage at a level that is appropriate to their knowledge and interests. Other methods of enabling participation are:
- providing physical models or experiences where appropriate supporting students' understandings of measurements, e.g. Walk out one kilometre during fitness time, or move around a cube model to draw it from different viewpoints
- modelling mathematical procedures such as finding a median, testing whether, or not, a number is prime, or calculate a fraction as a percentage
- organising the steps of a problem-solving process using a flowchart or some other graphical display
- encouraging students to work collaboratively in partnerships (tuakana/teina), and to share and justify their ideas
- sharing ideas with the whole class regularly.
The difficulty of tasks can be varied in many ways including:
- allowing access to calculators and graphing tools
- restricting the domain of numbers being investigated and the range of operations to be used, e.g., Try the four fours problem with numbers 1-20
- providing helpful hints at ‘hidden’ locations around the room
- displaying the work of students as models for others
- providing formats for recording that scaffold a process.
The contexts for this unit can be adapted to suit the interests and cultural backgrounds of your students. In this unit students investigate data about other students in the class, and present that data in informative ways. Students may be interested in other inquiry questions. Examples might include search for the ‘average’ student in the class through investigating:
- heights,
- hours of sleep,
- favourite television programme, colour, book, movie, sport, takeaway meal, famous New Zealander
- beliefs about global warming, homework, pocket money
- typing speed, reaction time, height of standing jump, time spent on hobbies, jobs, watching a screen
Te reo Maori vocabulary terms such as tau waenga (median), tau tānui (mode) toharite (mean), raraunga (data) and kauwhata (graph) could be introduced in this unit and used throughout other mathematical learning.
- Calculators
- Connecting cubes
- Copymaster 1
- Copymaster 2
- Copymaster 3
- PowerPoint
- Finding distance animation
Prior Experience
Use the sessions to informally assess students' mathematical skills and understanding at the start of the school year.
Session One
- Welcome your new class to the first week of mathematics adventures. Explain that the goal for the end of the week is to provide a classmate with a poster that will allow them to figure out who you are and learn a bit about you. That is why the name of the unit is Figure me out. A template to fill in is included as Copymaster 1.
- In the first session students will add two clues to their posters; their gender and their date of birth. That sounds easy, but let's make it a bit more difficult for the person getting the poster at the end of the week.
For your gender, you might put male or female. Look at the poster template which has a key; If a prime then male, if a multiple of three then female.
- Ask: Suppose a classmate wrote 51 in that space. Would they be male or female?
Some students may know what prime numbers are. You may need to research primes to find they are whole numbers with only two factors, one and themselves. Is a person that puts 51 male or female?
- Another way to look at the problem is to find if two factors, other than 1 x 51, have a product of 51. Let the students discuss this in pairs. Talk about the ways to check if 51 is prime:
- Get 51 objects and try to sort them into equal sets. That would work but could be time consuming.
- Go through a times table chart to see if 51 occurs in the products. Why won’t that strategy always work? (51 will not show if a factor is greater than 10 or 12)
- Use a calculator. Nice idea but how do you use the calculator? You could try all the multiples of two, then three, then four, etc. That would take a long time. Maybe a student might suggest using division. 51 ÷ 2 = 25.5, there is a remainder (0.5) so two is not a factor of 51. But 51 ÷ 3 = 17, there is no remainder so 3 x 17 = 51. Therefore, the person is a female.
- Ask: Suppose a classmate wrote 47 in that space. Would they be male or female?
Let the students work in pairs to establish if the person is male or female. 47 is prime so the person is male.
- If students are not familiar with divisibility by three you may want to use elements from the Nines and threes activity from the Numeracy Project series.
- In the case of a student who does not want to identify with being either male or female, they could choose a number that is neither prime nor a multiple of three.
- Invite the students to make their first entry onto their poster in the Gender space. The number they put must be greater than twenty but less than 100, so the problem is sufficiently challenging. Allow students to use calculators to test out numbers they select. This time provides opportunities to assess students’ multiplicative thinking.
- Do they need materials, like counters, to check for factors?
- Do they use division rather than trial and error to find if a number has factors?
- Do they recognise that a decimal in the quotient (division answer) indicates a remainder?
- Do they know that a remainder indicates non-divisibility?
- At this point you need to create a spreadsheet to gather data on your students. You may have a speedy typist in the room who can enter the data or rely on each student to enter their own. The spreadsheet will be needed on the final day of the unit.
- Move on to the date of birth. If a person wrote 12/04/11 for their DoB, what would that mean? Students should recognise that the date of birth (DoB) is 12th of April, 2011. Taking out the forward slashes, this date of birth can be written as 120411.
However, on their poster a person might write one of the following:- (12 x 10 000) + (4 x 100) + 11
- 3332 + 9 522 or (310 x 2) – 38 – 36 – 397
- (9! ÷ 3) – 549
- Discuss what each expression means. Important points are:
What is 10 x 10 000? (100 000)? So what is 12 x 10 000? (120 000)
What does 3332 mean? (333 x 333 or two 333’s multiplied together) You may need to show simpler examples of exponents like 42, 53 and 24.
What does 9! Mean? (9 factorial which is the product of 1 x 2 x 3 x 4 x 5 x 6 x 7 x 8 x 9)
- Get the students to use calculators to check that each expression equals 120411. Watch for students to recognise the importance of order of the operations. The expressions included parentheses (brackets) that are unnecessary since exponents precede multiplication and division in operational order, that precede addition and subtraction.
- Let the students come up with an expression that calculates to their DoB and add it to their poster. Encourage them to be creative and use some of the ideas in the three expressions shown. Also update the spreadsheet with the dates of birth.
- For early finishers pose this problem:
A classmate gives you this clue for their date of birth. Use your calculator and research skills to find their DoB.
310 + 76 – (2 x 55) + 43 (59049 + 117 649 – 6250 + 64 = 170512)
Session Two
In this session students develop two more expressions for the number of people that normally live in their household and the distance of their home from school.
Number of People per Household
- Begin with the PowerPoint. Slide One shows a graph. Explain that this graph is something about the homes that students in another class live.
What might the graph be about? Can we give the graph a title and some labels?
- Let your students discuss what the graph might be about. It is likely they will realise that the size of the numbers prohibits ideas like letterbox numbers or number of cars. The graph is about the number of people that normally live in each student’s house. Discuss a good graph title and labels for the axes. Slide Two provides those additions. The vertical axis shows frequency, the number of data items in each category. Ensure students know this.
- Ask: What is the average number of people that live in Room 5 households?
The term average refers to some measure of middle or centrality. Common averages are the mean, median and mode. The mode for Room 5 data is four, the category with the highest frequency.
- Ask: How might we find the median? (The median is the middle number of people)
You could mimic writing all the data points in the graph, like this:
3, 3, 3, 3, 3, 4, 4, 4, 4, ….6, 6, 6, 7, 7, 8+
How will we find the middle number? You could count in one point at a time from the top and bottom. However, halving the total number of data points will give the location of the median. There are 5 + 9 + 7 + 3 + 2 + 1 = 27 data points (adding the frequencies) and 27 ÷ 2 = 13.5 so the median lies between the 13th and 14th data points. Both points lie in the bar for a four-person household, so the median is four.
- Ask: How might we find the mean? (The total of all data points divided by the number of data points)
It is easier to calculate the total of scores as (5 x 3) + (9 x 4) + (7 x 5) + (3 x 6) + (2 x 7) + 8 = 126. Note that 8+ is treated as eight though the actual number might be more than eight. 126 ÷ 27 = 4.66…
Therefore, the mean is closer to five people per household which reflects the fact that the median was ‘at the end’ of the four-person bar. It is interesting to reflect on the fact that two-thirds of a person is a mathematical rather than real idea, but it does suggest the centre is closer to five people than four.
- Use post-it notes to gather the data for your class. Get each student to provide data about how many people normally reside in their household and write the number on a note. You may need to discuss ‘normally’ as some households are very transient. Get students to organise the notes into a bar graph on the whiteboard. Find the mode, median and mean for your class and compare the distributions.
- Finally, ask students to add to their poster by giving a clue about the number of people who live in their household. Encourage them to use what they have learned about averages.
For example, if five people live in a student’s household their clue might be:
“The median of 2, 9, 5, 8, 6, 3 and 4”, or “The mean of 1, 3, 4, 7, 7, 8.”
Distance from home to school
In the second part of the lesson students provide a clue about the location of their home. To do so they need to work out the distance of their home from school.
- Provide students with a photocopied map of the local area complete with scale. This video gives an example of working out the distance between home and school. Useful questions are:
How far is 53mm in real life? (53 ÷ 32 = 1.67 and 1.67 x 200 = 334 metres in real life)
How far do you estimate the total journey is from Kiwi Street to Hilltop School? (1.6 – 1.8 kilometres)
Note that metres can be converted into kilometres. Do your students know how to do that?
- Once students have established their home to school distance ask them to create an expression for that section of the poster. For example, 1.6 kilometres might be written as 402 metres or as 4002 cm
Session Two allows you opportunity to assess students’ understanding of the following concepts:
- Multiplicative thinking – Do they apply multiplication and division to find averages and create expressions?
- Proportional thinking – Do they apply scale correctly to work out distances from a map?
- Measurement system – Do they convert easily among metres, kilometres, and centimetres?
Session Three
In this session students investigate two more clues to add to their poster. First, they investigate the Scrabble total for their given name. Then they create a personal icon, a sculpture made from connecting cubes. The icon will be used in Session Five to check that the person you identify is who you think they are.
Scrabble Total
- Introduce the famous ‘four fours’ puzzle. In the puzzle you find expressions that contain four fours, with any number and operation symbols you like, that represent the numbers 0-100. For example, 4 + 4 – 4 – 4 is an expression for zero and 44 ÷ 4 + 4 = 15. Remind the students that the rules for order of operations must be followed, e.g. multiplication and division before addition and subtraction. Students also need to recognise that division can be expressed as fraction notation, e.g., 44/4 = 44 ÷ 4 = 11.
- Challenge your students to come up with four fours expressions for the numbers 1-10. Expect answers like:
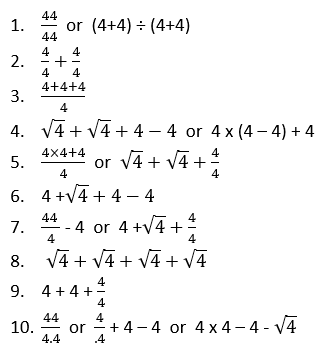
- The options for ten bring out an interesting idea about dividing by decimals. Four divided by point four (4 ÷ .4) is equivalent to asking, “How many lots of four tenths fit into four?” Since four equals forty tenths the question can be reworded as, “How many lots of four tenths fit into forty tenths?” Note that the quotient is ten which is larger than the dividend of four. This will be challenging for many students.
- Copymaster 2 contains a graphic of the tiles used in the game of Scrabble. Some students may not be aware of how the game is played so you might use the paper version to show them. Ask the students to create their given name with scrabble tiles. Here are some examples:

Zoe’s letter score is 10 + 1 + 1 = 12. Hinemoa has a letter score of 4 + 1 + 1 + 1 + 1 + 1 + 1 = 10 and Kevin has a score of 5 + 1 + 4 + 1 + 1 = 12.
- Once they make their name students need to create a ‘four fours’ clue for that total to put on their poster. For example, Kevin or Zoe might write (44 + 4) ÷ 4.
The Icon
- Give each student 15 connecting cubes to create their personal sculpture. The icon must be able to sit on a desk, so it can be drawn from different viewpoints, and it must be asymmetrical. You may need to discuss with students that an asymmetrical figure has no symmetry, either reflective or rotational. Copymaster 3 has three views of an icon. Invite the students to recreate this icon with their cubes. Look to see if your students:
- Start with one view and create an icon that fits.
- Move progressively to the two other views, one at a time, to create an icon that works.
- Next, ask your students to form their own asymmetric icon and draw three different views of it for their poster. The icon should be stored in a desk or tote tray, so it can be used in Session Five.
Session Four
In this session students investigate a game involving chance. They play the game 25 times and express the result of their trial using a fraction, decimal or percentage.
- To play the game ‘Odds and Evens’ students need a partner. One player wins if the product is odd. The other wins if the product is even. This is how play proceeds.
- Each player chooses a digit from 0-9, this could be by drawing numbers from a hat or by randomly picking a digit card. For example Player A chooses 3 and Player B chooses 9.
- The players reveal their chosen digits and multiply the numbers, e.g. 3 x 9 = 27.
- If the answer is odd, e.g. The ‘odd’ player wins, and the even player loses that round.
- After 25 games each player records their success rate on the poster as a fraction, decimal or percentage. For example, if the player was ‘odd’ they might get 10 out of 25 wins. 10/25 = 2/5 = 0.4 = 40%. They also record their raw score, e.g. 10, in the class spreadsheet.
- After students have played the game gather the class and discuss:
What did you notice as you played the game? (Students should notice that the ‘even’ person wins more than the ‘odd’ person)
Why does the ‘even’ person win more? (There are more possible outcomes that give an even product)
How might we find out the actual chances of an odd or even win?
- Students may suggest that there are three events that might happen, odd x odd, even x odd, and even x even.
What are the products of these events, even or odd? (odd x odd = odd, even x odd = even, and even x even = even). Students might conclude that the chances of an odd product are one out of three or one third. While some good reasoning is involved to get to this point the conjecture is incorrect since even x odd can occur in two different orders. To establish the probabilities students must consider all the outcomes that contribute to each event.
- One way to do that is to create a model. Students may want to create a 10x10 array where they can work out which of the possible products are odd. There are 100 outcomes but only 25 of them produce odd products. The actual probability of getting an odd product is 25/100 = 1/4. Students that are more comfortable with the properties of numbers may identify that they only need to use a 2x2 array identifying whether each factor is odd or even.
- Students might like to compare their success rate with the theoretical chances. They may observe that the results vary a lot from the predictions.
- Finish the lesson with a challenge:
Keep the two players secretly entering two digits, possibly using two calculators or digit cards. However, change the rules so the game is much fairer. How will you do that?
- Students might suggest that the game will be more even if:
- Player A wins when the product is less than 20. Player B wins if the product is 20 or more.
- Player A wins when the product is the result of even and odd digits. Player B wins if the product is the result of odd x odd or even x even.
- Add the digits instead of multiplying them. Player A wins if the sum is odd. Player B wins if the sum is even.
Session Five
In this session students receive the poster of another student, solve the clues and identify the unknown student in their class. Students will need access to copies of the spreadsheet. Once they think they know who the person is they confirm the identity by matching the three views with the icon in the classmate’s desk or tote tray.
During the session students might identify several students.
You might extend the unit by asking:
- What else could we find out about each other?
- How might we record clues about that information?