Mary's Garden
In this unit students represent a quadratic relationship using spatial patterns, tables, graphs and equations. In doing this, they recognise the key features of a parabola, find unknowns from the graph of a parabola, and find unknowns from simple quadratic equations. Procedural fluency and conceptual understanding are developed simultaneously.
- Make a table of one variable against another to represent a quadratic relationship.
- Represent a quadratic relationship between two variables in words and as an equation.
- Represent a quadratic relationship as a parabola on the Cartesian Plane.
- Recognise the key features of a parabola, including the vertex and x-intercepts.
- Use the graph of a parabola to find unknowns.
- Find unknowns by solving simple quadratic equations.
The concept of a variable is a difficult one for students to grasp. A variable is a quantity that can take up different values. In algebra variables are represented as letters. We often refer to a letter symbol as a variable, when sometimes we mean an unknown specific value, sometimes a generalised unknown (lots of possible values), and sometimes a variable that changes in relation to other variables in a situation.
Before beginning this unit, students probably have constructed linear graphs with integer values and will have solved simple linear equations. Graphs provide an accessible visual representation of the relationship between two variables. Connecting graphs and equations from the same context supports students to understand of how multiple representations connect and are useful for solving problems.
For a structured situation, research indicates that finding a rule for the general term can be a difficult for many students. Students often first notice the iterative (recursive) rule that gives the value of a term of a sequence from the previous term. However, they are sometimes unable to find the general relationship between the independent and dependent variables, or apply the inverse relationship.
This unit should follow delivery of linear algebra and linear graphing at Level 5. The teaching of skills occurs within contexts that provide opportunities for discussion and development of procedures and concepts. As each learning outcome is explored, there may be a need for consolidation through more traditional exercises, such as those found in text books, worksheets or online practice activities. Students who are quick to grasp these concepts will benefit from extension tasks such as those found in the Rich Learning Activities.
The learning opportunities in this unit can be differentiated by providing or removing support to students and by varying the task requirements. Ways to differentiate include:
- grouping students flexibly to encourage peer learning, scaffolding, extension, and the sharing and questioning of ideas
- modelling the construction of tables, graphs and equations, and the solving of equations
- apply the gradual release of responsibility to scaffold students towards working independently
- providing frequent opportunities for students to share their thinking and strategies, ask questions, collaborate, and clarify in a range of whole-class, small-group, peer-peer, and teacher-student settings.
The context for this unit can be adapted to suit the interests, experiences, and cultural makeup of your students. The unit is framed around the context of Mary's garden and that plants it contains. Following this discussion, you could work with the students and whānau to link this learning to meaningful contexts from their lives. Possible contexts could include patterns of students sitting in different arrangements at assembly, patterns of students sleeping at the marae, arrangements of different types of produce for the school garden, and so on.
Te reo Māori kupu such as tauira (pattern), ture (formula, rule), whārite pūrua (quadratic equation), and unahi (parabola) could be introduced in this unit and used throughout other mathematical learning.
This unit of work is built on the pattern of square numbers which are the foundation of quadratic equations. These activities are intended to progress students from writing a quadratic rule from a visual pattern, towards forming a quadratic rule from a description and using equations to solve problems.
For each session a possible sequence for students to follow is:
- Physically model the situation or use drawings and diagrams.
- Make a table of one variable against the other (e.g. counters vs triangles).
- Plot a graph using Cartesian coordinates, using appropriate software.
- Find the key features of the parabola (roots, maximum/minimum and vertical intercept).
- Use the features of the graph to write a quadratic equation of the relationship.
- Use the graph of the relationship to solve a problem.
- Extension: Describe the problem and form a quadratic equation from this description.
- Use the equation of the relationship to solve a problem.
Each session is initially presented as a problem or series of problems for students to solve. Instructions and questions relating to the ideas above, that teachers may give students, are italicised. As stated earlier, it is not suggested that all the learning outcomes should be taught during each session. Therefore, you do not need to provide students with all of the instructions initially. If the first session is to be used for diagnostic assessment, then most of the instructions can be worked through, as a class, to find what the students are capable of. In subsequent activities, one or more of the instructions may be focused on, but other instructions may be given, either as enabling or extending prompts.
Session 1: Mathematics for Cabbages
Adapt the context reflected in this unit to suit the interests and backgrounds of your students. You might introduce this problem as written, and then work with students to re-contextualise it. Mary plants this sequence of cabbage plants because she likes patterns. The first group contains one plant, the next contains four, the next contains nine plants, etc.

- Use counters or drawing to represent Mary’s growth pattern; 1 plant, 4 plants, etc.
For extension, ask students to think of other ways to represent the total number of plants.
How many plants would be needed for the 7th grouping?
If Mary has 650 plants, what is the largest group she can make?
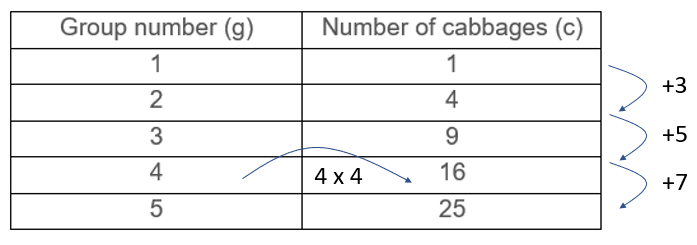
- Make a table showing the position of the grouping and how many plants are in it.
What should be the heading of the first column?
What should be the heading of the second column?
How many plants will be in the fifth grouping? How do you know?
Group number (g) | Number of cabbages (c) |
1 | 1 |
2 | 4 |
3 | 9 |
4 | 16 |
5 | 25 |
- Ask the students to create a paper graph of the relationship between group number (g) and the number of cabbages (c). Requiring students to draw their own graph, rather than use an online tool or spreadsheet to create it, opens up discussion about interesting features of graphs that might otherwise be overlooked. You might provide a template for students to use, or guidelines of the features to be included.
What should we label the horizontal axis?
What should we label the vertical axis?
Where should the numbers be located on each axis? (on the scale marks not in the intervals).
Does it make sense to start each axis at zero? Explain. (No. There is no zero group).
What do you expect the graph will look like? Why do you expect that? (Some students might notice connect the increasing difference between successive terms and slope of the graph).
What is the largest value needed on the horizontal axis?
Will the vertical axis need to have values that are greater or less than that?
If we use one square per plant the graph will be VERY tall and skinny.
How can we make the graph fit on the page?
Can we use different scales for each axis?
What intervals would be good choices for each scale?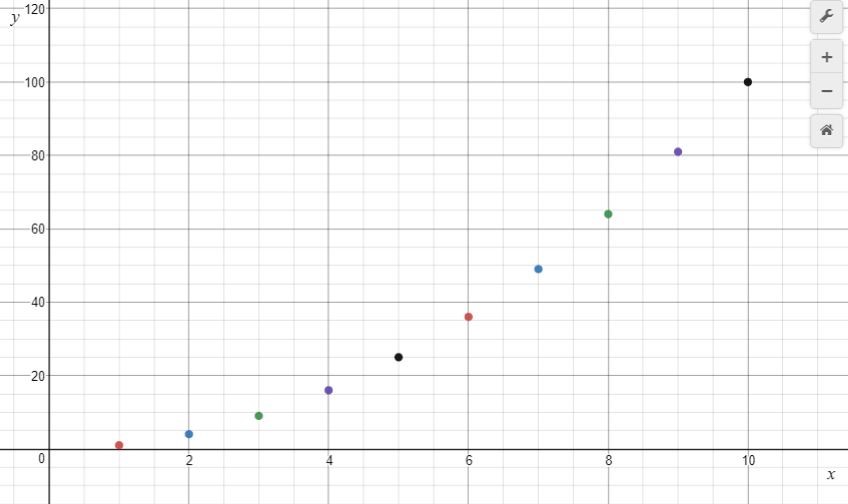
- Describe the pattern the points on the graph make.
Students should note that the points lie on a curve that gets progressively steeper. Discussion can lead to the introduction of the parabola as a U-shaped curve that occurs naturally in the flight of a ball, in the shape made by water coming out of a hose, and in human constructions such as bridges, arches, etc. It is important to discuss the domain (natural numbers) which means that discrete points, and not lines, are plotted.
- Research indicates that students are often unaware of the co-relation of variables represented by a single co-ordinate. Be very specific about what a single co-ordinate represents in this context.
Use your graph to find how many plants would be in the eighth grouping.
Use your graph to find which position the grouping with 81 plants is in.
Where is the point representing the number of plants for the 8th grouping? Can you mark this on the axis? Can you trace across to the vertical axis to find how many plants are needed for the garden in eighth position?
Where is the point representing the position for the grouping with 81 plants?
Can you mark this on the axis?
Can you trace down to the horizontal axis to find how which position number matches that number of plants?
- Return to the table and invite students to discuss what patterns they see in the table and to connect patterns in the table with the spatial pattern. Expect that students will observe both recursive and functional relationships.
- Show Animation 1 and encourage reflection about how the pattern grows.
What is the relationship between the number of cabbages and the group number?
Students may reply, “It is the number multiplied by itself” or “It's the position number squared.”
Can you use this rule to work out how many plants would be in the fifteenth grouping?
Can you use the ‘inverse’ rule to work out where the group number for 144 plants would be?
- Direct student to write their rule as an equation.
If students have written a relationship like, “Number of plants equals the square of the position” then writing an equation is not hard. They should be encouraged to treat a symbolic equation as shorthand.
What letter shall we write instead of “number of plants”?
What letter shall we write instead of “position number”?
When students write equations like n = g x g, confirm that this is correct, and highlight that we can write n = g² using conventional shorthand.
- Use your equation to find where the grouping for 169 plants would be.
Write the equation for me.
What does n represent?
How many plants are there this time?
What should we write instead of n?
If 169 = p², how could we find p?
The most obvious strategy is ‘guess and check’ and this should be accepted initially.
Students should always be expected to check their solution by substituting back into the equation.
p = 13²
p = 169
How could we work out the value of p without guessing? What if the number of cabbages was high, like 2 209?
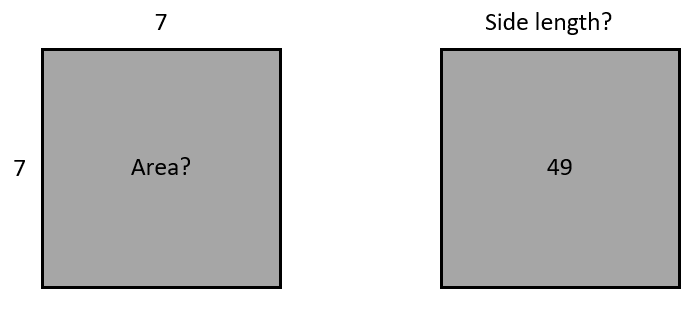
Students may not be aware that finding the square root is the inverse operation to squaring. Three examples will show this:
13² = 169, √169 = 13 20² = 400, √400 = 20 5² = 25, √25 = 5
Relate these operations to the area and side length of a square.
Further Activities (extensions)
Use these to extend students who have grasped the foundational concepts. You might choose to work with other students, developing their foundational knowledge, during this time.
- How many plants would be needed to make a total of 7 groups in this growing pattern?
- How many plants would be needed to make a total of n groups in this growing pattern?
This might lead more knowledgeable students to consider how to find the sum of n square numbers. That involves some complicated algebra about series. This is usually dealt with at Level 7.
Session 2: Attack of the hungry rabbit
- Return to the pattern of Mary’s Garden (Square numbers). Discuss how the spatial pattern, table and graph relate.
What do you notice about the difference between the numbers of cabbages (c) as the group number increase? (Odd numbers)
Look at the spatial pattern. Why are the differences odd numbers? (Building on a pattern to form the next requires two lines of the side length plus one. 2n + 1 is always an odd number)
How do the differences show in the graph? (The slope of the graph increases because the differences increase)
What was the equation for the relationship between g and c, the group number and the number of cabbages? (c = g2)
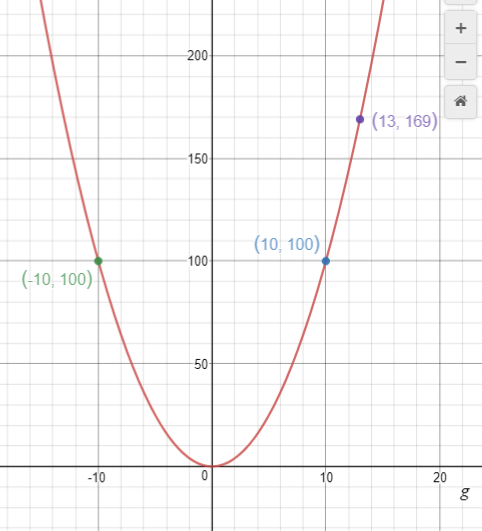
- Let’s see what happens when we graph that equation. Mary’s garden pattern generates the parabola y = x² for a domain of natural numbers only. Use an online graphing tool or a spreadsheet to create a graph showing group number as the independent variable (horizontal axis) and the number of cabbages as the dependent variable (vertical axis). Note that some programmes require you to use x and y as the variable names.
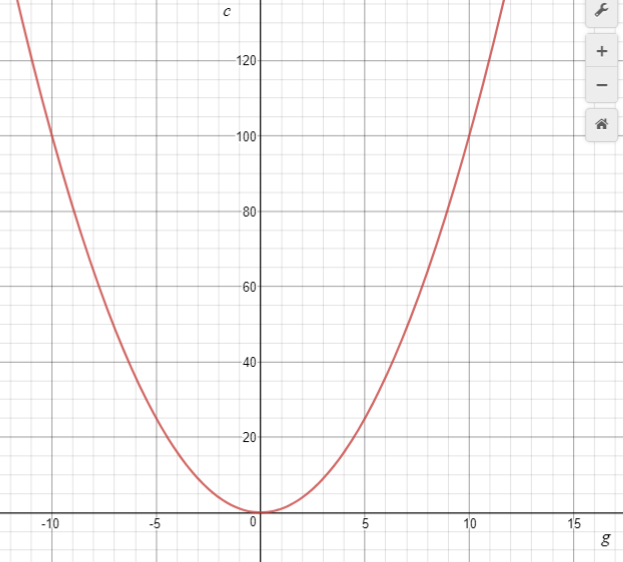
- Compare the graph students drew of Mary’s pattern of cabbages with the graph that the tool has produced. Prior to this, you might get students to compare their graphs with a peer's graph.
What is the same and what is different about the two graphs?
Expect students to note that a continuous line has replaced discrete points and that the parabola has two ‘sides’ as the domain of the online graph extends into negative real numbers. Point out that the online graph is a result of imagination rather that practical application to Mary’s problem. Use the online graph to read out solutions to problems like:
If g = 13 what is c? If c = 100 what is g? (Note this has two solutions +10 and -10)
- Show the students the three cabbage patterns (Animation 2). For each pattern, ask students to:
- Find the relationship between the group number, g, and the number of cabbages, c, using a table.
- Write an equation for the relationship.
- Use an online tool, graphics calculator, or spreadsheet to graph the relationship.
- Connect the graph, the equation and the spatial pattern.
- Let the students work in partnerships to explore the patterns before bringing the class together. Focus the discussion as follows:
- What did you notice about how each pattern grows?
- How is the pattern alike and different from Mary’s pattern?
- How did the differences affect you table and equation?
- How did the change in equation result in a change in graph?
Emphasise these important points as they arise in discussion:
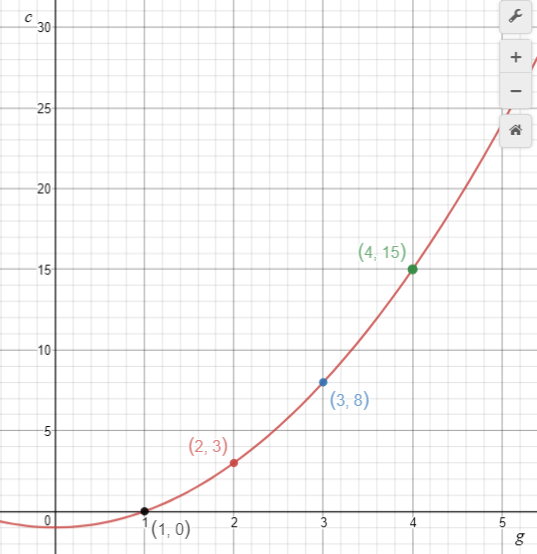
The first pattern is c = g2 – 1. The pesky rabbit has eaten one cabbage from each group. The result is that each value for c in the table is one less than the corresponding value in the table for c = g2.
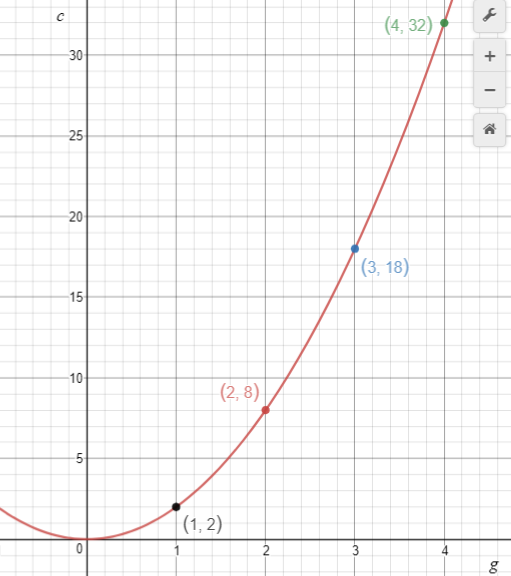
The second pattern is c = 2g2. Mary has allowed for her rabbit problem by planting double the number of cabbages in each group. The result is that each value for c in the table is two times the corresponding value in the table for c = g2.
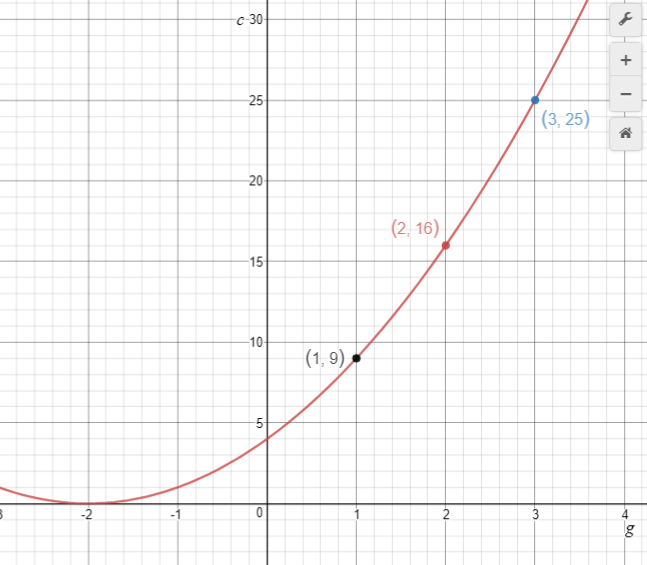
The third pattern is c = (g + 2)2 + 1. Mary is expecting a rabbit invasion! The result is that to find each value for c in the table find the corresponding value two groups ‘ahead’ in the table for c = g2 and add one.
The effect on each graph is as follows:
Translation down by 1 Increase in scaling by factor 2 Translation across of -2
Further Activities
Use these to extend students who have grasped the foundational concepts. You might choose to work with other students, developing their foundational knowledge, during this time.
Ask students to explore transformations to the equation y = x2 and the effect of those transformations on the graphs. Let them use a graphing tool to do so.
What happens to the graph if you add or subtract a constant to x2? Try these examples:
y = x2 + 3 y = x2 – 5 y = x2 + 1.5
What happens to the graph if you multiply x2 by a co-efficient? Try these examples:
y = 3x2 y = 1.5x2 y = -1x2 y = -3x2
What happens if you add or subtract a number from x before you square it? Try these examples:
y = (x + 1)2 y = (x - 1)2 y = (x + 4)2 y = (x - 4)2
What happens if you combine these transformations? Try these examples:
y = (x - 2)2 + 3 y = (x + 1)2 – 5 y = 2(x - 3)2 - 4
Session 3: Rectangular gardens
In this session the spatial patterns of lettuces drive the inquiry into relationships between the variables, group number and number of lettuces. The priority is for students to structure the spatial patterns to create rules and equations for the nth term.
- Introduce the three patterns using Animation 3. You may like to pause the animation between patterns to discuss what students ‘see’.
- Distribute Copymaster 1 (the patterns in paper form). For each pattern ask your students to:
- Record what Group 4 will look like.
- Record what Group 10 will look like.
- Record what Group n will look like.
You may need to explain the last instruction. That is, if given any value for the group number, how would you work out the total number of lettuces?
- Allow the students plenty of time to work on the problems, either independently or in small groups. Prompt them to look for connections. Working out a rule for the Pattern One should help them solve the other two patterns.
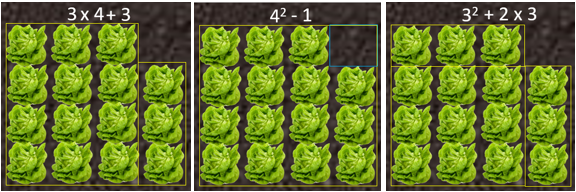
- Bring the students together to share their ideas. Be open to possible ways that the patterns might be structured to derive a general rule for the nth term. Animation 4 gives some examples of how the patterns might be structured with corresponding numeric expressions.
The numeric expressions are useful for developing general terms. Organising the expressions vertically can help students to relate the group number to numbers in the expressions.
Group Number | Pattern One | Pattern Two | Pattern Three |
1 | 1 x 2 or 12 +1 | 1 x 2 - 2 | 1 x 2 + 1 |
2 | 2 x 3 or 22 +2 | 2 x 3 - 2 | 2 x 3 + 2 |
3 | 3 x 4 or 32 +3 | 3 x 4 - 2 | 3 x 4 + 3 |
|
|
|
|
n | n(n+1) or n2 + n | n(n+1) – 2 | n(n + 1) + n |
For each pattern ask:
- What stays the same as the Group Number changes?
- What changes as the Group Number changes? In what way do those numbers change?
- How are the changing numbers related to the Group Number?
- Can your write an expression for the nth group number? (See table above)
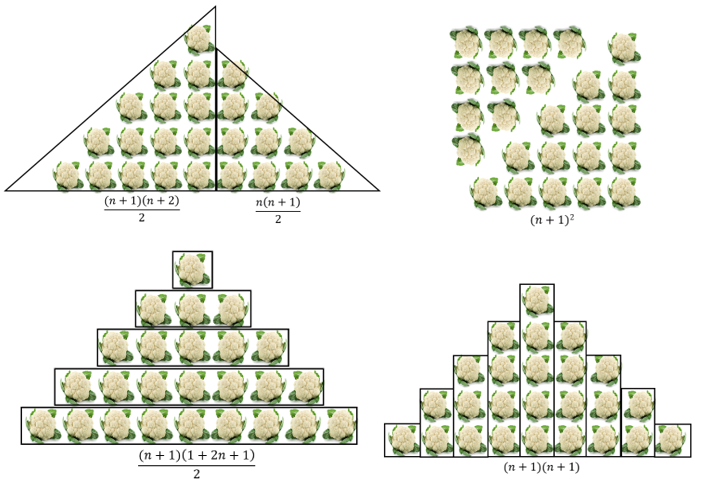
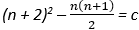
Different ways of structuring the patterns lead to different general rules. This provides rich opportunities for manipulating the expressions. For example, consider these three ways to structure Pattern Three.
n(n + 1) + n (n + 1)2 – 1 n2 + 2n
Further Exploration
Students proficient at manipulating expressions may enjoy proving algebraically that the expressions for general terms are equivalent. For example:
(n + 1)2 – 1 = n2 + 2n + 1 – 1
= n2 + 2n
Session 4: Connecting tables and graphs
Record the general rules from the previous pattern activities.
Pattern One | Pattern Two | Pattern Three |
n(n+1) | n(n+1) – 2 | n(n + 1) + n |
n2 + n | n2 + n - 2 | (n + 1)2 – 1 |
|
| n2 + 2n |
- Begin with the highlighted expressions. Point out that general rules can now be written as equations; c = n2 + n, and c = (n + 1)2 – 1. Ask students what they expect the graphs of these equations will look like. Remind students of what they discovered in Session 1. The graph of c = (n + 1)2 – 1 should be a translation of y = x2 one unit to the left and one unit down. Let the students explore their predictions using an online graphing tool or graphics calculator.
- Students should note that graphs of equivalent equations are the same. They might also note the connection between translation of the vertex from (0,0) and the constants in the equations. Students at this level are not expected to express equations in vertex form but they can develop some sense of positioning of the graph.
- Give students problems to solve using their graphs, such as:
- How many lettuces are in the Group 8 of Pattern One? …Group 12 of Pattern Two? etc.
- Which group number in Pattern Three contains 120 lettuces? etc. (These problems are equivalent to solving a quadratic, e.g. 120 = (n + 1)2 – 1.
The next phase of the lesson requires students to use abductive reasoning. Abduction involves seeing structure in one member of a pattern and applying that structure to other members. Therefore, it is quite different to the inductive reasoning that students have been expected to apply so far. In the attached PowerPoint one or two members of each pattern are shown.
- View the PowerPoint and ask the following questions:
- What ways could you organise the cauliflowers to count them? (Usually this involves seeing shapes)
- What do you expect the group either side of this one to look like?
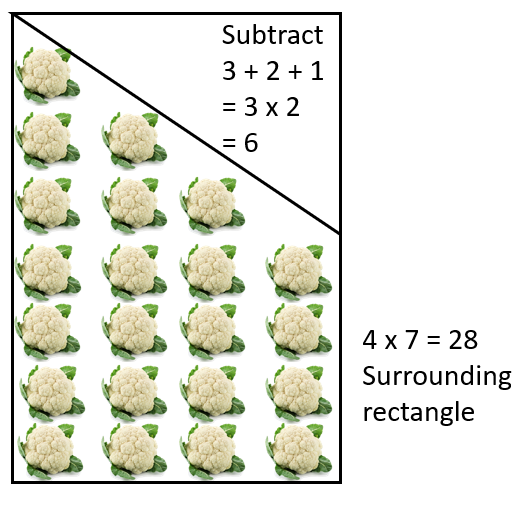
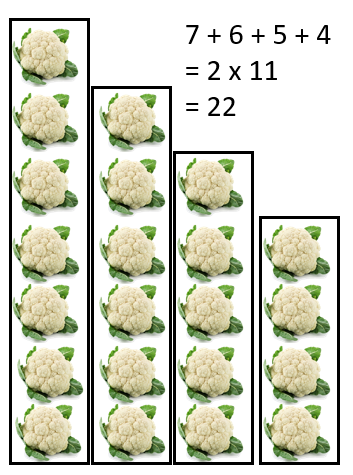
Encourage students to look for ‘chunks’ in the figure and relate the chunks to general rules they may have discovered so far. For example, Pattern two might be chunked any of these ways: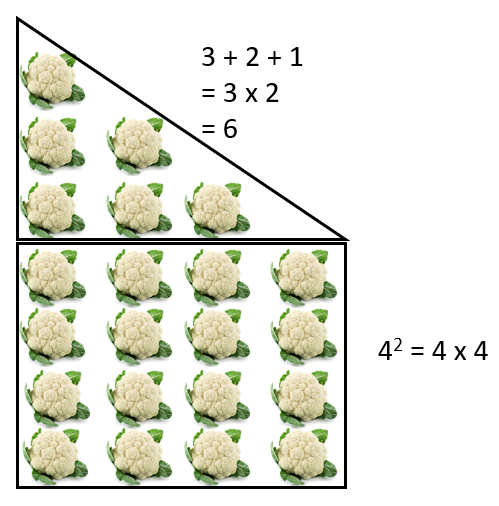
- After you have discussed how each pattern might be structured, give students Copymaster 2 (one copy between two or three students). Some students may need rectangular dot paper, so they can draw the first few members of each pattern. The challenge is:
- Create a general rule that tells the number of cauliflowers for any group number (n).
- Predict what the graph of your rule will look like then draw it on using graphing tool.
As students work watch for:
- Do they create a growing pattern that is consistent with the structure of the given member?
- Do they connect the Group Number as independent variable?
- Do they identify the elements that change and those that stay constant as the pattern grows?
- Can they express the relationships between the group number and the ‘chunks’ to create a general rule?
- Do they anticipate the shape and location of the graph?
- Gather the class to process students’ solutions. You may choose to focus on one pattern for which students have created the most diverse solutions. Try to capture generalisations in as many ways as you can. For example, consider Pattern Four.
You might use equivalent expressions to practise rearranging expressions. For example: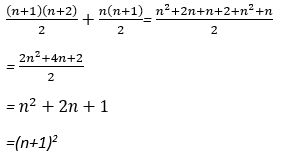
Graphs and equations can be used to solve problems with specific unknowns. For example, A general rule for Pattern Three is:
 (From the surrounding square less the nth triangular number)
How many cabbages are in the 15th pattern?
In equation form this is: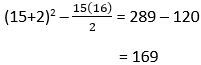
In graphic form this is: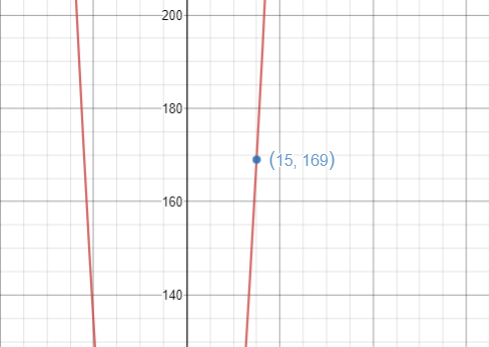
Dear families and whānau,
Recently, we have been learning about how to represent a quadratic relationship using spatial patterns, tables, graphs and equations. We have learnt to recognise the key features of a parabola, find unknowns from the graph of a parabola, and from simple quadratic equations. Ask your child to tell you about their learning.