Wildlife Counts
The purpose of this unit is to engage the student in carrying out the steps of a statistical investigation in a science context: predator control. Within this, students will develop their skills and knowledge related to statistical investigations, and interpret statistical and chance data.
- Plan an investigation.
- Use tables and graphs to display and analyse data.
- Discuss features of data displays.
This cross-curricular, context based unit has been developed with input from teachers across the curriculum. It aims to deliver the mathematics learning area, whilst meeting the demands of differentiated student-centred learning. For successful delivery of mathematics across the curriculum, the context should be meaningful for the students. Purposeful engagement with students' interests can lead to mathematical challenges appearing more approachable than when presented in isolation.
The activities within this unit treat the individual steps of an investigation in isolation, with the amount of guidance needed to be provided by the teacher should be dependant on the needs and knowledge of students. It should be noted that the intention of the NZ Curriculum achievement objective ‘plan and conduct investigations using the statistical enquiry cycle’ is for students to carry out a complete statistical investigation. This unit provides an opportunity for students to explore each of the stages of a statistical investigation, with the intended outcome of students understanding of the whole process and possessing the ability to carry out their own investigation.
The first session is an introductory activity that aims to spark the imagination of students. This is done by introducing the need for a particular idea or technique in mathematics that enables the deeper exploration of a significant context. It is expected that rich discussion is had around the context and the nature of the mathematics involved.
The subsequent five sessions are each based around a model of student-centred differentiated learning.
- A starting problem is used to focus students on the mathematics within the chosen context. These starting problems might take students around ten minutes to attempt and/or to solve, in groups, pairs or individually.
- It is then expected that the teacher will gather the students together to review the problem and to discuss ideas, issues and mathematical techniques that they noticed during the process. It may be helpful to summarise key outcomes of the discussion at this point.
- The remaining group of activities should be differentiated on the basis of individual learning needs. Some students may have managed the focus activity easily and be ready to attempt the reinforcing ideas or the extending ideas activity straight away. These could be attempted individually or in groups or pairs. The students who require further support could work through the building ideas activity together with the teacher. After further guidance, these students might attempt the reinforcing ideas activity.
- It is expected that once all the students have had the opportunity to work on their selection of building, reinforcing and extending activities, the teacher will circulate, checking in with individuals and groups of students.
The learning opportunities in this unit can be differentiated by providing or removing support to students, and by varying the task requirements. Ways to support students include:
- modelling the construction of tables, graphs, the analysis of data, and the making of summary statements
- providing extended opportunities for students to explore the graph types featured in this unit
- providing prompts for writing descriptive statements
- extending students by having them apply their percentage calculations to the analysis of graphs and tables
- strategically organising students into pairs and small groups in order to encourage peer learning, scaffolding, and extension
- working alongside individual students (or groups of students) who require further support with specific areas of knowledge or activities (e.g. identifying types of words, creating a graph).
The relevance of this unit can be enhanced with the establishment of links to your local area. Consider how learning around local predator-free spaces, eco-sanctuaries, predator eradication measures, and environmental advocacy groups might be used alongside this unit, in order to form these local connections.
Te reo Māori kupu such as taurangi (variable), tūtohi (table, chart of data), ōrau (percent), kauwhata pou (bar graph), kauwhata pouhere (histogram), whakakapi (conclusion), kohikohi raraunga (data collection), kauwhata rārangi (line graph), and ia (trend) could be introduced in this unit and used throughout other mathematical learning.
- Access to the internet and appropriate graphing software.
Introductory session
- Explain to the class that the Department of Conservation is working to make New Zealand ‘predator free’ by 2050. Use questions like those below to discuss this.
- What is meant by ‘predator free’?
- What data might this decision be based on?
- How can they measure their effectiveness?
- How can we (at school, at home, around the community) assist in achieving this goal?
- What variables might have been measured to suggest the need for the ‘predator free by 2050’ pledge?
- What are the variables should be measured to recognise the success of the goal to be predator free?
- What data collection methods can the Department of Conservation use to count wildlife and predator populations over the next 30 years?
- Record the key points from discussion in an appropriate format (e.g shared digital document, mind map, on sticky notes). You might need to address specific statistical concepts (e.g. what is a variable?) or provide time for students to research the information needed to answer these questions.
Session 2
This session focuses on comparing the distribution of predators over time from a graph display.
Activity
- Explain to students: A local bird sanctuary is protected from predators by good fencing and a trapping project run by volunteers. A record is kept of all the predators caught in the traps and when the traps are sprung (by a predator that ‘got away’).
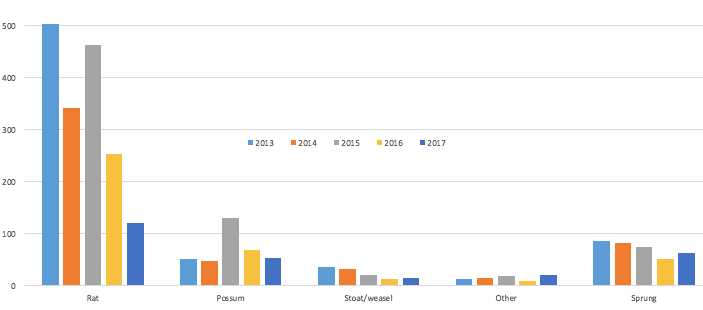
- Display the graph of the data for the first five years of the trapping programme (shown below) and discuss, using the following points:
- Describe the overall trend in trapping success shown in this graph.
- Which type of predator is the most prevalent in the traps?
- In early 2016, the bird sanctuary operated a poison drop as well as the trapping programme. Use the data below to comment on the effectiveness of the the poison drop in terms of predator control.
- Does the data tell you how many predators are present in the bird sanctuary?
- The graph shown above has the data grouped by trap contents. Why is this a useful choice of grouping?
- If the data was grouped by year, what trends/patterns would be more obvious to see?
Building ideas
- Show students the following table. This presents the raw data (number of animals caught per calendar year) from a local bird sanctuary’s predator trap programme.
2013 | 2014 | 2015 | 2016 | 2017 | |
Rat | 502 | 340 | 461 | 253 | 120 |
Possum | 50 | 47 | 130 | 68 | 53 |
Stoat/weasel | 35 | 32 | 20 | 12 | 14 |
Other | 12 | 15 | 18 | 8 | 20 |
Sprung | 86 | 82 | 73 | 50 | 62 |
- Discuss and explore, using the following prompts:
- If a trap has been sprung, we can assume that a predator was present but cannot count it as caught. Why not?
- Find the total number of predators caught in traps each year.
- Graph the total number of predators caught in traps each year.
- Comment on the overall trend of the total number of predator’s caught in in traps each year.
Model analysis of the data and creation of a graph, as necessary in response to the needs of your class.
Reinforcing ideas
- Explain to students: In the year following the poison drop, the bird sanctuary decided to further reduce the rat population with better management of visitor behaviour. They did this by banning food consumption within the predator controlled area and removing the rubbish bins (as they were no longer needed).
- Show students the data below. Ask them to comment on the effectiveness of the management of visitor food and rubbish.
2013 | 2014 | 2015 | 2016 | 2017 | |
Rat | 502 | 340 | 461 | 253 | 120 |
Possum | 50 | 47 | 130 | 68 | 53 |
Stoat/weasel | 35 | 32 | 20 | 12 | 14 |
Other | 12 | 15 | 18 | 8 | 20 |
Sprung | 86 | 82 | 73 | 50 | 62 |
Extending ideas
- Show students the graph below. This displays data from a local bird sanctuary’s predator trap programme, grouped by year.
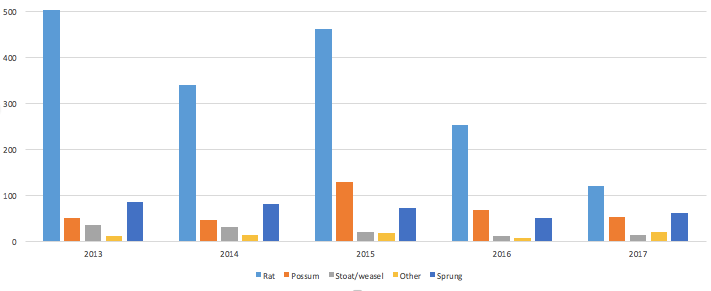
- Discuss, using the following prompts:
- How is the effectiveness of the poison drop early in 2016 shown in the graph?
- Initially, possum hunters were contracted to manage the numbers of possums. This contract was cancelled for various reasons. Suggest when the hunters’ contract was cancelled. Support your suggestion with evidence from the graph.
Session 3
This session focuses on communicating findings from a statistical investigation, using appropriate displays.
Activity
- Explain to students: A year 8 class has been taking part in a ‘predator free’ programme. It has made 12 traps from plastic milk bottles and set these up around the school grounds. Over one week, the class have caught the following predators:
Monday | Tuesday | Wednesday | Thursday | Friday | |
Rats | 3 | 1 | 0 | 2 | 0 |
Mice | 2 | 3 | 3 | 2 | 2 |
Other | 0 | 0 | 1 | 1 | 0 |
Sprung | 2 | 4 | 2 | 4 | 5 |
Nothing | 5 | 4 | 6 | 3 | 5 |
- Discuss: What conclusions can you draw about the predators around the school grounds from these data?
- How many traps are accounted for each day?
- What might be in the ‘other’ category? Would it be useful to list these by name?
- What precautions will the class need to have taken to run this programme safely?
Building ideas
- Have students look at the data collected by the year 8 class over the week of predator trapping. The data in this table are grouped by trap results, including predator type, over time.
- Tell students that a line graph, with a differently coloured line for each row in the table is a suitable method of graphing. You might explore some different line graphs to come up with a conclusion as to why this is.
- Have students construct a line graph using the data recorded in the table. Consider what grouping is appropriate and the level of modelling and structured guidance needed. Provide time for students to share their graphs with their peers, compare any differences, and revise their graphs in reflection of these differences.
- Describe the trends shown by the lines in the graphs. You may like to use terms such as; increasing, decreasing, constant, fluctuating, no clear trend.
Reinforcing ideas
- As a class, look at the data collected by the year 8 class over the week of predator trapping.
To show the trend of predator numbers over time, which type of graphs are the most appropriate for these data? - Graph the data in the table.
- Describe the trends shown in your table. You may like to use terms such as; increasing, decreasing, constant, fluctuating, no clear trend.
Extending ideas
- Look at the data collected by the year 8 class over the week of predator trapping. Consider, using the following points:
- Does the table format show the trends in the data?
- What is the daily count total? Why?
- Tell students: to show the total count for each day, with the trapped predator, missed predator and inactive traps separated, a stacked column graph could be used. Have them graph the data in this way and then describe the trends shown in their tables. Terms such as increasing, decreasing, constant, fluctuating, no clear trend might be used.
Session 4
This sessions focuses on gathering a range of data to support a more informed predator survey.
Activity
- Explain to the class: The year 8 class has been taking part in a ‘predator free’ programme wanted to know if they were effective in reducing the number of wildlife predators around the school. They have been collecting data on the activity in their 12 tunnel shaped predator traps. The students want to find out more about any predators that had not been caught in the traps. They have prepared ink pads and plain cards for the entrance to each of the trap tunnels. The predators entering the tunnels will get ink on their paws/feet as they enter the tunnel and will leave a footprint record of their visit.
Can you suggest a method of recording the footprint data along with the existing method of recording the trap data? Consider:
- How will the class distinguish between different species visiting the same trap?
- Is it possible for the class know how many of the same species have visited the same trap?
Building ideas
- Have students consider the footprint cards in front of the traps, and decide which of the following are valid statements, with appropriate justification.
- The footprint record can be used to count how many wildlife predators visit the traps.
- The footprint record will show how many wildlife predators are in the area.
- The footprint cards could be used to identify the predators that are springing the traps and escaping.
- Different species will leave a different coloured footprint.
- The footprint cards will help the class work out which are the most prevalent species of predator.
Reinforcing ideas
- Tell students: After a week of using the footprint cards, the class recorded the following data:
Caught | Footprints | Visited but not trapped | |
Rats | 5 | 12 | |
Mice | 8 | 10 | |
Other | 2 | 5 |
- Present them with the following task:
- Can you complete the section ‘visited but not trapped’?
- What percentage of each type of wildlife predator has been successfully caught in the trap it enters?
- Can the class use this information to estimate the wildlife predator population in the area?
- How can the class use this information to improve their traps?
- How can the class use this information to evaluate the effectiveness of their 12 traps over time?
Extending ideas
- Explain to the class: After a week of using the footprint cards, the class recorded the following data:
Caught | Footprints | |
Rats | 5 | 12 |
Mice | 8 | 10 |
Other | 2 | 5 |
- Pose the following tasks:
- Estimate the total number of predators that visited traps but were not caught.
- Why can you not be certain of the total number of predators that visited traps but were not caught?
- Find the ratio of the total number of caught to visiting (but not caught) predators.
- Looking at the data for one week, can you make the call that the traps work better for any one species of predator? Explain your answer.
Session 5
This session focuses on communicating findings using suitable displays.
Activity
- Tell the students: Before the year 8 class implemented a ‘predator free’ programme, it took part in Landcare New Zealand’s garden bird survey. The class were interested to learn that over the past ten years in their area, there has been an 11% increase in the tui count but a 13% decline in the fantail count and a 27% decline in the kereru count.
- Together, show this information on a suitable chart, diagram or graph.
- Discuss, using the following prompts:
- How have the birds been counted in the ‘garden bird survey’?
- The ‘garden bird survey’ is carried out on the same date each year. Why is this important?
- How reliable are the trends shown from the results of the ‘garden bird survey’?
- What other methods of tracking bird populations are there in New Zealand?
Building ideas
- Tell students: In the same region, some species of bird have shown an increase in population while others have shown a decrease.
- Have them suggest how this might affect the population for each of the following factors. They should explain their suggestions where possible.
- Reducing predator numbers.
- Reducing food supply.
- Reducing predator numbers and reducing food supply.
- An increase in the populations of other species of birds.
- Decreasing available habitat (e.g. clearing bush and building more houses)
Reinforcing ideas
- Provide time for students to find out about the trends in population of the birds in their region as measured in the Landcare Research New Zealand garden bird survey. They should consider how the native bird counts trending compare with the introduced species, and should show the information on a suitable chart.
Extending ideas
- Tell students: Predators such as rats and mice, possum and cats are not the only threats to native bird populations.
- Pose the following tasks:
- Find out about other possible threats.
- Which of the threats to native birds are of particular relevance to your community?
- Which of threats can be mitigated – and how?
- Create an infographic to display what you have found.
Session 6
This session focuses on communicating findings using suitable displays.
Activity
- Tell students: To measure the effectiveness of their predator traps on the bird population at their school, the year 8 class have taken a bird count for one day each month, over a period of five months. The results are as follows:
One Day Count | |||
Tui | Fantail | Kereru | |
July | 0 | 1 | 6 |
August | 2 | 0 | 8 |
September | 0 | 1 | 5 |
October | 4 | 3 | 6 |
November | 4 | 2 | 8 |
- As a class, construct a suitable graph so that:
- a sense of a time series trend is shown,
- the total number of these three types of bird sighted at each survey is shown,
- the count for each species is also shown.
Discuss, using the following prompts:
- How might the seasons affect the trend shown in these data?
- What other possible factors might affect the reliability of these data?
- From these data, can you say that one type of bird is more prevalent than another?
- From these data, can you comment on any trends in the population of the tui, fantails or kereru?
Building ideas
- Tell the students: the class wanted to compare the one day bird surveys with the monthly total predator catch numbers from their trapping programme. The results are shown below:
One Day Count | Monthly Count | |||
Tui | Fantail | Kereru | Predator Catch | |
July | 0 | 1 | 6 | 35 |
August | 2 | 0 | 8 | 31 |
September | 0 | 1 | 5 | 26 |
October | 4 | 3 | 6 | 15 |
November | 4 | 2 | 8 | 18 |
- Have students complete the following tasks:
- Construct a line graph to show the monthly predator catch count from July to November.
- Describe the trend of the monthly predator catch count from July to November as either increasing, decreasing, constant or no clear trend shown.
- Construct a line graph to show the one day total* bird count from July to November.
- Describe the trend of the one day total* bird count from July to November as either increasing, decreasing, constant or no clear trend shown.
*note that this total is of the three species counted and not of all birds present that day.
Reinforcing ideas
- Tell the students: the class wanted to compare the one day bird surveys with the monthly total predator catch numbers from their trapping programme. The results are shown below:
One Day Count | Monthly Count | |||
Tui | Fantail | Kereru | Predator Catch | |
July | 0 | 1 | 6 | 35 |
August | 2 | 0 | 8 | 31 |
September | 0 | 1 | 5 | 26 |
October | 4 | 3 | 6 | 15 |
November | 4 | 2 | 8 | 18 |
- Draw attention to the fact that the class collected data on the tui, fantail and kereru sightings over just one school day, and the predator catch over a full month.
- Have students find a suitable way of graphing these data to identify the trends in bird (sightings) and predator (catch) numbers.
Extending ideas
- Have students evaluate the reliability of the data collected by the class. The data on bird populations and predator catch numbers was recorded over a period of five months. They should consider the following:
- Was this a suitable period of time for trends to become apparent?
- What effect would the seasons during which the data were collected have on the apparent trends?
- What would you expect the trends in bird population and predator catch numbers to be over a longer period of time (ie, more than a year)?
- What other factors would come into play over this longer period?
Dear families and whānau,
As part of our mathematics programme, we have been carrying out statistical investigations in a science context: predator control. Ask your child to share one or more of their graphs with you, and the data it displays.