Fuel for a Commute
The purpose of this unit is to engage students in an integrated mathematics/technology context: technical knowledge (focused on fuel efficiency and vehicle running costs) through which they can apply their understanding of rates and proportions to solve problems involving distance and time. In turn, students develop their skills and knowledge on the Multiplicative Thinking and Patterns and Relationships mathematics learning progressions.
- Use rates and proportions to compare data.
- Find and describe a rate of change, for data given from a linear trend.
- Find and describe a linear trend.
This cross-curricular, context-based unit aims to deliver mathematics learning, whilst encouraging differentiated, student-centred learning.
The learning opportunities in this unit can be further differentiated by providing or removing support to students, and by varying the task requirements. Ways to differentiate include:
- roaming and supporting students in a variety of groupings to ensure they understand the task at hand, the skills needed to succeed, and can apply these skills in a suitable process
- varying the amount of structured scaffolding and guided teaching you provide to students when investigating new tasks
- providing opportunities for students to create their own problems related to a relevant context
- providing extended opportunities for students to revise and apply learning from throughout the unit
- modelling the application of ideas at every stage of the unit
- strategically organising students into pairs and small groups in order to encourage peer learning, scaffolding, and extension
- allowing access to calculators to decrease the cognitive load required in each stage of the unit
- working alongside individual students (or groups of students) who require further support with specific areas of knowledge or activities.
With student interest engaged, mathematical challenges often seem more approachable than when presented in isolation. The context presented in this unit around driving and its related costs (e.g. the cost of weekly commutes, efficiency of different car engines, performance of different fuels, performance of electric and petrol cars, annual cost of driving), could be enhanced through the making of connections to students' lives. For example, you might adapt the questions to allow students to investigate the fuel efficiency, weekly and annual cost, and performance of cars that are relevant to them (e.g. family or school vehicles, local buses).
Structure
The first session is an introductory activity that is aimed to spark the imagination of students, to introduce the need for a particular idea or technique in mathematics that would enable them to explore deeper into that context. It is expected that rich discussion may be had around the context and around the nature of the mathematics involved.
Following the introductory session, each subsequent session in the unit is composed of four sections: Introducing Ideas, Building Ideas, Reinforcing Ideas, and Extending Ideas.
Introducing Ideas: It is recommended that you allow approximately 10 minutes for students to work on these problems, either as a whole class, in groups, pairs, or as individuals. Following this, gather the students together to review the problem and to discuss ideas, issues and mathematical techniques that they noticed during the process. It may be helpful to summarise key outcomes of the discussion at this point.
Building Ideas, Reinforcing Ideas, and Extending Ideas: Exploration of these stages can be differentiated on the basis of individual learning needs, as demonstrated in the previous stage of each session. Some students may have managed the focus activity easily and be ready to attempt the reinforcing ideas or even the extending ideas activity straight away. These could be attempted individually or in groups or pairs, depending on students’ readiness for the activity concerned. The students remaining with the teacher could begin to work through the building ideas activity together, peeling off to complete this activity and/or to attempt the reinforcing ideas activity when they feel they have ‘got it’.
It is expected that once all the students have peeled off into independent or group work of the appropriate selection of building, reinforcing and extending activities, the teacher is freed up to check back with the ‘early peelers’ and to circulate as needed.
Importantly, students should have multiple opportunities to, throughout and at the conclusion of each session, compare, check, and discuss their ideas with peers and the teacher, and to reflect upon their ideas and developed understandings. These reflections can be demonstrated using a variety of means (e.g. written, digital note, survey, sticky notes, diagrams, marked work, videoed demonstration) and can be used to inform your planning for subsequent sessions.
The relevance of this learning can also be enhanced with the inclusion of key vocabulary from your students' home languages. For example, te reo Māori kupu such as pāpātanga (rate), hautau/hautanga (fraction, proportion, part of a whole), whakatairite (compare), raraunga (data), pāpātanga o te whiti (rate of change), and pānga rārangi (linear relationship) could be introduced in this unit and used throughout other mathematical learning.
- Graphing software
Introductory Session
The aim of this activity, which presents an opportunity to practise mathematical skills and knowledge in a science context, is to motivate students towards the given context and to inform teachers of students' understandings. Within this problem, students solve problems involving motion. Encourage the use of context-appropriate units.
- Introduce the following problem to students: Tom commutes daily, driving 25 km each way on the open road. The full cost of driving a car is quoted as being 75 cents per kilometre.
- How much does Tom’s weekly commute cost him?
- As students work, observe how they manage percentages and work to find and express a ratio. Use these observations to locate your students on the Multiplicative Thinking learning progression.
- Discuss, drawing attention to the following points:
- What is meant by the full cost of driving a car?
- How is this different to the fuel cost?
- Is 75 c/km a reasonable estimate of the full cost of driving.
- In what situations would the cost be higher?
- In what situations would the cost be lower?
Session One
This session focuses on describing and using a linear trend.
Introducing Ideas
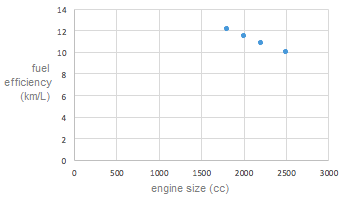
- Introduce the following problem to students: A car manufacturer makes the same car in various engine sizes, ie the body of the car is the same, but the engines are different. The graph below shows the average fuel efficiency in km/L of the different engine sizes (cc).
- What conclusions can you draw about the relationship between engine size and fuel efficiency?
- Discuss, drawing attention to the following points:
- Which is the most efficient engine?
- Why might someone choose to purchase the less efficient model?
- If the cars have a 40L fuel tank, how far could they drive between fills?
- These data describe average fuel efficiency. What are some ways that the way a car is used will affect its efficiency?
- These data appear to form a straight line. However, only a small range of engine sizes could be considered. Would it be realistic to have a point on this graph that related to, for example, 500 cc?
Building Ideas
- Introduce the following context to students: The table below displays data of fuel efficiencies (km/L) for different engine sizes. This is the data that was used to create the graph shown previously.
| engine size (cc) | fuel efficiency (km/L) |
| 2500 | 10 |
| 2000 | 11.5 |
| 1800 | 12.1 |
| 2200 | 10.8 |
- Support students to use this data and investigate the following:
- How far will the 2000 cc model travel on 10 L of fuel?
- How far will the 2500 cc model travel on 10 L of fuel?
- What is the overall trend of this relationship?
- How far would you expect a 1500 cc model of the same type of car travel on 10 L of fuel?
Reinforcing Ideas
- Support students to use the same set of data to do the following:
- Copy, or use a copy of, the graph and rule a line of best fit to show the trend of fuel efficiency versus, for the range of engine sizes shown.
- Write the rule for the trend in these data.
- Given that fuel costs an average of $1.90 per L, what would you expect a 300 km trip in an 1800 cc car to cost?
- Investigate: How much more expensive would the same trip be in a 2200 cc car?
Extending Ideas
- Support students to use the same set of data to do the following:
- Describe the overall trend of this relationship, for the range of data shown. (Using terms such as linear or non-linear, increasing, decreasing or constant).
- Consider: Would you expect this trend to apply for very small (eg 1000 cc) and very large (3500 cc) engines?
- Write a rule for trend shown in these data, incorporating the domain (range of engine sizes this trend applies to).
- Find the range of estimated costs of a 300 km trip for these cars, given that fuel costs an average of $1.90 per L.
Session Two
This session focuses on using rates and proportions to compare data.
Introducing Ideas
- Introduce the following context to students: A test was carried out on a mid sized car, using the three percentage concentrations of octane available in New Zealand petrol stations; 91, 95, 98. The car was first tuned to the fuel concentration, then with 15 L of that fuel concentration in its tank, the car was driven until the tank was empty. This was repeated for each of the fuels and the car was driven until empty on the same journey at similar speeds each time. The results were:
91 octane: The car travelled 230 km.
95 octane: The car travelled 238 km.
- If the relationship between octane rating and distance travelled was linear, how far would the car have travelled when the 98 octane was tested?
- Discuss, drawing attention to the following points:
- What conditions/variables were held as constant as possible when comparing these fuels?
- The test with the 98 octane fuel resulted in a trip of 240 km. Was this what you might have expected? Why/why not?
Building Ideas
- Introduce the following context to students: Testing the performance of different fuels, a car was driven on just 15 L of each concentration of octane:
91 octane: The car travelled 230 km.
95 octane: The car travelled 238 km.
98 octane: The car travelled 240 km. - Provide time for students to work through the following tasks:
- Find how many km/L the test car can travel on each of these concentrations of octane.
- If 95 octane costs $2.09 per L, what would the cost be of a 100 km trip in the test car using this fuel?
Reinforcing Ideas
- Introduce the following context to students: Testing the performance of different fuels, a car was driven on just 15 L of each concentration of octane:
91 octane: The car travelled 230 km.
95 octane: The car travelled 238 km.
98 octane: The car travelled 240 km. - Provide time for students to consider the following:
- Is the relationship between concentration of octane and distance the car will travel linear? Justify your answer.
- If 91 octane costs $1.98 per L, what would the cost be of a 25 km trip in the test car using this fuel?
- How many more litres of 91 octane would be needed to travel 25 km than 98 octane in the test car?
Extending Ideas
- Introduce the following context to students: Testing the performance of different fuels, a car was driven on just 15 L of each concentration of octane:
91 octane: The car travelled 230 km.
95 octane: The car travelled 238 km.
98 octane: The car travelled 240 km.
On the test day, 91 Octane cost $1.98 per L, 91 Octane cost $2.09 per L, 91 Octane cost $2.16 per L.
- Provide time for students to investigate which fuel gave the best value for money.
Session Three
This session focuses on finding and describing a rate of change, for data given from a linear trend.
Introducing Ideas
- Introduce the following context to students: A popular petrol fuelled car has average petrol consumption of 7.6 L per 100 km travelled. A similar sized hybrid (electric and petrol) car uses and average of 3.9 L of petrol per 100 km without any further external charging.
- How far would the petrol car car travel on 3.9 L of petrol?
- Discuss, drawing attention to the following points:
- How can the hybrid manage to make such a fuel saving without external charging?
- What are the advantages of petrol vehicles over hybrid?
- What are the advantages of hybrid vehicles over petrol?
Building Ideas
- Introduce the following context to students: A hybrid car has a petrol consumption of 3.9 L per 100km and uses 95 octane at $2.09 per litre. A petrol car has a consumption of 7.6 L per 100km and uses 91 octane at $1.98 per litre.
- Provide time for students to find the following:
- The cost of driving the hybrid car for 100 km
- The cost of driving the hybrid car per km
- The cost of driving the petrol car for 100 km
- The cost of driving the petrol car per km
- The percentage of savings in the cost per km from fuelling the hybrid car over the petrol car.
Reinforcing Ideas
- Introduce the following context to students: A hybrid car has a petrol consumption of 3.9 L per 100km and uses 95 octane at $2.09 per litre. A petrol car has a consumption of 7.6 L per 100km and uses 91 octane at $1.98 per litre. The average driving distance of a single car is 14 000 per km per year.
- Provide time for students to investigate the following:
- What is the cost of driving the hybrid car for 14 000 km?
- What is the cost of driving the petrol car for 14 000 km?
- Calculate the expected average fuel savings for running the hybrid over the petrol car in this example.
Extending Ideas
- Introduce the following context to students: Tom has a petrol car, but wants to change to a hybrid.
- Have students use the following information to estimate the time it would take for Tom to recover the cost of upgrading from his petrol car to a hybrid.
- A hybrid car has a petrol consumption of 3.9 L per 100km and uses 95 octane at $2.09 per litre. A petrol car has a consumption of 7.6 L per 100km and uses 91 octane at $1.98 per litre.
- The average driving distance of a single car is 14 000 per km per year.
- To trade his petrol car in for a hybrid, it will cost Tom $7 500.
Session Four
This session focuses on finding and describing a linear trend.
Introducing Ideas
- Introduce the following problem to students: Tom commutes 25 km each way to work. He currently drives a car that runs on 91 octane ($1.98 per L) and uses 7.6 L of fuel to drive 100 km. What is the cost of his weekly commute?
- Discuss, drawing attention to the following points:
- Tom earns a net weekly pay of $700. Do you consider Tom’s commute to be a reasonable expense?
- What costs other than fuel will he have in order to drive himself to work each day?
- How could he be saving some of the cost of his commute?
Building Ideas
- Introduce the following problem to students: Tom commutes 25 km each way to work. He currently drives his car spending $38 per week on fuel to commute.
- How far does Tom travel going to and from work in a week?
- Explain: The full running cost of his car (tyres, insurance, registration, maintenance, etc) is 75c per km.
- What is the full running cost of Tom’s weekly commute?
- What proportion of Tom’s $700 per week pay goes to fund his commute?
Reinforcing Ideas
- Introduce the following context to students: Tom commutes 25 km each way to work. He currently drives his car spending $38 per week on fuel to commute.
- How does Tom’s weekly commuting fuel costs compare with the estimated running costs of a car at 75c per km?
- What percentage of Tom’s $700 per week pay goes to fund his commute?
Extending ideas
- Introduce the following context to students: Tom decides to reduce the cost of his commute by giving a ride to a colleague who lives nearby. His colleague has offered to pay half of the petrol costs.
- Support students to use the information below to work out the proportion of the actual cost of the commute his colleague is paying for.
- Tom commutes 25 km each way to work.
- He currently spends $38 per week on fuel to commute.
- The full running cost of his car (tyres, insurance, registration, maintenance, etc) is 75c per km.
Session Five
This session focuses on finding and describing a linear trend.
Introducing Ideas
- Introduce the following context to students: Tom currently drives to work. The running cost of his car is 75c/km. If he changed to a hybrid car, the cost of driving would drop to 40c/km. If he changed to an electric car, the cost would be 30c/km. If he rode a bicycle, the cost would be 20c/km.
- Support students to show this information on a suitable graph.
- Discuss, drawing attention to the following points:
- Which is the most sensible option for Tom’s commute?
- What factors other than running costs should Tom consider if he is thinking about changing how he gets to work?
Building Ideas
- Introduce the following context to students: Tom drives a total of 250 km each week to get to work. The running cost of his current car is 75c/km. If he changed to a hybrid car, the cost of driving would drop to 40c/km.
- Tom works 48 weeks in a year. How far does he travel in his annual commute?
- What is the annual cost of driving his current commute?
- What would his annual cost of commuting be if he drove a hybrid car.
How much could Tom save, annually, by switching to a hybrid car?
Reinforcing Ideas
- Introduce the following context to students: Tom currently drives 25 km each day each way to get to work. The full cost of his commute is $188 per week. He has decided to get fit and save money by cycling to work.
- Have students consider the following points and work out the time it will take for Tom to "break even" if he starts commuting by bike.
- Tom wants to buy a $2000 road bike.
- The average maintenance and repair costs of commuting by bike is 20c/km
Extending Ideas
- Introduce the following context to students: Tom drives a total of 250 km each week to get to work. The running cost of his car is 75c/km. If he changed to an electric car, the cost would be 30c/km. and he would need to find $10 000 to fund the replacement and to fit a charging station in his garage.
- Tom works 48 weeks in a year. How much would he save on the annual cost of commuting if he drove an electric car.
- Explain to students: Tom would need to find $10 000 to fund the replacement of his current car to an electric one and to fit a charging station in his garage.
- How many years would it take for Tom to pay the cost of changing from a petrol to an electric car for commuting?
Dear parents and whānau,
In class we have been applying understanding of rates and proportions to solve problems involving distance and time, within the context of fuel efficiency and vehicle running costs. Ask your child to share their learning with you.