Fill it up - flat space
This integrated unit combines measurement of area with multiplication, and algebraic thinking.
Area is an attribute, a characteristic of an object. The attribute of area is the space taken up by part of a flat or curved surface. Usually, we begin by helping students think of area as an attribute before formally measuring it. Use contexts in which students compare flat spaces by size such as comparing pancakes or footprints. Note that “biggest” may be perceived in different ways. The most common confusion is between area (the space covered) and perimeter (the distance around the outside).
Different contexts can be used to explore the attribute of area. In these lessons, the main context used is around measuring land. Suppose some students think that a playing field is bigger than another because they spend longer walking across one field. “How many steps would it take to cross each field?” is an example of an enabling prompt. Partitioning and combining shapes are also useful ways to promote understanding of conservation of area and can lay groundwork for ideas about the areas of triangles, rectangles, trapezia, parallelograms and other polygons in later years.
Formal measuring of area with units will only make sense to students if they relate their methods to the process of measuring other attributes such as length and mass. Students need to see the need for units and identify the qualities of units that are appropriate. They also need to realise that a number alone does not convey a measure unless the unit is stated as well.
Units require the following properties:
- Units are all the same. You can mix units but that makes it harder to be precise and compare measures.
- Units fill a space with no gaps or overlaps. This explains the convention for using squares that tessellate, by equal measure in height and length, in arrangements of rows and columns.
- More smaller units fit into the same space as larger units. Smaller units tend to give a more precise measure. Note that if the smaller units are one quarter of the size of the larger units then four times as many fill the same space.
- Units can be partitioned and joined. Note the connection to fractions, e.g. two half units can make a whole unit.
The standard units of area in real life are the square centimetre (cm2), square metre (m2), hectare (ha.) and square kilometre (km2). While the proportional difference between metres and centimetres is manageable with length, the proportional difference between square centimetres and square metres makes size comparison difficult.
Consider the relationship between square centimetres and square metres. There are 100 x 100 (i.e. 10 000) square centimetres in one square metre. That is the same relationship as between square metres and hectares. A hectare is 10 000 m2. Hectares are used to measure areas of land. Think of a hectare as an area that is 100m by 100m. That means that 10 x 10 = 100 hectares are in one square kilometre. Square kilometres are used to measure large areas of land. For example, Rakiura/Stewart Island has an area of 1 746 km2 or 174 600 hectares.
Specific Teaching Points
Sessions One and Two
A suitable unit for measuring area must have these qualities:
- Be a piece of area (two dimensional)
- Units must be the same size
- Units should fit together with no gaps or overlaps
- Units should be of a size that gives adequate precision (accuracy).
Session Three
The area of a flat shape is conserved (stays constant) as parts of it are moved to different places on the shape. Any shape can be ‘morphed’ into a shape with the same area by ‘giving and taking’.
Session Four
Area is the amount of flat space enclosed by a shape. Perimeter is the distance around the outside of a shape. Shapes with the same area can have different perimeters, and shapes with the same perimeter can have different areas.
Session Five
A growing pattern can be structured by looking at how the figures are organised. Noticing structure helps with counting the area of a figure, and with predicting further figures in the pattern. Identifying sameness and difference in figures can help in creating a rule (generalisation) for all figures in the pattern.
Observations of students during this unit can be used to inform judgments in relation to the Learning Progression Frameworks. Click for tables of guidelines.
The learning opportunities in this unit can be differentiated by providing or removing support to students and by varying the task requirements. Ways to support students include:
- providing physical materials, such as objects to use as units of area. This is essential for all students, but particularly important for students who need to understand the iteration of identical units
- cutting and moving parts of shapes around to show that shapes can look different but still have the same area (conservation)
- explicitly modelling of filling a flat space with no gaps or overlaps
- connecting previous work students may have done with multiplication and division to counting the number of units in arrays
- making calculators available to ease calculation demands, particularly when factorisation is involved, e.g. finding all rectangle with area of 54m2
- modelling how to record measurement processes and answers using symbols
- encouraging sharing and discussion of students' thinking
- using collaborative grouping (mahi tahi) so students can support each other, share strategies, and experience both tuakana and teina roles.
Task can be varied in many ways including:
- manipulating the complexity of the shapes that students work with
- reducing number size where factorisation is required
- allowing flexibility in the way students find areas.
The contexts for this unit can be adapted to suit the interests and cultural backgrounds of your students. Look for everyday examples when your students encounter area. Examples might involve spaces that are meaningful to them, such as their own bedroom, lounge, or section at home. Portions of food, such as pancakes or pies, can be compared by area. Students interested in environmental issues might be motivated by contexts such as the areas covered by drift nets or oil spills. Students might find comparing the size of land areas interesting, e.g. How many times does Rarotonga fit into the North Island? Which is larger Upolo (Samoa) or Espiritos Santos (Vanuatu)? Students may wish to share iwi and hapū connections and compare the size of areas that they whakapapa back to. For example, children living in the South Island may whakapapa back to Taranaki iwi. High achieving students might be interested in population density.
- Copymaster 1
- Copymaster 2
- Transparent 1 cm grid and 5 mm grid made with Overhead Projector Transparencies
- PowerPoint 1
- PowerPoint 2
- PowerPoint 3
- PowerPoint 4
- Video introducing Three Islands (mp4, 13MB).
- Video introducing the square metre (mp4, 38MB)
Prior Experience
Students are expected to have some experience with measurement of other attributes, such as length, using informal units. They should also have some knowledge of multiplication facts and understanding of how to apply multiplication to finding the number of items in arrays. Consider what multiplication strategies your students are confident using. Your students might benefit from revisiting multiplication strategies at the beginning of these sessions, or might benefit from visual reminders of the strategies.
Session One: Three Islands
- Play this video introducing Three Islands (mp4, 13MB).
- Discuss:
- Size of an island can be measured by coastline (perimeter) or inside space (area).
- Measurement requires the use of a unit because the islands cannot be directly compared, i.e. brought together to size match. What units are students going to use?
- Put the students into small groups of two or three participants, and ensure they have opportunities to experience both taukana and teina roles. Each group needs an A3 enlarged version of Copymaster 1. Colour is not necessary. Provide the students with a choice of materials. Include items like; string, nursery sticks, dry pasta, beans (different sizes are good, e.g. plastic, lima, red), chickpeas, counters, square tiles, transparent 1 cm grid and 5 mm grid made with Overhead Projector Transparencies. Ask students to record their thinking as they work.
- Allow the students plenty of time to compare the islands. Look for the following:
- Do students distinguish perimeter from area?
- Do students use a single unit consistently with awareness of iteration (copying with no gaps or overlaps)?
- Do students use sensible number strategies to count the units?
- If possible take photographs of the students working and play these images as a few groups share their methods with the class. You might select groups to focus on the bullet points above.
Session Two: Measuring Flat Space
- Tell students that they are thinking about flat space (area) rather than both area and perimeter. You are interested in how they measure the area of an island.
- Work through the slides of Powerpoint 1. It shows other students working on Three Islands. Ask the students what they notice. Particular points to highlight are:
- Slide Two: The students are using different units. How will they compare their measures?
- Slide Three: The students are measuring coastline (perimeter) using pasta. Will that tell them about flat space (area)?
- Slide Four: The students are using square tiles. Are squares a good unit to use? Why or Why not?
- Slide Five: The students have filled one island up and moved the lima beans to the other islands. Is this a good strategy or not? Why?
- Slide Six: The students have used square tiles and pasta. Will that work to compare the flat spaces (areas) of the islands? What could the students do?
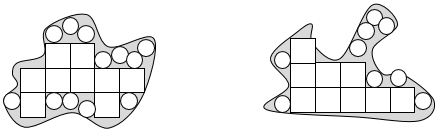
- Provide the students with copies of Copymaster 2, which contains various approaches to measuring two different islands. Ask the students to discuss the measuring strategy that is used. Tell them to think about the following questions: What is correct about the strategy? What is incorrect about the strategy?
- Look for:
- Page One: There are gaps and overlaps with the counters. Why are circles hard to use as a unit of area?
- Page Two: There is a mixture of units (square tiles and beans). Could the units be converted to a measure with one unit, e.g. one square for two beans?
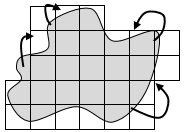
- Page Three: The units are all the same but the Left Island has area missed and Right Island has tiles outside the coastline. How can you allow for missing or outside parts of the area?
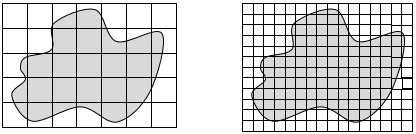
- Page Four: The units are all square tiles but they are different sizes. How many Left Island squares fit into a Right Island square? How could this ratio be used?
- After a suitable period of group discussion gather the class to compare their ideas and to decide which island has the most area. Discuss the ’give and take’ of part units combining to a full unit. Record the measures using both number and units, e.g. 46 small squares (Left island) and 11 large squares (Right Island).
- Discuss: What is our problem? (Need the same unit). Converting 4 small squares to one large square results in 11½ large squares being the area of Left Island, making it larger.
- Discuss: How trustworthy is the result given the ‘give and take’ of part units?
This will raise issues of precision. Small squares are more precise than large squares. Why?
Session Three: Megabites
- Use PowerPoint 2 to tell the story of Yap, the hard-working sheepdog. When the farmer changes Yap’s biscuits he gets suspicious that he has been duped. The key ideas being developed are:
- Conservation of area – re-arrangement does not alter the internal space.
- Partial units can be created for more precision and these partial units can be combined.
- Ask: How might Yap check to see that the biscuits are the same size?
- Students might suggest overlapping the biscuits to directly compare them. That is a useful suggestion.
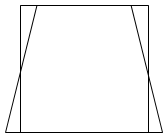
Note that by giving and taking, the overlapping triangles can fill the missing space, transforming the trapezium into the square. The biscuits are the same area.
Students may suggest other strategies involving units. The fourth slide of the PowerPoint 2 has an overlay of square units. - Ask: Why might Yap use squares? (no gaps or overlaps)
- Discuss: How will he allow for part squares with the Bonza biscuit?
- Read the final slide which has a letter from Yap to the Dog Biscuit Company. The challenge is to create different shaped biscuits that are still 36 squares in area.
- Ask the students what shapes they might try for the new biscuits. Make a list of shapes, e.g. rectangle, parallelogram, equilateral triangle, hexagon, octagon, etc. Closed curves such as the circle and ellipse will be very challenging but encourage the students to try. High achievers might look for area formulae online.
- Provide students with squared paper, e.g. Copymaster 2 enlarged onto A3, rulers and scissors. In their teams students need to collaborate to create at least eight different new biscuit designs that are 36 squares in area. At this stage keep the shapes students create separate so they can be sorted later. On the back of any shapes, ask students to record how they checked that the biscuit was 36 squares in area.
- After a suitable time of exploration, gather the class to look at the different biscuit shapes. Sort the biscuit shapes into categories by their common properties. Visually compare the shapes to see if they look to have the same area. Points to bring out include:
- Discuss: What rectangles are possible? Rectangles can be recorded systematically as expressions, i.e. 1 x 36, 2 x 18, 3 x 12, 4 x 9, 6 x 6. Ask the students to identify what the factors refer to in each rectangle and why 4 x 9 is really the same biscuit as 9 x 4 by the commutative property.
- Discuss: What is the relationship between a triangle and the surrounding rectangle? For example, this diagram shows two different triangles.
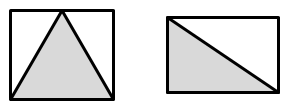
The diagrams show that the triangle is one half the area of the surrounding rectangle. For example, if a triangle is 36 squares in area then the rectangle must be twice that area, 72 squares. - New shapes can be made by starting with a ‘parent’ shape that is 36 squares in area and altering the shape by ‘give and take’. For example, a rectangular biscuit might be altered to form an interesting shape with the same area.
Session Four: Yap’s Run
- Play the video introducing the square metre (mp4, 38MB). Discuss what kinds of areas are measured in square metres, e.g. house floors, driveways, sports fields and courts. Show the students a square metre made from newspaper and tape. You might choose to construct the square metre in front of the class so they see how it is made.
- Ask: How would we figure out the area of our classroom in square metres? Why would we want to do this? We might want to recarpet.
- Invite suggestions. Using an array of columns and rows is more efficient than mapping in the square metres one at a time. Link multiplication with the arrangement of rows and columns, e.g. 6 columns of 4 square metres each has an area of 6 x 4m2 = 24m2. Explain that m2 means the unit, square metre. For homework students might investigate the cost of re-carpeting the classroom online, or figure out the area of a space in their homes or community.
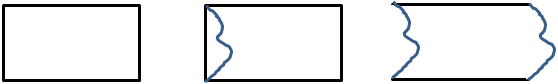
- Show PowerPoint 3: Yap’s Run.
- Stop on Slide 3 to ask students to check that each design has an area of 54m2. The students will need to partition two of the designs into smaller areas and combine the measures. Also ask what the perimeter of each enclosure is? Does the perimeter matter? Share and have a kōrero about your thinking.
- Move on to Slide 4 where the problem is posed. Challenge the students to create an interesting shaped run for Yap that does not exceed a perimeter of 45 metres. Let the students create scale drawings of the enclosures using grids in their mathematics book. Expect them to label each side of the run with appropriate measures and show clearly how the area was calculated. Slide 5 of PowerPoint 3 shows an example with some measures shown. The perimeter of that run is greater than 45 metres. See if the students can work the perimeter out.
- Give the students time to create their favourite run. Collect the diagrams at the end as work samples for assessment and display. You may like to go outside with some cones and a trundle wheel to mark out some designs in real size. Use the paper square metre as a benchmark and ask the students to calculate the area of parts of the run.
Session Five: Farmer Joe’s Garden
In this lesson students apply their understanding of area to a growing pattern. The task can be used to assess several aspects of mathematics, including multiplicative thinking, measurement, algebraic thinking and equations and expressions.
- Show PowerPoint 4: Farmer Joe’s Garden.
Slide 2 presents the shape of the garden in Year Four. Ask the students what they notice. Look for them to identify properties of the shape and sections of the garden that will be useful structures for finding area. Ask the students to collaborate (mahi tahi) in pairs to decide on the area of the Year 4 garden. You may need to remind them that each small brown square represents one square metre (1m2). Ensure all students explain their thinking and experience both tuakana and teina roles in this task. - After a suitable time, have a kōrero about the various ways they structured the Year 4 garden to find its area. Highlight the use of multiplication to find the area of arrays within the garden. Slides 3-6 show different ways to find the area of the garden. For each slide discuss how the structure could be recorded using an equation.
- Slide 3: 5 x 4 + 2 x 5 + 2 x 4 = 38 m2. Note that brackets are not needed with the order of operations but you might like to record (5 x 4) + (2 x 5) + (2 x 4) = 38 m2. Ask students to identify the connection between each multiplication expression and the diagram on Slide 3.
- Slide 4: 7 x 4 + 2 x 5 = 38 m2. How is this equation similar but different to that for Slide 3? Note that 7 x 4 is split into 5 x 4 + 2 x 4 in the equation for Slide 3.
- Slide 5: 5 x 6 + 2 x 4 = 38 m2. Compare this equation to that for Slide 3. Note that 5 x 4 and 2 x 5 combine to form 6 x 5 or 5 x 6 using the commutative and distributive properties.
- Slide 6: 7 x 6 – 4 x 1 = 38 m2 or just 7 x 6 – 4 = 38 m2.
- Slide 7 invites the students to structure successive members of the growing pattern. Encourage the students to represent arrays in each garden using multiplication. For example, the gardens for Years 1-3 might be shown as:
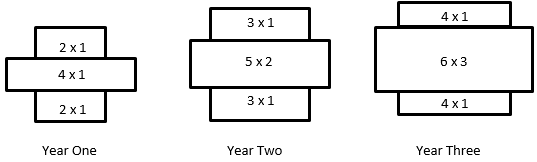
- Structuring is very important if students are to generalise the pattern for later years. Using the same idea Years 5 and 6 would look like this:
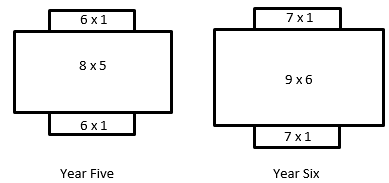
- For both years, discuss: What is different and what is the same? How is the area of the middle rectangle related to Year?
- Slide 8 requires students to predict the area of the garden for Year 12. This is a challenging task but students can use table based strategies if they cannot generalise the structure. Here is a table of values for the pattern:
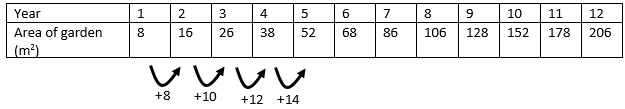
If they look for patterns in the differences students might notice that those differences grow by two each year - Before Europeans arrived in Aotearoa, Māori grew crop plants that the first Polynesian settlers brought from tropical Polynesia. Kūmara was the main crop.
Māori had neat māra kūmara (kūmara gardens), about 0.5–5 hectares in area, on sunny, north-facing slopes. Remember, a hectare is 10 000 m2. We can think of a hectare as an area that is 100m by 100m.
Māra kūmara consisted of puke (mounds) formed from loosened soil, arranged either in rows or in a recurring quincunx pattern (the shape of a ‘5’ on a dice). Kūmara tubers were planted in the mounds.
Farmer Joe would like to plant a māra kūmara. Ask the students to collaborate (mahi tahi) in pairs or groups of three to plan what Farmer Joe’s māra kūmara could look like and help decide how the kūmara could be arranged. The garden should be between 0.5–5 hectares in area. Students could use the 1 cm grid to design a scale model of their gardens on, this time imagining each square as 1m2. This image could be shown to students so they have an idea of what a traditional māra kūmara could look like. They may also like to see the modern māra kūmara at the Hamilton Gardens. - Ensure students have opportunities to experience both tuakana and teina roles.
- Kūmara need to be planted with about 50cm of space. How many could you fit in one square metre if they were arranged in rows? If they were arranged in a quincunx pattern?
- Will you arrange the kūmara in rows, or quincunxes?
- What is the area of your māra kūmara in square metres? In hectares?
- How many kūmara could be planted in your māra kūmara?
- Students should share their decisions and their completed plan for Farmer Joe’s māra kūmara.
Dear parents and whānau
This week we are investigating problems about area, the amount of flat space. We will look at suitable units to measure area so that no gaps or overlaps occur. We will learn to use multiplication to count the number of units in an area efficiently and how to record measurements of area using numbers and units, like 24m2 (twenty-four square metres).
We will also investigate a growing pattern with area and predict further members in the pattern.