Kai Moana
This is a level 3 algebra strand activity from the Figure It Out series.
A PDF of the student activity is included.
Click on the image to enlarge it. Click again to close. Download PDF (483 KB)
use a graph to look for a pattern
classmate
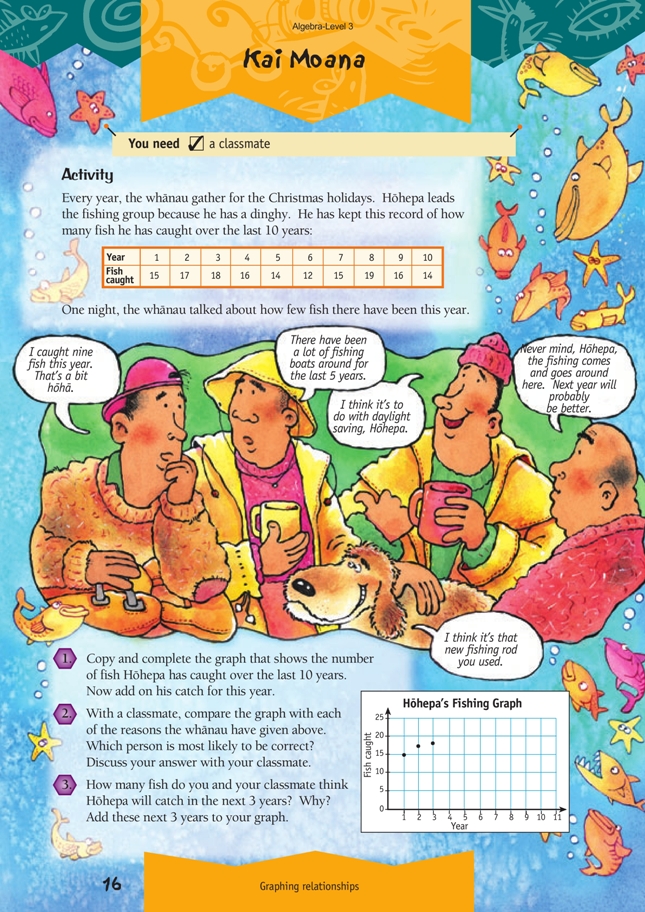
Check that students can tell which person is Hōhepa. (He’s the person on the left.) They need to know this to answer question 1.
Various explanations of the graph are given in the answers. If students graphed the data in the In/Out tables on pages 10–11 and 12–13 of the students’ booklet, you could ask them to compare these graphs with their fishing graph for this page. They should notice that the points on their graphs of the In/Out tables form straight lines. This is because the relationship between the x axis values and the y axis values is constant. But the points on Hōhepa’s fishing graph are not in a straight line, and this is because the relationship between the year and the number of fish caught is not constant. If it were constant, it would have been easier for Hōhepa’s whànau and the students working on this activity to explain the pattern in the number of fish caught.
Another discussion point is the way the slope of a line that joins the points shows how quickly or slowly the number of fish caught is changing. If the line slopes down sharply, the number of fish caught is decreasing rapidly. If the line slopes up gently, the number of fish caught is increasing gradually. Graphs are often interpreted in this way in the news when organisations or politicians are trying to prove how quickly or slowly inflation or employment is changing.
From the table of data used for question 1, students should be able to add realistic data to their chart. The catch for years 11, 12, and 13 should increase if the pattern continues.
Answers to Activity
1.
2. Answers will vary. Daylight saving and the type of fishing rods used are unlikely to affect the number of fish caught. The graph does not show that the number of fishing boats around in the last 5 years has had a major impact on the number of fish caught. So it may just be that this year is low for no particular reason. (“The fishing comes and goes around here.”)
3. Answers will vary. Some students may think that it will get worse. On the other hand, the graph may be part of a pattern and the fishing could get better again. (Some students may see a pattern of an increase for 3 years and then a decrease for
3 years.)