Getting to work
The purpose of this activity is to engage students in making links between displays of data and the conclusion drawn by others.
This activity assumes the students have experience in the following areas:
- Posing questions for data-based investigation.
- Exploring how to collect data that is needed to answer a question.
- Sorting and resorting data to look for patterns and differences.
- Answering questions using data.
The problem is sufficiently open ended to allow the students freedom of choice in their approach. It may be scaffolded with guidance that leads to a solution, and/or the students might be given the opportunity to solve the problem independently.
The example responses at the end of the resource give an indication of the kind of response to expect from students who approach the problem in particular ways.
A class took home a survey to find out how their parents travel to work.
They got 24 responses.
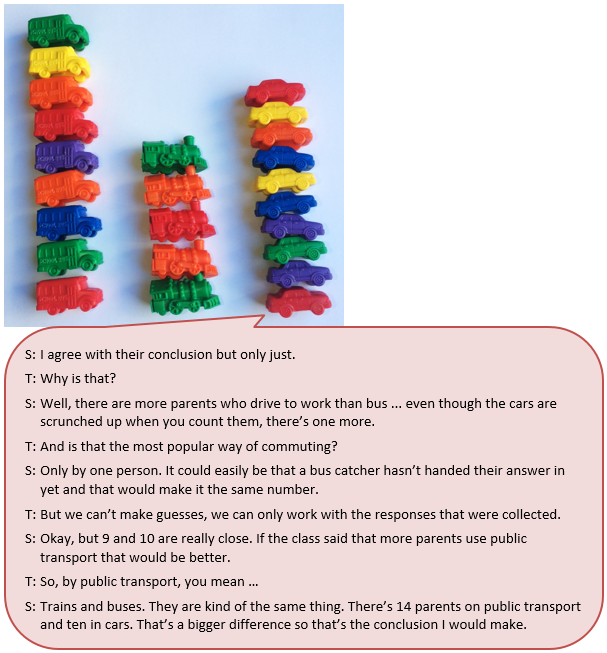
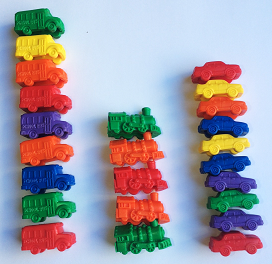
They matched each of their responses with a transport sorting shape and displayed them like this.
The transport options were car, bus and train.
The class came up with the conclusion:
The most common way our parents get to work is by car.
Explain how their arrangement of transport shapes shows this.
The following prompts illustrate how this activity can be structured around the Analysis and Conclusion parts of the Statistical Enquiry Cycle.
Analysis
The analysis section is about exploring the data and reasoning with it.
- Does the graph help me answer my question?
- What does the graph show about how parents get to work?
- What differences can I find?
- Which kind of transport if most used? Why might that happen?
- Are there other ways to display the data? Which way is best? Why?
- Is there another way to sort the data? What question will that sorting answer?
Conclusion
The conclusion section is about answering the question in the problem section and providing reasons based on their analysis.
- Have I answered my original question? If not, why not?
- How might I convince someone else I have answered the question?
- What displays best show what I have found out?
- Is my summary of findings clearly written so others can understand it?
- Have I the display/s to support my ideas?
- Why do I think car travel is the most used way to get to work?
- What other things have I learned and what further questions do I have?
Examples of work
Work sample 1
The student counts the number of objects in each transport bar and concludes there are more cars than buses or trains. They use the count to support the claim.
Click on the image to enlarge it. Click again to close. 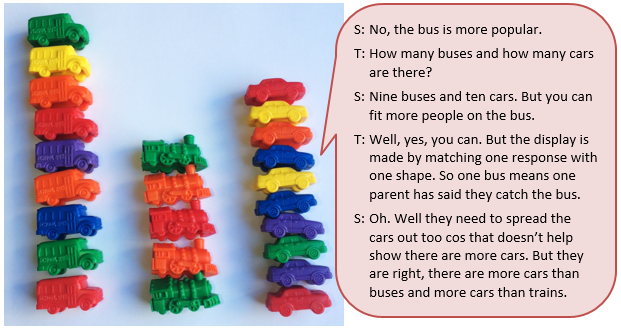
Work sample 2
The student counts the number of objects in each transport bar and notes that the numbers of car and bus travellers is very close. They suggest a resorting of the data into public transport and personal transport to make a different claim.
Click on the image to enlarge it. Click again to close.