Getting to School
The purpose of this activity is to engage students in carrying out a statistical investigation (using the PPDAC cycle: problem, plan, data, analysis, conclusion) that leads them to tell a class story.
This activity assumes the students have experience in the following areas:
- Posing questions for investigation using data.
- Planning how “I wonder…” questions can be answered.
- Gathering or accessing data relevant to a question.
- Analysing data to look to patterns, differences, and trends.
- Reporting on the results of an investigation to answer a question.
The problem is sufficiently open ended to allow the students freedom of choice in their approach. It may be scaffolded with guidance that leads to a solution, and/or the students might be given the opportunity to solve the problem independently.
The example responses at the end of the resource give an indication of the kind of response to expect from students who approach the problem in particular ways.
A teacher wondered how her class usually travelled to and from school each day. Carry out an investigation to find out how the students in your class arrived at school today.
- Pose a question to investigate.
- Collect data from your class.
- Display your data.
- What did you find out?
The following prompts illustrate how this activity can be structured around the phases of the Statistical Enquiry Cycle.
Problem
The problem section is about what data to collect and who to collect it from and why it’s important.
- What is my investigation question? Can I write my question so it is easily understood?
- Why is my question important? Who might find my question interesting?
Plan
The planning section is about how students will gather the data.
- How will I go about answering this question?
- What will I need to know?
- How will I find the data that I need? Is the data already available or will I need to gather it?
- Who will I ask? Will those people give me enough data? (The sample is specified in this case but students might be interested in difference among classes.)
- Can I predict possible answers to my question, even before I look at data?
- What might my answer look like?
Data
The data section is concerned with how the data is managed and organised.
- How will I organise my data as I gather it, or retrieve it?
- What digital or written tools will help my organise my data? (Paper methods might include tally charts and bar charts. Creating a CSV file will allow use of software like CODAP.)
- How will I protect the data I gather or retrieve so it is safe?
Analysis
The analysis section is about exploring the data and reasoning with it.
- Have I reflected back on my question so I am clear what I am trying to find out?
- How can I display my data in different ways to look for patterns, and differences?
- What tools will help me to display the data in different ways? What ways are appropriate to my data and help answer my question?
- What variation can I see in my data? Why are some ways of getting to school more popular than others?
- Can I make preliminary statements about my findings, starting with “I noticed that...”
- Am I developing ideas about what the answer to my question might be?
Conclusion
The conclusion section is about answering the question in the problem section and providing reasons based on their analysis.
- Have I answered my original question? If not, why not?
- How might I convince someone else I have answered the question?
- What displays best show what I have found out?
- Is my summary of findings clearly written so others can understand it?
- Do I go back to the context to suggest why the patterns, and differences occur? (Why is car travel so popular?)
Examples of work
Work sample 1
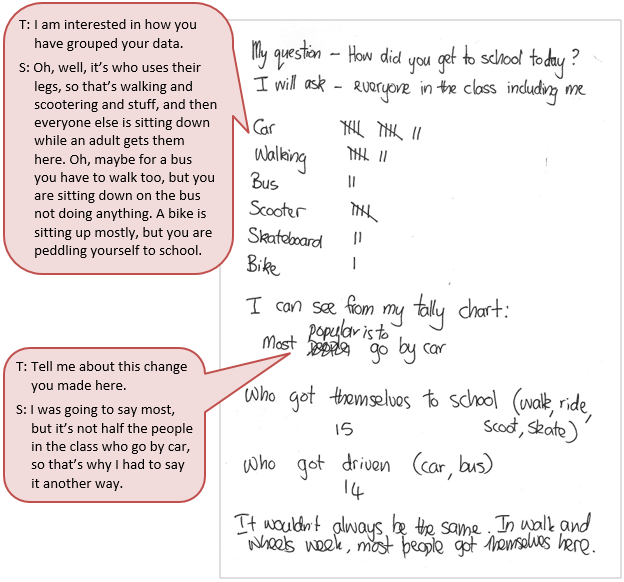
The student carries out a statistical investigation, following the PPDAC cycle. They gather appropriate data, sort the data into categories, analyse the data in a bar chart and write a clear summary of findings.
Click on the image to enlarge it. Click again to close. 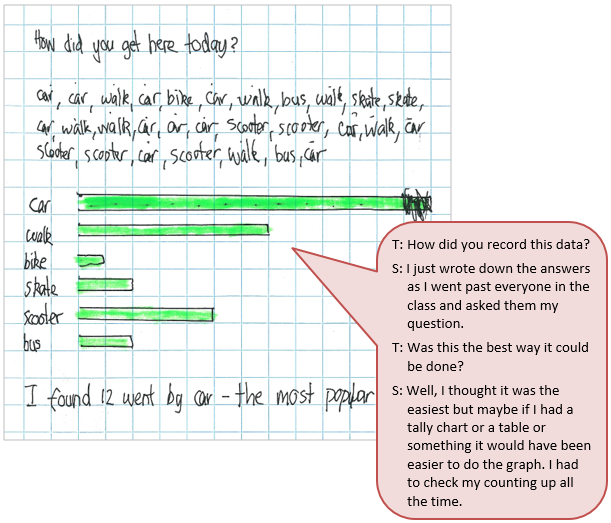
Work sample 2
The student carries out a statistical investigation, following the PPDAC cycle. They gather appropriate data, analyse, and report on the most popular method of getting to school. They acknowledge that results might vary from day to day.
Click on the image to enlarge it. Click again to close.