Big Feet
The purpose of this activity is to engage students in sorting data and identifying pattern and trends.
This activity assumes the students have experience in the following areas:
- Posing questions for statistical investigation.
- Displaying category and numeric data in different ways.
- Planning and carrying out an investigation.
- Identifying patterns and trends in data from graphs and tables.
The problem is sufficiently open ended to allow the students freedom of choice in their approach. It may be scaffolded with guidance that leads to a solution, and/or the students might be given the opportunity to solve the problem independently.
The example responses at the end of the resource give an indication of the kind of response to expect from students who approach the problem in particular ways.
 When a student suggested that boys have bigger feet than girls and another student said it was just a matter of how tall you are if your feet are bigger, the teacher decided to launch an investigation.
The class collected data from all their year group. They made response cards on coloured paper to allow them to sort and to make graphs of the results. Using these cards, can they say that boys feet are bigger than girls feet? Or, is foot size related to height?
Choose one of these questions to investigate. You may use the data provided, or survey/measure your own class.
Big Feet Data (.xls, 11KB)
Big Feet Response Cards (.xls, 12KB)
The following prompts illustrate how this activity can be structured around the phases of the Statistical Enquiry Cycle.
Problem
The problem section is about what data to collect and who to collect it from and why it’s important.
- What is my investigation question? Why do I wonder about that? (The questions are already defined but students might clarify aspects such as the age of the boys and girls and what unit of measure is to be used.)
- Is my question a summary, comparison, or relationship question? (Comparing the boys and girls footlengths is a comparison question. Looking for a relationshp between height and footlength is a relationship question.)
- Why is my question important?
- Are all the words (terms) in my question clear to someone else? If not, have I explained or defined those words? (The word “related” may be unfamiliar to students.)
- What will I need to know to answer the questions?
- How will I organise the data into information that answers my question.
Plan
The planning section is about how students will gather the data.
- How will I go about answering this question?
- What variables will be involved? (A variable is both a characteristic and a way to measure that characteristic.)
- How will I measure the attributes of footlength and height to minimise variation due to measurement?
- How will I find the data that I need? Is the data already available somewhere or will I need to collect it?
- Have I considered ethics so that people’s permission is given, their data is safeguarded, and my data gathering does no harm to them?
- What type of sample will I use? Can I justify why I chose that type of sample?
- How large will my sample be? Will my sample size be large enough, or do I need to increase or reduce it?
- Can I predict possible answers to my question, even before I look at data?
- What might my answer look like?
Data
The data section is concerned with how the data is managed and organised.
- What format will I use to organise my data as I gather it, or retrieve it?
- How much time will it take to gather or retrieve my data? Have I got time to do it? Have my subjects got time to give me their data?
- What digital or written tools will help my organise my data? (Consider measurement tools and how measuremnet will be standardised.)
- How will I protect the data I gather or retrieve so it is safe?
- Is some data ‘dirty’ (untrustworthy)? How will I clean my data?
Analysis
The analysis section is about exploring the data and reasoning with it.
- Have I reflected back on my question so I am clear what I am trying to find out?
- Do I get ideas about patterns, differences, relationships and trends from just ‘eyeballing’ the table of data?
- How can I display my data to look for patterns, differences, and relationships?
- What tools will help me to display the data in different ways? What ways are appropriate to my data and help answer my question?
- How might I describe the distribution/s for girls and boys footlengths? What language might I use to describe what I see? (Symmetric/Assymmetric (Skewed), spike, trough, etc.)
- Are there differences among distributions in terms of centre, shape and spread? Which measures of those features should I use?
- Can I make preliminary statements about my findings, starting with “I noticed that...”
- Am I developing ideas about what the answer to my question might be?
Conclusion
The conclusion section is about answering the question in the problem section and providing reasons based on their analysis.
- Have I answered my original question? If not, why not?
- How might I convince someone else I have answered the question?
- What displays best show what I have found out?
- Is my summary of findings clearly written so others can understand it?
- Have I used displays and measures to support my ideas?
- Do I go back to the context to suggest why the patterns, differences, relationships or trends occur?
- Do I say about the limitations of what I have found out? What can I say and what can’t I say?
- What other things have I learned and what further questions do I have?
Examples of work
Work sample 1
The student designs a statistical investigation and applies the enquiry cycle. They use data cards to create distributions for the footlengths of boys and girls, and compare the distributions using a concept of centre, or average.
Click on the image to enlarge it. Click again to close. 
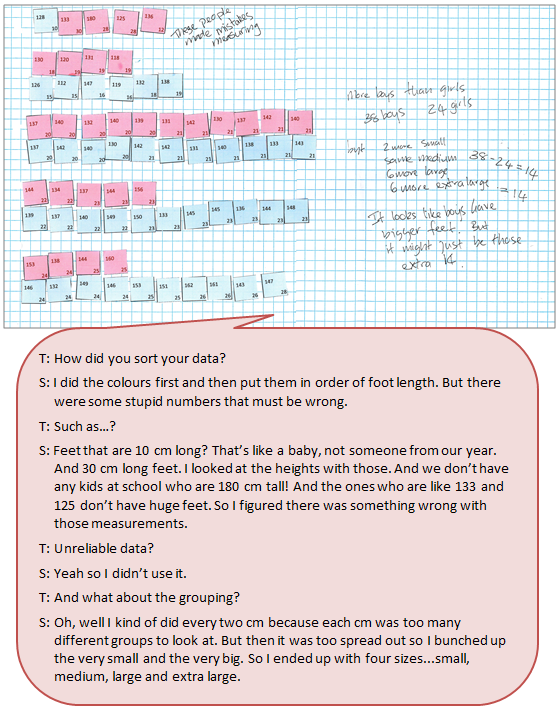
Work sample 2
The student designs a statistical investigation and applies the enquiry cycle. They use data cards to create size groupings for the footlengths of boys and girls, that includes a ‘dirty data’ category. They compare the number of boys and girls in each group acknowledging that group numbers are not equal.
Click on the image to enlarge it. Click again to close.