Books vs bean bags: Part 3
The purpose of this activity is for students to examine data displays, identifying and expressing features and/or trends in context.
This activity assumes the students have experience in the following areas:
- Posing questions for statistical investigation.
- Displaying category and numeric data in different ways.
- Planning and carrying out an investigation.
- Identifying patterns and trends in data from graphs and tables.
- Making recommendations or claims based on analysis of the data.
The problem is sufficiently open ended to allow the students freedom of choice in their approach. It may be scaffolded with guidance that leads to a solution, and/or the students might be given the opportunity to solve the problem independently.
The example responses at the end of the resource give an indication of the kind of response to expect from students who approach the problem in particular ways.
 A year 5 & 6 class has been told that the school is going to upgrade the school library. The class investigated the question ‘How do People Use the Library’, surveying students and teachers from their school.
One of the students in the class came up with this set of bar graphs showing the results of the survey.
Click on the image to enlarge it. Click again to close.
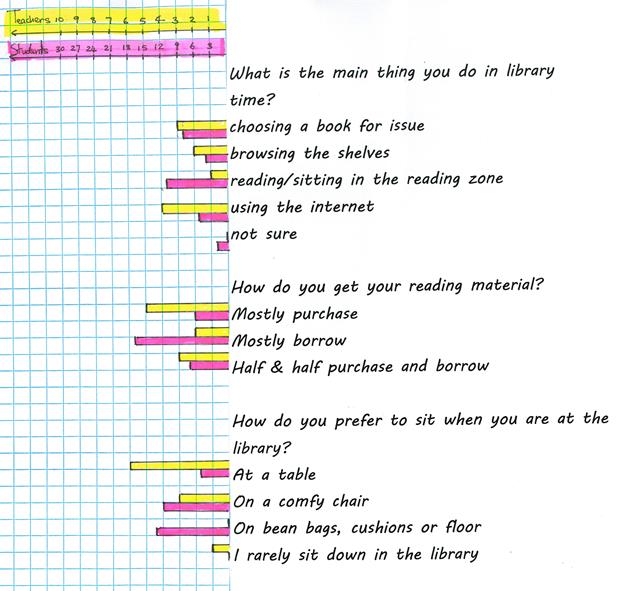
Use this display of data to highlight the key findings of the investigation, which will give recommendations for the school as to how they should spend their library upgrade budget.
The following prompts illustrate how this activity can be structured around the Analysis and Conclusion parts of the Statistical Enquiry Cycle.
Analysis
The analysis section is about exploring the data and reasoning with it.
- Have I reflected back on my question so I am clear what I am trying to find out?
- How can I display different sortings of my data to look for patterns, and differences, among the categories?
- What tools will help me to display the data in different ways? What ways are appropriate to my data and help answer my question?
- Is a bar graph the best way to display these data? Why? What are the strengths of a bar graph compared to other displays?
- What variation can I see in my data? What might be the causes of that variation?
- Are the views of teachers the same or different to the students?
- Can I make preliminary statements about my findings, starting with “I noticed that...”
- Am I developing ideas about what the answer to my question might be?
Conclusion
The conclusion section is about answering the question in the problem section and providing reasons based on their analysis.
- Have I answered my original question? If not, why not?
- How will I balance the different ideas of teachers and students?
- What recommendations have I got about what to purchase for the new library?
- How can I justify those recommendations using the data display?
- How might I convince someone else I my recommendations are supported by the data?
- From what I know, can I explain the patterns and difference in the data?
- Do I say about the limitations of what I have found out? What can I say and what can’t I say?
- What other things have I learned and what further questions do I have?
Examples of work
Work sample 1
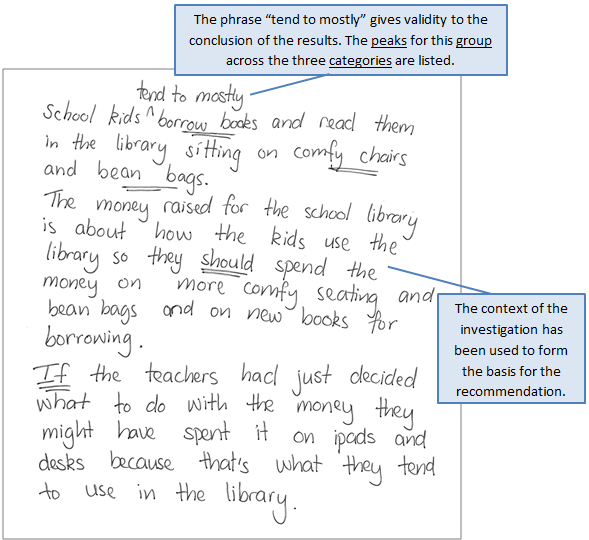
The student identifies patterns and trends shown in the data display and uses these patterns to make recommendations.
Click on the image to enlarge it. Click again to close. 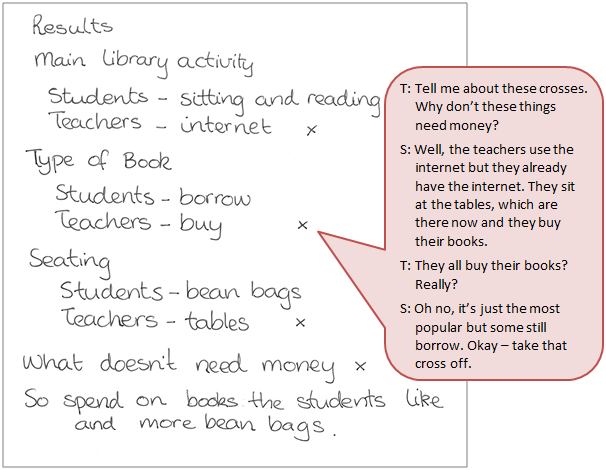
Work sample 2
The student identifies key features shown in the data display, expresses the findings from the displays, and uses these findings to make recommendations.
Click on the image to enlarge it. Click again to close.