Lucky Sausages
The purpose of this activity is for students to set up and run a simple probability simulation and to compare their experimental value of probability with the theoretical value.
This activity assumes the students have experience in the following areas:
- Expressing probabilities as fractions and percentages.
- Converting between fractions, decimals, and percentages.
- Estimating probabilities of simple events using simulations.
The problem is sufficiently open ended to allow the students freedom of choice in their approach. It may be scaffolded with guidance that leads to a solution, and/or the students might be given the opportunity to solve the problem independently.
The example responses at the end of the resource give an indication of the kind of response to expect from students who approach the problem in particular ways.
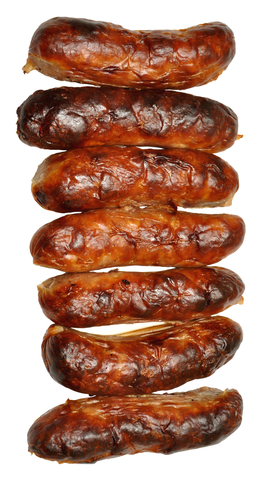
A group of parents running a fundraising sausage sizzle are struggling to keep up with demand, so have got the BBQ turned up to the hottest setting.
As a result, one third of the sausages are burnt, a quarter are sold before they are cooked properly, but the rest are fine.
Use coloured counters to model this situation, to find the percentage probability, that the next customer is lucky enough to get a properly cooked sausage.
Comment on the results of your experiment.
The following prompts illustrate how this activity can be structured around the phases of the Statistical Enquiry Cycle.
Problem
The problem section is about what data to collect and who to collect it from and why it’s important.
- What is my investigation question?
- What would an answer to my question be? (Students need to recognise that the answer is a probability estimate.)
- How would my answer be expressed? (Fractions, decimals and percentages are used to represent probabilities.)
- What evidence will be needed? (Probabilities can be found theoretically using models of all the possible outcomes, or experimentally by carrying out a simulation.)
Plan
The planning section is about how students will gather the data.
- How will I go about answering this question? (Simulation is required but theoretical models could also be used to confirm the estimate.)
- What will I need to know? (The fraction of all sausages that are correctly cooked.)
- How will I find the data that I need? Is the data already available somewhere or will I need to collect it?
- How many trials will I need to get a reliable estimate by simulation? (Students should know that small numbers of trials give unreliable results.)
- When I collect data, how will I measure the probability? How will I guard against bias?
- What tools might be useful? (Students might use manual methods, like counters, or use the Scrambler plugin on CODAP.)
Data
The data section is concerned with how the data is managed and organised.
- What format will I use to organise my data as I gather it, or retrieve it? (Some form of frquency table or tally chart is a useful format.)
- How will I know when my sample size is large enough? (The proportions (fractions) of properly and improperly cooked sausages will stabilise as sample size increases.)
- What digital or written tools will help my organise my data? (Digital platforms like CODAP and Excel can create displays as data is collected.)
- How could I calculate the theoretical probability? (Students are given fractions for the likelihoods of overcooked and undercooked sausages.)
Analysis
The analysis section is about exploring the data and reasoning with it.
- Have I reflected back on my question so I am clear what I am trying to find out?
- Have I carried out enough trials?
- What displays have been most useful? Why?
- Do my results give a reasonable estimation?
- What variation can I see in my data? What might be the causes of that variation?
- Can I make preliminary statements about my findings, starting with “I noticed that...”
- Am I developing ideas about what the answer to my question might be?
Conclusion
The conclusion section is about answering the question in the problem section and providing reasons based on their analysis.
- Have I answered my original question? If not, why not?
- How might I convince someone else I have answered the question?
- Do the experimental and theoretical results agree? Is that what I expected?
- Do I say about the limitations of what I have found out? What can I say and what can’t I say?
- What strategies and tools proved the most useful in my inquiry?
- What other things have I learned and what further questions do I have?
Examples of work
Work sample 1
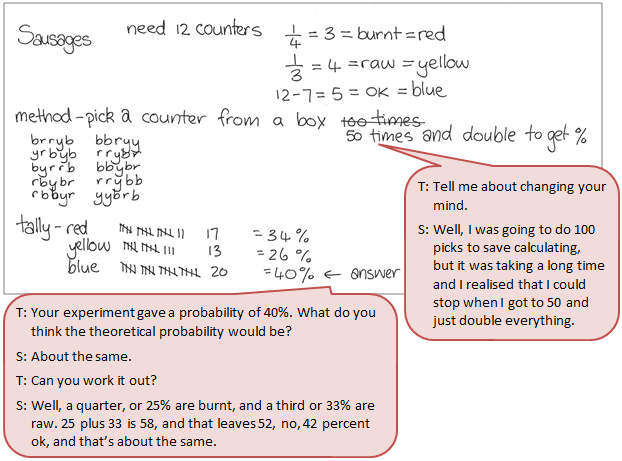
The student runs a probability simulation, and calculates a theoretical probability, to estimate and determine the value of the probability of getting a properly cooked sausage.
Click on the image to enlarge it. Click again to close. 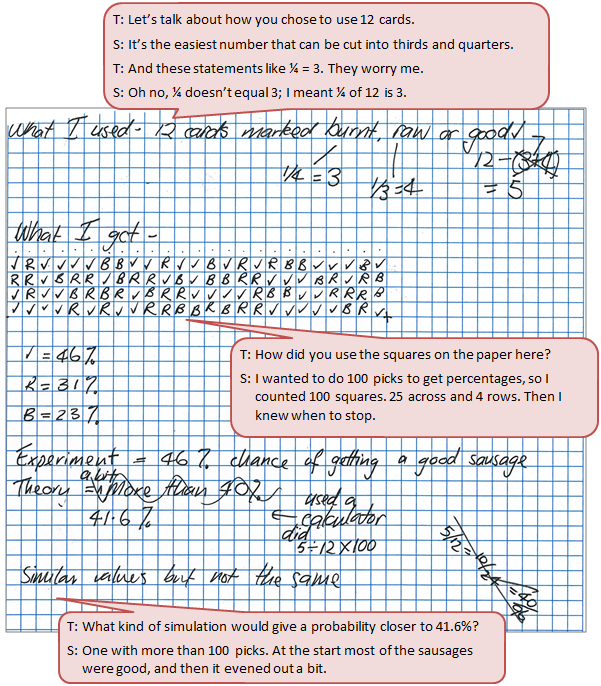
Work sample 1
The student uses the provided fraction information to set up and run a valid, simple probability simulation, independently. They compare the experimental estimate with the theoretical value of the probability using fractions and percentages.
Click on the image to enlarge it. Click again to close.