Changing Rooms
The purpose of this activity is to engage students in carrying out a statistical investigation, from posing a question through to carrying out a survey to using their findings to making a recommendation.
This activity assumes the students have experience in the following areas:
- Posing questions for data-based investigations.
- Developing and conducting surveys.
- Calculating sample statistics such as mean, median, and range.
- Recognising trends in time series data.
- Comparing distributions and patterns over time.
The problem is sufficiently open ended to allow the students freedom of choice in their approach. It may be scaffolded with guidance that leads to a solution, and/or the students might be given the opportunity to solve the problem independently.
The example responses at the end of the resource give an indication of the kind of response to expect from students who approach the problem in particular ways.
A Year 8 class is moving into the new prefab classroom.
The teacher has been allowed to furnish the room as she wants, so she decided to base her plan on feedback from the class on how students today tend to work best.
Using your own class as a representative sample, carry out a statistical investigation as to what sort of furniture and/or layout suits students best for learning.
The following prompts illustrate how this activity can be structured around the phases of the Statistical Enquiry Cycle.
Problem
The problem section is about what data to collect and who to collect it from and why it’s important.
- What is my survey question? Why do I wonder about that? (The questions should ‘get at’ how students prefer to do their work, and the space they prefer to do it in.)
- Is my question a summary question? (Students are finding out about a single characteristic of all the students in their class.)
- What variables will be involved? (A variable is both a characteristic and a way to measure that characteristic. In this case the variable is preferred work setting as measured by selection of pre-established categories.)
- Why is my question important? (There is a one-off opportunity to purchase furniture that matches the preferred working styles of students.)
- Who will find this information useful? Why will it be useful?
Plan
The planning section is about how students will gather the data.
- How will I go about answering this question?
- What will I need to know?
- Does this information answer my question?
- If I need to collect data, how will I measure the characteristic?
- How will I find the data that I need? Why will I use a survey?
- Have I considered other information about the effects on learning of different ways students choose to work?
- How will I make sure the measurement is as accurate as possible and ‘fairly’ measures the characteristic? (Ensuring the categories cover all the possible ways students like to work is important.)
- If I need to construct a survey, have I checked that my questions are clear and not leading (unbiassed)? Have I trialled my questions on a few people first?
- What type of sample will I use? Can I justify why I chose that type of sample?
- How large will my sample be? Will my sample size be large enough, or do I need to increase or reduce it? (In this case students will ask all students in their class so no sampling is needed. However, if the data were used to inform buying furniture for the whole school, then the class would constitute a sample.)
Data
The data section is concerned with how the data is managed and organised.
- What format will I use to organise my data as I gather it? (Student might use a pencil and paper format, such as a tally chart, or use an online platform such as Google Forms or Survey Monkey.)
- How much time will it take to gather my data? Have I got time to do it? Have my subjects got time to give me their data?
- What digital or written tools will help my organise my data? (Consider software and pencil and paper methods)
- How will I protect the data I gather or retrieve so it is safe?
- How will I protect the privacy of the subjects who are trusting me with their data?
Analysis
The analysis section is about exploring the data and reasoning with it.
- Have I reflected back on my question so I am clear what I am trying to find out?
- Do I get ideas about patterns and differences from just ‘eyeballing’ the table of data?
- Are my important variables categoric, discrete numeric, or continuous (measurements)? (Categoric in this case.)
- What tools will help me to display the data in different ways? What ways are appropriate to my data and help answer my question? (Bar graphs highlight differences while pie charts or strip graphs highlight proportions.)
- What variation can I see in my data? What might be the causes of that variation? (In this case the variation is among frequencies in the categories.)
- Can I make preliminary statements about my findings, starting with “I noticed that...”
- Am I developing ideas about what the answer to my question might be?
Conclusion
The conclusion section is about answering the question in the problem section and providing reasons based on their analysis.
- Have I answered my original question? If not, why not?
- Does my analysis of the data justify my recommendation about furniture?
- What displays best show what I have found out?
- Is my summary of findings clearly written so others can understand it?
- Do I go back to the context to suggest why the patterns and differences occur?
- Do I say about the limitations of what I have found out? What can I say and what can’t I say?
- What other things have I learned and what further questions do I have?
Examples of work
Work sample 1
The student creates a single survey question, surveys all students in their class, and analyses the category data to find the preferred way of working. They use the results to recommend appropriate furniture for the classroom.
Click on the image to enlarge it. Click again to close. 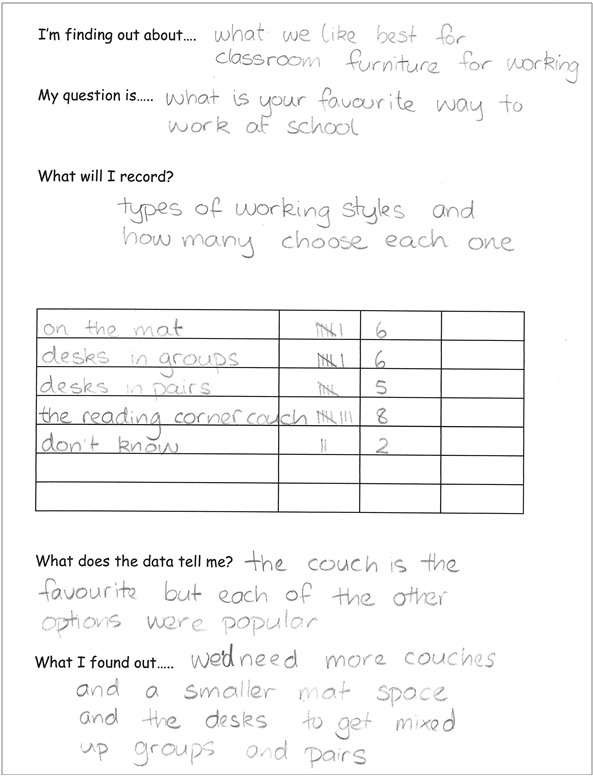
Work sample 1
The student creates a single survey question about how homework was done, surveys all students in their class, and analyses the category data to find the preferred setting for doing homework. They use the results to recommend appropriate furniture for the classroom.
Click on the image to enlarge it. Click again to close. 