The Big Splash
The purpose of this activity is to engage students in using the information provided on tables and charts to solve a problem.
This activity assumes the students have experience in the following areas:
- Interpreting timetables.
- Working with scales on graphs.
- Recognising and applying features of graphs, especially slope and intercepts.
The problem is sufficiently open ended to allow the students freedom of choice in their approach. It may be scaffolded with guidance that leads to a solution, and/or the students might be given the opportunity to solve the problem independently.
The example responses at the end of the resource give an indication of the kind of response to expect from students who approach the problem in particular ways.
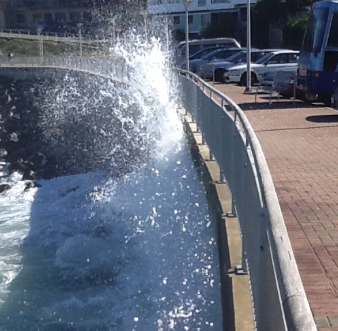
On a high tide at St Clair Beach, waves can splash up and drench the footpath. Use the tide table below to work out which would be the best time, during the day, to see this happen on the next Sunday.
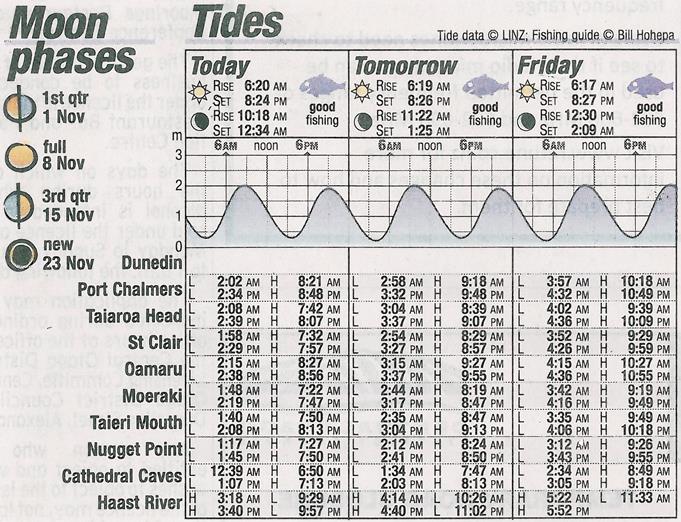
(Tide chart from Otago Daily Times, 29/10/2014)
The following prompts illustrate how this activity can be structured around the phases of the Mathematics Investigation Cycle.
Make sense
Introduce the problem. Allow students time to read it and discuss in pairs or small groups.
- What do the graph and table tell you about the cycle of tides? (The student needs to recognise that there is a predictable pattern for when high tides occur.)
- What day of the week is this tide chart? How do you know?
- What will and answer to this problem look like? (A time to visit St Clair will be given that matches high tide.)
- Which display the table or graph will be most useful? (The timetable is likely to give more precise times. However, the graph could include the precise time information.)
Plan approach
Discuss ideas about how to solve the problem. Emphasise that, in the planning phase, you want students to say how they would solve the problem, not to actually solve it.
- How will I organise the data from the table and graph to connect the information from both displays?
- What will I record my working?
- Do I expect there to be a pattern in high tide times? How do I know that?
- Can I make a prediction about the high tide times on Sunday? How?
- What tools (digital or physical) could help my investigation?
Take action
Allow students time to work through their strategy and find a solution to the problem.
- Have I shown my workings in a systematic way?
- Do I have a solution? Does the solution fit my predictions?
- Could I find the solution in other ways? Which way is best? Why?
- Is there another possible answer or way to solve the problem?
- How might I describe the pattern?
- Do my results match those of others? How might I evaluate their solution?
Convince yourself and others
Allow students time to check their answers and then either have them pair share with other groups or ask for volunteers to share their solution with the class.
- What is the solution?
- How would I convince someone else I am correct?
- Could I have solved the problem in a more efficient way?
- How do I know if I have worked this out correctly, especially the times?
- What connections can I see to other situations? What other things in real life cycle in time?
- Which representation (text, table, graph, numbers, diagram, equations) was the most useful?
- What mathematics did I learn or need to learn?
Examples of work
Work sample 1
The student uses the tide table for Friday to make predictions for high tide times on Sunday.
Click on the image to enlarge it. Click again to close. 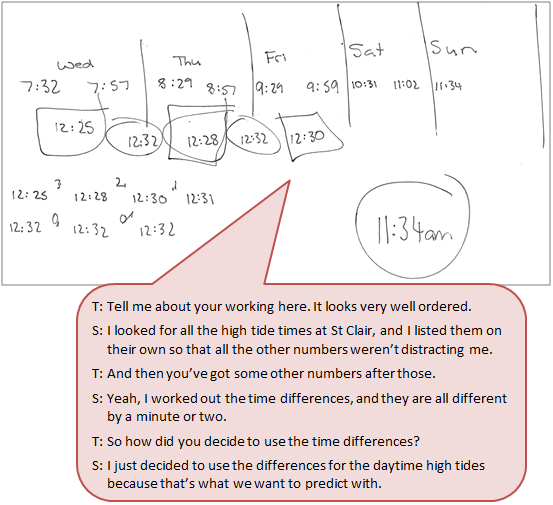
Work sample 2
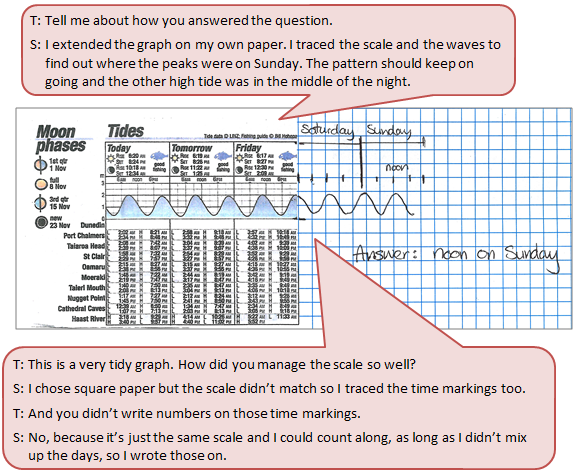
The student extends the graph of tides on Friday to include Saturday and Sunday and makes a prediction about the best time to visit St Clair walkway.
Click on the image to enlarge it. Click again to close.