That's the way the cookie crumbles
The purpose of this activity is to engage students in an investigation that leads to the comparison of experimental probability, with a theoretical probability.
This activity assumes the students have experience in the following areas:
- Recognising how larger samples in experiments more closely reflect the theoretical distribution than smaller samples (long-run frequency).
- Calculate theoretical sample spaces by finding all the possible outcomes.
- Conducting simulations to estimate probabilities experimentally.
- Using fractions, decimals, and percentages to express probabilities.
The problem is sufficiently open ended to allow the students freedom of choice in their approach. It may be scaffolded with guidance that leads to a solution, and/or the students might be given the opportunity to solve the problem independently.
The example responses at the end of the resource give an indication of the kind of response to expect from students who approach the problem in particular ways.
 Task: A bakery is producing cookies for a fundraising drive. The cookies come in packs of 5.
A fault in the design of the machinery means that one in every ten cookies crumbles when packed.
- Model this process to work out an experimental probability of getting exactly two crumbled cookies in a pack.
- Compare your experimental probability with the theoretical probability of getting two crumbled cookies in a pack.
The following prompts illustrate how this activity can be structured around the phases of the Statistical Enquiry Cycle.
Problem
The problem section is about what data to collect and who to collect it from and why it’s important.
- What is my investigation question? (Students need to be clear that the purpose of the investigation is to estimate or calculate the probability of getting exactly two crumbled cookies in a pack.)
- Have I investigated a similar problem? What strategies did I use then?
Plan
The planning section is about how students will gather the data.
- How will I go about answering this question?
- What will I need to know?
- How will I organise an experiment to estimate the probability of two crumbled cookies?
- What tools will I need to ensure my experiment is random and not biased?
- Is there a way to calculate the probability? What models will be useful to do that? (Note that the binomial distribution is not expected at Level 5 but students can draw tree diagrams and calculate the probability of each outcome and sum those that represent two crumbled cookies.)
- Can I predict possible answers to my question, even before I look at experimental data?
- What do I expect to happen?
Data
The data section is concerned with how the data is managed and organised.
- What tools will I use to generate random outcomes that match the probability of 1 in 10? (Random number generators or the Sampler plugin from CODAP might be used.)
- How many trials should I do? Why should I do that many? (Look for recognition of the greater reliability of experimental results involving larger samples.)
- How will I record the data I get so I can interpret it? (Trials of 5 ‘cookies’ collated in a table or spreadsheet with 5 columns will make analysis easier.)
- What digital or written tools will help my organise my data? (Consider software including spreadsheets.)
Analysis
The analysis section is about exploring the data and reasoning with it.
- Have I reflected back on my question so I am clear what I am trying to find out?
- What tools display the data in an efficient way? What do the results show?
- How can I express my results as an estimate of the probability of two crumbled cookies?
- Can I make preliminary statements about my findings, starting with “I noticed that...”
- How can I calculate the theoretical probability theoretically? How do I express that theoretical probability numerically?
Conclusion
The conclusion section is about answering the question in the problem section and providing reasons based on their analysis.
- Have I answered my original question? If not, why not?
- How might I convince someone else I have answered the question?
- Do my experimental results align with my theoretical model? If not, why not?
- Is my summary of findings clearly written so others can understand it?
- What strategies and tools proved the most useful in my inquiry?
- What other things have I learned and what further questions do I have?
Examples of work
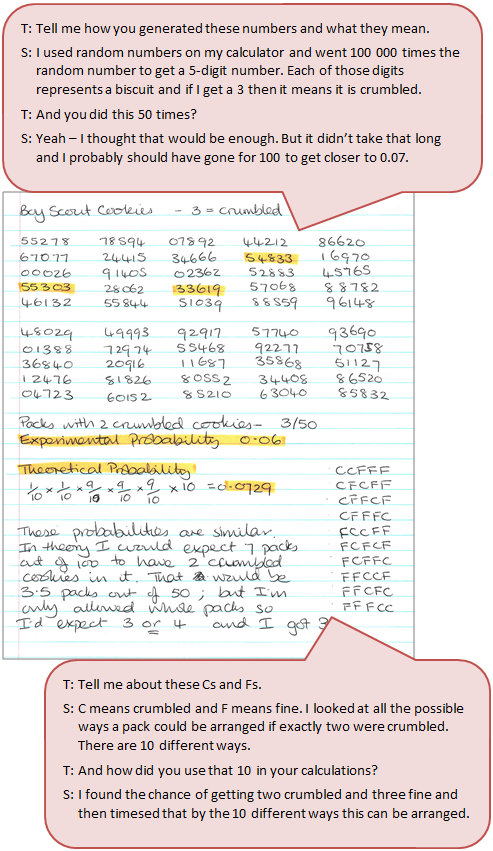
Work sample 1
The student carries out a simulation to generate a probability and to compare this value with the calculated theoretical probability.
Click on the image to enlarge it. Click again to close. 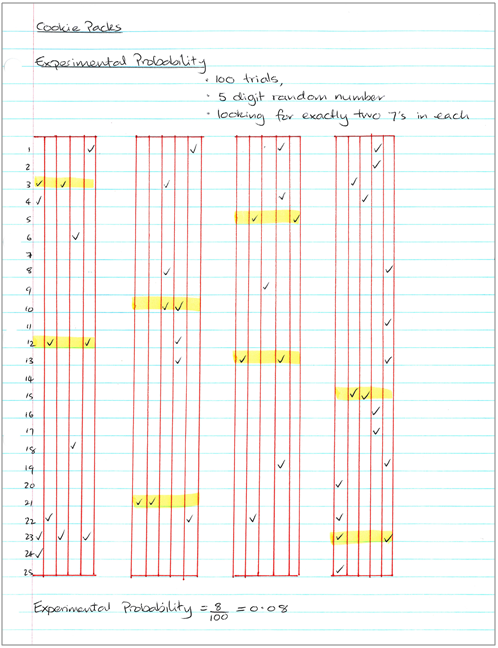
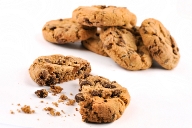
Work sample 2
The student designs and carries out a simulation to generate a probability and to compare this value with their calculated theoretical probability.
Click on the image to enlarge it. Click again to close.