Sports figures
In this unit students investigate the sport and recreation dispositions and habits of the students in their school, and present data using a display they have evaluated and identified as effective.
- Understand and calculate percentages.
- Write summary statements from data presented in tables and graphs.
- Present data in strip graphs and pie graphs.
- Compare the effectiveness of data displays.
- Pose an investigative question, plan and carry a statistical enquiry.
- Present findings, making sensible statements about the information, with supporting evidence.
- Collate school-wide category data.
- Critique the investigation process.
- Pose further investigative questions for statistical enquiry.
Students are regularly exposed to statistical information in their daily lives. It is important that they develop statistical skills that involve interpreting and critiquing data and evaluating the ways in which data is presented. This data-literacy is key to operating successfully in our data-rich world.
At Level 3 students refine their ability to pose investigative questions that can be explored using the PPDAC cycle. They learn to plan how they will gather the appropriate data and how to sort the data to be able to answer their investigative questions. Students become more familiar with a range of data displays, as they use tally charts, tables and bar graphs (familiar from level 2). They learn to understand and work with strip graphs and pie graphs that show proportions or percentages. The templates used work with partitions of 100.
As students work with data they need to understand the relationship between fractions, decimals and percentages and apply proportional reasoning skills. They learn that decimals and percentages are special cases of equivalent fractions in which the denominators are powers of ten. By explaining the percentage notation to students, they come to understand that a percentage expresses a fraction of 100 and that the symbol % is made up of the ‘out of’ or ‘per’ symbol (/) and two zeros from 100. Students should learn to show percentages with equipment. Over time students develop an understanding of the role of percentages in making the comparison of data ‘easier.’
At this level the data should be multivariate. This gives the students the opportunity to identify patterns in data, and to explore the relationships between several variables. As they work with the multivariate data they have collected, they identify features of a single variable and are naturally prompted to ask summary questions of that variable. As the students then work between variables, comparison and relationship investigative questions begin to arise as the connections between the data sets become apparent. Note: comparison and relationship situations are at level 4. However, it is not unreasonable to start to explore them within this context if your students are capable.
The nature of questions in the investigation cycle, need to be well understood. Summary questions are usually answered by a single data set, while comparison questions compare two or more data sets. As students develop a wider awareness of the group, they develop the important understanding that data vary. Recognition of group dynamics and the relationships between data, are fundamental to developing an understanding of variation.
As students are developing questions within the investigation cycle, they must be supported to clearly see and understand the difference between investigative questions (questions we ask of the data) and the survey questions (questions we ask to get the data) that will generate the data to answer the investigation question(s). The purpose of each question type should be made explicit within the context of their investigation.
As students manipulate data, they should be able to use computer technology to create displays to find patterns in data, including trends over time, as well as to communicate their findings to others. CODAP and Excel allow students to define variables and to sort efficiently. Students should be required to justify their choice of display/s with reference to the information or patterns they wish to highlight.
Investigative questions
At Level 3, students should be generating broad ideas to investigate and then refining their ideas into an investigative question that can be answered with data. Investigative summary, simple comparison and time series questions are posed, where the entire data set can be collected or provided. The variables are categorical or whole numbers. Investigative questions are the questions we ask of the data.
Students are starting to pose their own investigative questions. The teacher is supporting this through questioning and modelling, working with the students to improve their investigative questions. Checking the variable of interest and the group of interest is key. Students are learning that the investigative question is the question we ask of the data. Data collection or survey questions are questions we ask to get the data.
Data collection or survey questions
Data collection or survey questions are the questions we ask to collect the data to answer the investigative question. For example, if our investigative question was “What ice cream flavours do the students in our class like?” a corresponding survey question might be “What is your favourite ice cream flavour?” As with the investigative question, survey question development is done by the students with teacher support to improve them so that suitable survey questions are developed.
Analysis questions
Analysis questions are questions we ask of displays of data as we start to describe it. The teacher can model this through asking students about what they see in their displays. A series of analysis questions can be developed in conjunction with the students. Analysis questions include questions about the features of the display. Questions such as: what is the most common? the least common? how many of a certain category? what is the highest value (for numerical data)? lowest value (for numerical data)? are analysis questions.
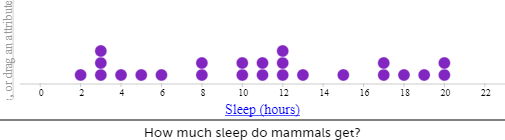
Dot plots
Dot plots are used to display the distribution of a numerical variable in which each dot represents a value of the variable. If a value occurs more than once, the dots are placed one above the other so that the height of the column of dots represents the frequency for that value. Sometimes the dot plot is drawn using crosses instead of dots. Dot plots can be used for categorical data as well.
Bar graphs
In a bar graph equal-width rectangles (bars) represent each category or value for the variable. The height of these bars tells how many of that object there are. The bars can be vertical, as shown in the example, or horizontal.
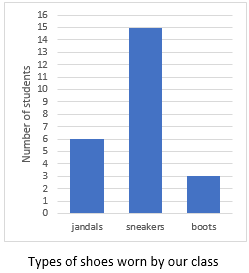
The example above shows the types of shoes worn in the class on a particular day. There are three types of shoes: jandals, sneakers, and boots. The height of the corresponding bars shows that there are six lots of jandals, 15 lots of sneakers and three lots of boots. It should be noted that the numbers label the points on the vertical axis, not the spaces between them. Notice too, in a convention used for discrete data (category and whole number data), there are gaps between the bars.
Strip graphs
A strip graph represents frequencies as a proportion of a rectangular strip. For example, the strip graph below shows that the students saw five light blue cars, seven yellow cars, 11 maroon cars and two grey ones. The strip graph can be readily developed from a bar graph. Instead of arranging the bars beside one another join them end to end. (Alternatively, you can easily get a bar graph from a strip graph by reversing the process.)

Tally charts
A tally chart provides a quick method of recording data as events happen. If the students are counting different coloured cars as they pass the school, a tally chart would be an appropriate means of recording the data. Note that it is usual to put down vertical strokes until there are four. Then the fifth stroke is drawn across the previous four. This process is continued until all the required data has been collected. The advantage of this method of tallying is that it enables the number of objects to be counted quickly and easily at the end.

In the example above, in the time that we were recording cars, there were 11 red cars, four yellow cars, 18 white cars and five black ones and 22 cars of other colours.
Using software for statistical displays
Microsoft Excel or Google Sheets can be used to summarise and graph data.
Other online statistical tools that are good for graphing data, for example CODAP – Common Online Data Analysis Platform, work with raw data and allow a more flexible approach to data analysis. Support videos for students and teachers in New Zealand on using CODAP can be found here.
Associated Achievement Objectives
Health and Physical Education Personal
Health and Physical Development
- Identify factors that effect personal, physical, social and emotional growth and develop skills to manage changes.
- Maintain regular participation in enjoyable physical activities in a range of environments and describe how these assist in the promotion of wellbeing.
Healthy Communities and Environments
- Research and describe current health (and safety guidelines and) practices in their school and take action to enhance their effectiveness.
The learning opportunities in this unit can be differentiated by providing or removing support to students and by varying the task requirements. Ways to support students include:
- varying the type of data collected; categorical data can be easier to manage than numerical data
- varying the type of analysis – and the support given to do the analysis
- providing pre-prepared graph templates to support developing scales for axes
- providing equipment to manipulate: hundreds boards and counters, Slavonic abacus, pegboards and pegs and, a number line to 100.
- providing prompts for writing descriptive statements
- providing teacher support, opportunities for small-group teaching, and opportunities for tuakana-teina (peer support) at all stages of the investigation
- extending into comparison and relationship investigative questions
- grouping students to support each other or extend each other, explaining their thinking and justifying their analysis.
The context for this unit can be adapted to suit the interests and experiences of your students.
- the statistical enquiry process can be applied to many topics and selecting ones that are of interest to your students should always be a priority
- this unit focuses on a health and physical education interest around sport and physical activity, this could be changed to another context related to another subject area or another context for health and physical education. For example, recording how many kiwi are located in different areas of the country, whānau members’ interests, how many native trees in a local environment.
Te reo Māori vocabulary terms such as kauwhata ira (dot plot graph), kauwhata pou (bar graph), kauwhata (strip graph), tauanga (statistics), and raraunga (data) could be introduced in this unit and used throughout other mathematical learning. Numbers in te reo Māori can be used alongside numbers in English.
- Sport and recreation in the lives of young New Zealanders (2011) (extra copies of pages 18, 19, 22, 23, 61 will be useful)
- Hundreds boards and counters
- Slavonic abacus
- Pegboards and pegs
- Number line to 100 and clothes pegs
- Data cards (Copymaster 1)
- Strip graph template (Copymaster 2)
- Pie graph template (Copymaster 3)
- Paper
- Pencils and erasers
Learning activities
Whilst this unit is presented as a sequence of five sessions, more sessions than this may be required. It is also expected that any session may extend beyond one teaching period.
Session 1
This session is about students understanding and using simple percentages and displaying information on a strip graph.
SLOs:
- Understand and calculate percentages.
- Write summary statements from data presented in tables and graphs.
- Present data on a strip graph.
Activity 1
Begin the session by discussing a recent sporting event.
Have students say their one favourite sportsman or sportswoman (‘sports figure’).
List the names of five of those mentioned in discussion. Explain that each student will choose which of the five they like best.
Read the names one at a time. Beside each name record tally marks to indicate the number of people who voted for this person.
Have the students total the tally marks to ensure that no one voted twice.
Write beside each sports figure, the fraction of the class that likes this person best.
For example in a class of 27 students:Sports figure A |||| 4/27 Sports figure B |||||||||11/27 Sports figure C ||| 3/27 Sports figure D ||||||7/27 Sports figure E || 2/27 Total 27/27 - Ask students to suggest how these data could be displayed. For example: bar graph or strip graph. By estimating the size of the fraction, roughly draw each one of these displays on the class chart, with input from the students, reviewing the features of both graph types.
- Suggest that successful sports figures are likely to have begun their sporting career at an early age.
Explain that the focus of the next few sessions is on finding out more about the way in which young people of their age engage in sport.
Activity 2
Have students work in pairs. Make available copies of the data cards (Copymaster 1), pencils and paper.
- Introduce Sport and recreation in the lives of young New Zealanders, and point out that New Zealanders aged 5 to 18 years old took part in the survey.
- Have student pairs read pages 18 and 19 of Sport and recreation in the lives of young New Zealanders, Views about playing sport, discuss the figures (page 18) for girls and boys in their age group, and write down three statements beginning “We notice that:…” Model this on the board, and support pairs of students as necessary. They can also explore the figures (page 19) for different ethnicities.
Activity 3
Make hundreds boards and counters, Slavonic abacus, pegboards and pegs, and a number line to 100 available to students. Ensure that each student pair has at least one of these pieces of equipment.
- Write the symbol % on the class chart and have student pairs discuss its meaning.
Explain that this symbol means ‘out of 100’. It comes from the ‘out of’ or ‘per’ symbol (/) and the two zeros from 100.
- Have students take turns to model the sets of figures given for their age group (for example 5-10 years) on their equipment. This will require students to round the percentages to the nearest whole number. For example: 77% (77.4%), 20% (19.8%) and 3% (2.8%). Review the ‘rounding’ process for students if needed.
- Have student pairs total the sets of percentages in each of the six columns on page 18, adding each set of three decimal figures to equal 100%.
Discus the fact that in each case the total is 100%. Emphasise that this is the same as all of the students in this sample.
Activity 4
- Discuss: “When and why do we use percentages?”
Record the students' ideas on the class chart.
Highlight these points:- Percentages are an important part of our everyday lives.
- Percentage is a useful way of writing a fraction.
- Percentages can be compared more easily than some fractions.
- Decimals and fractions are special kinds of equivalent fractions in which the denominators are powers of 10.
- Percentages are used to express how large or small one quantity is relative to another quantity.
- Percentage difference is used when both values refer to the same kinds of things. (for example: How many boys, compared with girls, like playing sport).
- Ask, “Does this mean that there always has to be 100 people in a sample?” (No. Point out that the number in the class is not 100)
Have students suggest why the percentage figures given are in decimal amounts. (Some may suggest that you can’t have parts of people.)
- Make calculators available and explain that the class will calculate percentages for their class.
Refer to class data gathered in Activity 1, Step 1 above (favourite sports figures). Write the following fractions on the board:
Sports figure A 4/27 (4 of the 27 people in the class like figure A best.)
Sports figure B 11/27
Sports figure C 3/27
Sports figure D 7/27
Sports figure E 2/27
Look at each fraction. Highlight that a fraction is also a division statement.
Model and ask students to explain why this is so.
For example 1/2 is one thing divided by 2, 1/4 is one (thing) divided by 4, 3/4 is 3 divided by 4, 4/27 is 4 divided by 27.
Have students enter the smaller number into the calculator and divide this by the larger number. For example 4 ÷ 27 = 0.1481.
Have students read the decimal number.
Explain that to calculate the percentage, this figure is multiplied by one hundred. Modelthis and show the answer: 14.81%
Write beside each of the sports figures:
Sports figure A is liked best by 4/27 or 0.1481 or 14.81% (rounded to 15%) of the class.
- Have student pairs calculate percentages for each of the sports figure fractions. Have them check that these total 100% (or all of the class).
- Have students round the percentage to a whole number and use a different piece of equipment to model each of the class percentage figures for the favourite sports figures.
Activity 5
Make available to each student a copy of Copymaster 2.
- Have students write a reflection what they have each learned about percentages.
- Have students use their percentage figures from Activity 4, Step 5 (round the percentage to a whole number and use equipment to model a percentage figures) and accurately create a strip graph showing the relative popularity of the five identified sports figures. Highlight the fact that the whole length of the strip is 100%, or the whole class.
Ask students to discuss and record at least three summary statements about these data.
Activity 6
Ask student pairs to refer to page 18 of Sport and recreation in the lives of young New Zealanders and create one strip graph for boys and one for girls in their age group. Support small groups of students as necessary.
Ask them to write at least three summary statements about one data set or comparison statements about girls and boys.
Activity 7
Conclude the session by having students consider how they would answer the survey questions:
How much do you like playing sports?
- A lot
- A little
- Not at all
Session 2
This session is about comparing tables of information, strip graphs and pie graphs.
SLOs:
- Write comparison and summary statements from data presented in tables and graphs.
- Interpret data presented in a pie graph.
- Present data in a pie graph.
- Compare the effectiveness of data displays.
Activity 1
- Begin by listing sports and recreational activities that students in the class engage in, ensuring you include a range of activities including cultural ones.
Write the numbers 1, 2, 3, 4, 5, >5 on the chart. Ask students to indicate which number represents the number of sports or recreational activities they are involved in.
For example: a student may attend swimming and dance classes and do athletics (three sports/activities).
Record in tally marks beside each number, the number of students for whom this applies. For example:1 ||||||(Seven students participate in one sport only) 2 ||||||||(10 students participate in two sports or activities) - Ask students to estimate the amount of time per week that they spend on sporting activities.
List some of these times.
Activity 2
Make available to student pairs copies of page 61 of Sport and recreation in the lives of young New Zealanders:. Connect this to the discussion in Activity 1, Step 3 above (estimate the amount of time per week that they spend on sporting activities).
- Allow time for students to interpret the displays.
Discuss and list features of the pie graphs on page 61 of Sport and recreation in the lives of young New Zealanders: Time Spent Participating in Sport and Recreation – Combined Time.
Note:- The time categories (≥3 hours, < 3 hours, No time) and relate these to the students’ own time indicated in Activity 1, Step 3.
- A pie graph is circular and each sector shows the relative size of each value.
- The sectors represent a percentage.
- The full circle of the graph represents 100% (or all of the students surveyed in a particular category. For example: Boys 5 – 10 years.)
- 7% is 7/100 of the pie.
- 0.2 is 1/5 of 1% (1/100) of the pie, 0.1 is 1/10 of 1% (1/100) of the pie and these are very tiny sectors of the pie. In rounding percentages to whole numbers, these portions would not be shown.
- Have student pairs become familiar with the information presented and make at least three comparison statements as they look at the 6 pie graphs. Ask them to pair share their statements.
Activity 3
- Choose from pages 22 or 23 of Sport and recreation in the lives of young New Zealanders the chart in which most students in the class are represented: For example:
If most of the students in the class are 10 years old, choose: page 22, Top 20 sport or recreation activities participated in ‘this year’ by 5 to 10-year olds.
Discuss that many participants in the survey are involved in more than one sport or activity so many of the students will be represented in the figures for several of the sports. (Refer to Activity 1, Step 2 above when the students listed their participation in multiple sports).
Discuss that the percentages given for each sport (and numbers participating) are a fraction of the total number of participants.
Carefully examine the information together, having students together share ‘what they notice’.
- Make available to each student Copymaster 3.
Ask students to choose five sports/recreation activities. Have them round each % figure to a whole number and create a pie graph for boys’ participation and one for girls’ participation in each of the five sports, to show how they compare. Note that the pie graphs are partitioned into 100 parts. Students could create their pie graph using a digital tool, on paper, or even outside with chalk.
Have students write a title for each simple pie graph, and write the participation percentage and the non-participation percentage on the appropriate of the two sectors of each graph.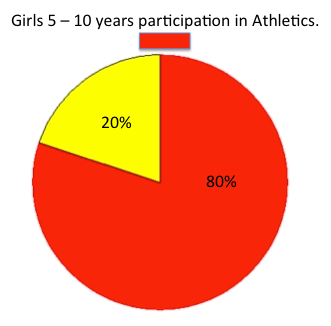
Activity 4
Have students evaluate displays by first considering the displays they have worked with so far:
a) A table with graphics (Views about playing sport, page 18 of Sport and recreation in the lives of young New Zealanders)
b) The strip graphs they have made to represent these data.
c) Pie graphs (page 61) and their own (Copymaster 3)
d) Data Tables (pages 22 and 23).
Have student pairs decide which “display” is the most ‘effective’ and justify their decision.
Emphasise that strip graphs can be more easily ‘lined up’ and compared than pie graphs, and that numerical data tables are necessary but they do not have the visual impact that a graph has.
Session 3
This session is about posing investigative questions and planning a survey that will gather data to answer the investigation question(s).
SLOs:
- Pose an investigative question.
- Plan an investigation.
- Design effective survey questions.
- Prepare to explain the data collection process to the sample.
Activity 1
- Review content and learning from Sessions 1 and 2.
Suggest that it’s time and it would be fun to investigate the sport and recreation data of students within the school.
Give student pairs a short time to write an investigative question that they would like to explore using the PPDAC cycle.
(This may be initially worded as an ‘I wonder’ statement). Have students think about the information that they would need to gather from each student (in the school) to answer their investigative question. - As a class, list some of the ideas for investigation and together phrase these as investigative questions.
Focus on summary (S) investigative questions that are answered by a single data set and comparison (C) investigative questions that compare two or more data sets. For example:
What sports or recreational activities do students in our school like? (S)
How much time do students in our school spend on sporting or recreational activities? (S)
Do older boys in our school tend to spend more time on sporting and recreational activities than younger boys? (C)
Do ten year-old girls in our school tend to spend more time on sporting and recreational activities than ten year-old boys? (C) - Have students predict the answer(s) to the investigative question(s) and record these.
Activity 2
Introduce the students to data cards (Copymaster 1). Point out that about four variables can be collected and easily sorted using this tool (data squares) that is used to collect data to answer their investigative question.
NB: Highlight the difference between the investigative questions (above), and the survey questions that will generate the data to answer the investigative questions(s).
Establish that two of the four survey questions will be:
Are you a boy or a girl? (include non-binary option if appropriate)
How old are you?
Recognise that in gathering consistent school-wide data, for practical reasons, the other two survey questions will be agreed upon as a class. (Pairs of students can then go to different classes, explain the survey task and format, and quickly gather the data).
Agree on two other survey questions that will generate the data necessary to answer the favoured investigative question(s).
For example:
What is the sport or recreational activity that you do most?
How many hours altogether do you spend per week, participating in sport or recreational activities? (≥3, < 3, None)
(Investigative questions generated in Activity 1, Step 2 may require refinement or reworking).
Explain that each student in the school will answer each of these survey questions on their own data cards.
Model and discuss an example of a participant response and together interpret the data. For example:
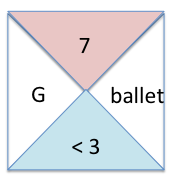
Ballet is the activity that this seven year-old girl does most and she spends less than three hours per on sporting/recreational activities.
Explore several other examples, keeping student interests and cultural perspectives in mind. Explain that each person in the class will soon complete their own data cards.
Activity 3
- Together decide which class in the school (or cohort of students) each student pair will survey.
Make a data sheet, a small plastic bag and scissors available to each pair of students. Have them work in pairs to cut their data cards and prepare their explanation for the participant class. (Why they are carrying out the survey, what survey questions they want the participants to answer and how to complete a data card).
Recognising that 5 year-old students will require great support in completing the cards than older students.
While Activity 3, Step 1 is being completed:
- Circulate a sheet of data cards (keep them all on one sheet for quick photocopying). Each student in the class should complete their own data card on a class sheet. When this is done, make enough photocopies of the completed class sheet for each pair of students to have one copy of the class set of data. (Keep the original sheet.)
Activity 4
- Distribute to student pairs copies of the class data.
Have them cut out the data cards, rearrange them, begin to look for patterns in the data, and answers to the investigative question(s) as they apply to their own class. - Conclude by sharing some of the findings (summary and comparison) the students have made. Students will need to justify their reasoning. This can be carried out in small groups or as a whole class.
Session 4
This session is about sorting data into categories, presenting information using a bar graph, and calculating percentages and presenting data using a strip graph or a pie graph.
SLOs:
- Answer summary investigative questions by sorting, organising and arranging information.
- Make statistical displays of the collated data.
- Make sensible statements about the information, with supporting evidence.
Activity 1
Have students practice the presentation they planned in Session 3, Activity 3, Step 1.
Have students go to other classes (or student groups) in the school and collect data.
Activity 2
Make available graph paper and Copymaster 2 and Copymaster 3.
Have students lay out the data cards, rearrange them looking for patterns in the data, and answers to the investigative question(s).
Activity 3
Direct students to sort their data by examining one variable (univariate) at a time, recording the results (using tally marks as appropriate), calculating percentages and presenting summary data in a display.
For example:
Gender:Boys Girls Class total 8 16 = 24 33% (33.3%) 67% (66.7%) 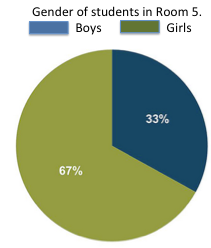
For example: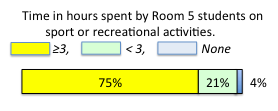
- Students can make summary statements about each data set and answer summary investigative questions at a class level. (These can later be aggregated to answer the school summary questions.)
Activity 4
Have students rearrange data cards to seek answers to comparison investigative questions. Have them create strip graphs (which are more easily directly compared) to present data and answer comparison investigative questions, with evidence.
Have students write class level answers to comparison investigative questions as appropriate.
NB. Some of the comparison investigative questions are likely to require the aggregation of school-wide data.
Activity 5
Create a spreadsheet to collect school-wide data, and as they are ready, have student pairs enter summary data for each data set from their class investigations.
Session 5
This session is about answering comparison investigative questions and suggesting strategies for engaging all students in the school in regular sporting/recreational activities.
SLOs:
- Collate school-wide category data.
- Critique the investigation process.
- Pose further investigative questions.
- Present findings, making sensible statements, with supporting evidence.
Activity 1
Begin this session by asking students to pair-share their data displays and findings for the class/sample group they have worked with.
Have them give feedback to each other, discuss the investigation process that they have engaged in so far, discuss interesting points about the use of the data cards and identify any challenges in ‘arranging’ them to find patterns and relationships.
Activity 2
- Make available to all student pairs the school-wide data spreadsheet.
Allow time for students to become familiar with the data table.
- Display the investigative questions.
Allow time for students to seek (and find) answers within the data, and for each student to write answers to the investigative questions.
Make students aware that they may have to refer to the data sets from particular classrooms to answer some investigative questions.
- Students should refer to their predictions and compare these with their findings.
Activity 3
- As a class, brainstorm reflections on the investigation process.
Critique together the investigative question(s), survey questions, use of the data card tool, the types of data displays and the findings.
- Allow a short time for student pairs to list further questions that the investigation has generated, or different survey questions that they think they should have asked or would like to ask.
Activity 4
If results show a cohort of students who are disengaged from any sport or recreational activities, have students suggest initiatives that could help to change this behaviour. This could form the basis for units focused on health and physical education and/or persuasive and explanation writing.
Activity 5
If appropriate, make comparisons with the findings of the Sport and recreation in the lives of young New Zealanders.
Activity 6
Conclude the session by allowing time for each student to record a personal reflection about their experience of gathering and working with multivariate data, using strip and pie graphs, and what they have learned from these sessions.
Dear parents and whānau,
We have been carrying out a statistical investigation into the sporting and recreation habits of the students in our school.
We have found: Include statement of findings
You are invited on __________________________to come and learn about how we used data cards to collect our survey information, and to see our statistical displays. We look forward to seeing you and to telling you about what we have learned.
Thank you for the support and encouragement that you give us with our sporting activities.