Healthy Hands
The purpose of this unit is conduct a statistical investigation to answer a health question such as, "does washing my hands keep me from getting sick?"
- Identify a health issue for investigation.
- Pose an investigation question with support from the teacher.
- Participate in developing a plan to collect data.
- Gather, sort, count and display category data.
- Make a pictograph and identify its key features.
- Discuss results of an investigation.
- Make ‘I wonder’ statements and pose new investigative questions.
- Draw a picture/diagram to show the investigation process.
At level one, students learn to collect, sort and count data, thus applying their number knowledge and strategies, and begin to use pictographs to display category data. As students create and interpret pictograph data, and become familiar with the features of this data display, they build understanding of how bar graphs can be used to represent the information that they have collected. Students should have the opportunity to clearly identify and discuss the similarities and differences between bar graphs and pictographs as they make this transition towards using bar graphs and more abstract representations of data.
There are conventions used in creating data displays, including the labelling of axes, writing an appropriate title, and using uniform units of scale, that should be modelled for students and emphasised. Providing opportunities for students to talk about their own data displays, and interpret those created by their peers, helps students to recognise these conventions and appreciate their importance as a tool to enhance the clarity of the information presented.
Using the statistical language of comparison is also important in its ability to highlight the relationships that exist within and between the data. Phrases such as "more than, greater than, less than, fewer than," and "the same as" (indicating equality) should be emphasised, alongside the use of appropriate symbols (e.g. <, >, =) in the communication of the data analysis. It is important for students to develop fluency in using this language and these symbols, and for them to recognise the communication of like ideas.
Participation in the PPDAC statistical investigation cycle reinforces the understanding that it is possible to find out important and helpful information by gathering and analysing data. Students should have opportunities to participate in developing an investigative question and in deciding how the information to answer the question will be collected (data collection). Both of these processes require careful scaffolding for students to understand exactly why and how the investigation will be undertaken.
At this level it is important for students to begin to understand that the results from their investigations may only apply to their situation, may not be true for everyone and therefore cannot be generalised. For example, if the sample is very small (students in one class), or the investigation has been undertaken for a very short period of time, these limiting factors that may affect the results.
Helping students to understand the limitations of their investigation results, leads, with support, to them making important "I wonder" statements and posing further investigative questions. To take an investigation to the point of critiquing results and questioning, at this level, is to develop early on, this important disposition associated with statistical literacy.
Cross-curricular links (Health and Physical Education)
Personal Health and Physical Development, level 1
- A0 1: Describe feelings and ask questions about their health, growth, development and personal needs and wants.
- A0 3: Describe and use safe practices in a range of contexts and identify people who can help.
The learning opportunities in this unit can be differentiated by providing or removing support to students and by varying the task requirements. Ways to support students include:
- using an extended prompt when students are “noticing” about the graph, for example,
- I notice that more children in our class washed their hands on Monday than on Friday.
- I notice that the day with the least number of absentees for our class was Wednesday.
- providing opportunities for students to work in pairs and small groups in order to encourage peer learning, scaffolding, extension, and the sharing and questioning of ideas
- working alongside individual students (or groups of students) who require further support with specific area of knowledge or activities.
The cross-curricular nature of this unit can be adapted to suit the interests and experiences of your students. For example the topic of interest might align with social science outcomes or science outcomes.
The activities in this unit can be adapted to make them more interesting and meaningful for students by adapting them to reflect familiar contexts. Students who attended school from 2019 onwards will probably remember the lockdowns and "stay home" rhetoric experienced as a result of the Covid-19 Pandemic. You could make links to this, or to other localised health issues (e.g. Measles outbreaks, flus, colds etc.). However, you should be sensitive to students' varying experiences of what "staying at home" looks like, and their reasons for coming to school when they are sick.
Te reo Māori kupu such as and tatau (count), kauwhata whakaahua (picture graph, pictograph), kauwhata pou
(bar graph), tuaka pou (vertical axis), and tuaka pae (horizontal axis) could be introduced in this unit and used throughout other mathematical learning.
- Paper
- Pencils and erasers
- Chart paper
- Small squares of paper
- Paint and paintbrushes
- Water, soap, towels
- Hand sanitiser
- Glue stick
- Copy of a relevant book, e.g. Germs Are Not for Sharing, by Elizabeth Verdick or Germs Make Me Sick, by Melvin Berger (both are available online).
- Copymaster 1
Learning activities
Whilst this unit is presented as sequence of five sessions, more sessions than this may be required. It is also expected that any session may extend beyond one teaching period.
Session 1
This session is about acknowledging that a number of students have been absent, introducing a pictograph to keep track of attendance/absences, recognising that there is a health issue in the class, and suggesting what might be causing it. It is helpful if this investigation is undertaken at a time when there has been some history of absences within the class. Be wary of the actual reasons your students are absent - it may be a sensitive topic for some.
SLOs:
- Identify a health issue for investigation.
- Make a pictograph and identify its key features.
Activity 1
- Begin by noticing that there are some absences from the class/there have been some recent absences from the class. Agree that for a period of time (for example, the next two weeks) the class will keep track of the number of students who are absent each day.
- Ask the students for suggestions about how this can be shown so that everyone can see and keep track. Accept all suggestions and discuss these. Lead discussion to the idea that the class could create a (picto)graph.
Activity 2
- Make available small squares of paper. Have each student draw a child on one piece of paper. (It should be a generic picture rather than of themselves). Collect all pictures in a container.
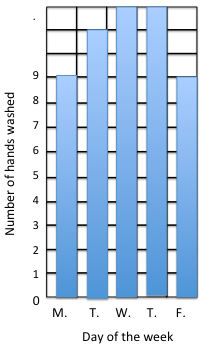
- Together, make a pictograph, with the student input, on a large piece of paper. Highlight the key features as you create the graph:
- Label the x axis (e.g. as categories - in this case days of the week)
- Label the y axis (e.g. as number of students)
- Create an evenly spaced scale on the x and y axis. Discuss how many days need to be recorded on the x axis and how many students there are in the class (for the y axis)
- Write an appropriate title
- Select from the container the same number of pictures as there are absent students. Glue, or have a child glue, these on the graph.
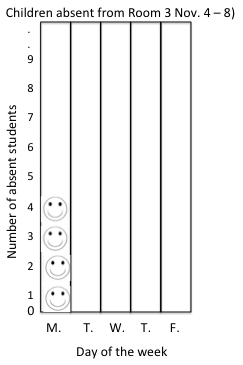
- Have several students talk about the features of the graph and explain what it shows. You might provide sentence starters or have students discuss the features in pairs, before sharing ideas as a class.
How many people were absent on Monday, Tuesday etc.?
On which day were the most/least people absent?
Are there any days on which the same number of people were absent?
Activity 3
- Pose the question. “Why do you think that children in our class might be getting sick?”
Discuss. Lead the discussion to germs. - Read Germs Make Me Sick by Melvin Berger (or one of the other recommended books).
- Conclude the session by asking the students for suggestions about what the class can do about helping people not to get sick and being absent from class. Record the student’s ideas.
For example: “we should carefully clean our hands after we have used the toilet and before we eat”, “we should stay home until we feel better if we are sick", “we should put our hand over our mouth when we cough or sneeze”.
Session 2
This session is about posing an investigative question and planning data collection.
SLOs:
- Pose and investigation questions with support from the teacher.
- Participate in developing a plan to collect data.
Activity 1
- Begin this session by reviewing the graph created and ideas recorded in the previous session.
- Ask: How can we find out if any of these (actions) really does stop people in our class getting sick?
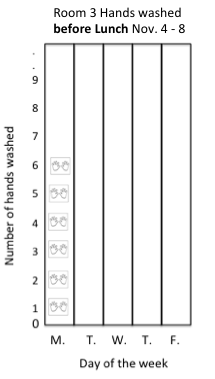
- Have students talk with a partner and agree on ways of doing this. Share and list these. Guide discussion to a class agreement that they will investigate whether cleaning hands before eating means that the students get sick less often. A way of doing this is to have everyone wash/clean their hands before morning tea and lunch, and to see if the number of absences, due to sickness, gets less.
- Write on the class chart the investigative question to be answered. For example:
Does cleaning our hands before we eat help to stop us getting sick?
Activity 2
- Have students suggest how to check that everyone cleans their hands. Agree on a way to gather hand-washing data: For example:
Show Copymaster 1 and cut it into separate small pictures and place these in a coloured container. Show a white container.
Explain that over the next week, each day, twice, before morning-tea and lunch, each student should place a picture in the white container after they have washed or sanitised their hands.
Show two more (prepared) blank pictographs as in Session 1, one for morning-tea time and one for lunchtime. Draw attention to the titles, scales, and axes.
Explain that the helper for the day will glue the hands on each pictograph, when they have finished eating.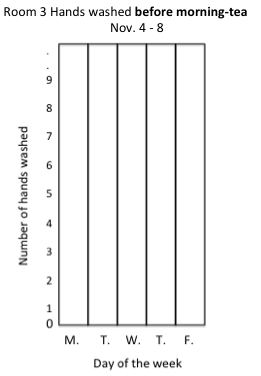
- Distribute a copy of Copymaster 1 to each student.
Have them cut these carefully into separate squares and place them in a coloured container.
Highlight the fact that the picture of two hands ‘represents’ one person.
Activity 4
- Have student explore the principles of good hand washing. You might use a video or another story to explore this. Alternatively, you might a community member (e.g. a nurse or doctor) who could visit your class and talk about this topic.
- Have students make handprints to decorate a class hand-washing display.
- Have students draw around both of their hands and write their names on their ‘clean hands’ print.
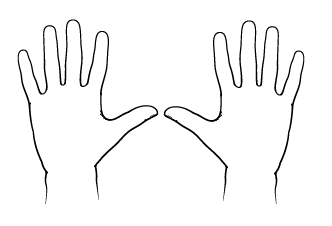
- Make paper, paint, a brush each, and painting shirts available. Have students write their name on a second piece of paper, then make a painted print of each of their hands.
- Make hand washing water, soap and towels available. Explain that there is to be no paint at all left on the towel when everyone has washed and dried their hands.
- Review the principles for good hand-washing that you set as a class, and have students wash their hands thoroughly. You might do this in a few groups, and reflect on how clean each group of students was able to get their hands.
- Reflect on how to clean hands well. Tell students that they have done a great job washing off the paint that they could see on their hands. However, sometimes dirt, like tiny germs (bacteria) is not as easy to see as paint. Even if we think our hands look clean, there might be or the tiny germs that we cannot see.
- Conclude this session by reviewing the data collection process. Explain to the class that, over the next weeks, each day, before morning-tea/lunch they will:
- Use the hand sanitiser to clean their hands well.
- Take one small hand picture from the blue container, and place it in the white container.
- Eat their food.
The helper for the day will glue the hands on the pictograph when they have finished eating.
Session 3 (and following)
This session and the three following are about gathering and sorting data, and adding it, progressively over several sessions, to three pictographs.
SLOs:
- Gather sort and count data.
- Display category data.
On each day:
- Gather absentee data and add these to the appropriate graph.
- Ensure that hand washing data have been added to each of the pictographs.
At the most suitable time in the day, have students talk in pairs about each of the data displays, then have individual students read each aloud to the class. Remind students that the picture of two hands ‘represents’ one person.
Focus on developing the key language (and associated symbols) of "more than, greater than, less than, fewer than", and "the same as", and on having students become comfortable and familiar with the pictograph data display and its features. You might also talk each day about other possible reasons students are absent (e.g. dentist appointment).
Session 4 (The fifth day of data gathering.)
This session is about having the students understand how the data from the pictographs (made in the first week) can also be represented on a bar graph.
SLOs:
- Understand how the data from the pictograph can be represented on a bar graph.
- Recognise the similarities and differences between the both displays.
Activity 1
- Display a glue stick. Explain that the daily helpers have been using the glue stick a lot. Ask if students know of another way they could show the results of their investigation without having to glue on lots of pictures. Record their ideas.
- Agree (or explain) that in the next week, instead of placing a hand picture in a container to show they have washed their hands they will instead use tally marks. Introduce tally marks, and demonstrate what to do.

- Represent several numbers using tally mark and have students give and explain the number presented. You could play a game of Guess the Tally in partners. Have students sit with a partner. One partner sits facing away from their partner. The other partner gently draws a number, in tally mark form, on their partner's back. The partner guesses. If they are correct, they swap roles.
- Together, create a new set of instructions for gathering data, this time using tally marks.
Activity 2
- Ask, “If there are no hands to glue on how will we show the number of people who washed their hands each day?”
Agree (or explain) that in the next week, instead of making a pictograph, the helper will use the number that the tally marks show, to fill in a column or bar of colour on the graph.
- Demonstrate how data will be recorded on a bar graph. In doing this, make explicit the links between the different data types discussed. You should model how the tally marks correspond to an amount of data represented on the bar graph and on the pictograph.
- Show a (prepared) blank bar graph (grid)
- Name each axis and give the graph a title. Refer back to your pictograph and name the new graph together
- Number the lines, not the spaces. Emphasise that we use the spaces to be more accurate
- Represent the number of pictures of hands from this session with tally marks and demonstrate how to show this number on the bar graph.
- Talk about what is the same on the bar graph and the pictograph (title, label on axes, there is a scale) and what is different (the numbering on the y axis, there are no pictures, just a ‘bar’ of colour.) Explain that each person in the class will also make their own bar graph.
Activity 4
- Make graph paper and pencils available. Have students prepare their own empty bar graph to use the following week. Roam and provide support to students to help them successfully create these graphs. Whilst some students might feel confident enough to independently create a graph, others might need to be led through a guided approach.
- In the following data gathering sessions, make time each day to check the tally marks and complete entering the day’s data on the class graphs and have students complete their own copies of the graph. Emphasise that there are spaces between the (coloured) bars.
- Each day, provide opportunities for different students to read aloud the data on their graphs.
Session 5
This session is about discussing the results of the class investigation, recognising the limitations of the investigation and posing further investigative questions.
SLOs:
- Discuss results of the investigation.
- Write about the results of the investigation.
- Draw a picture/diagram to show the investigation process.
- Make ‘I wonder’ statements and pose new investigative questions.
Activity 1
- Begin by reviewing the hand-washing graphs. Highlight the language of comparison. Ask:
- What do you notice about the graphs? (Use the prompt or sentence starter “I notice…”)
- What is the same about pictographs and the bar graph? (Comment of both the data they show and the display features.)
- Are there days when more/fewer/the same number of people were absent? Draw attention to the use of appropriate symbols.
- What is different about the pictographs and the bar graphs? (e.g. they show data from different weeks)
- What do you notice about hand washing over time? (e.g. most people have remembered to wash their hands over all of the two weeks.)
- Review the absentee graphs. Ask:
- What do you notice about the number of people who have been absent? (For example: ‘the number of people who are sick has got less’)
- Are there days when people might have been absent for different reasons?
- Discuss your collective answer to the investigative question: Does cleaning our hands before we eat help to stop us getting sick?
- Have students first discuss this in pairs, with reference to the data, then have them share and explain their thinking with the class. (There may be no apparent relationship between the two data sets). You might provide sentence starters to generate discussion.
- Together write an answer to the investigative question, selecting evidence from their results to support the classes answer.
- Discuss what other things (factors) may have affected the results? (for example: the time for the investigation was not long enough, some people were absent for reasons other than sickness, sneezing and coughing spread germs too, so people still got sick.)
- Does anyone have an “I wonder” comment they wish to make about our investigation? (For example: “I wonder if we did it for longer, if we’d see a pattern”)
- Can anyone suggest another investigative question that we could explore? (For example: ‘Does eating healthy food help to stop us getting sick?’)
- Regardless of results, emphasise that cleaning hands before eating is always important.
- Conclude by talking about the investigation process. Make a simple diagram on the class chart showing each part of the enquiry cycle. Review each step.
- Have each student draw their own picture/diagram of the investigation process, or part of this, and write about what they have learned, including writing the answer to the investigative question.
- Collate your data displays, questions, class charts, questions, and diagrams into a “Healthy Hands” display.
Dear families and whānau,
In class we have been making sure that we wash our hands before we eat our morning tea and our lunch. We have been investigating whether this helps to stop us from getting sick.
Please talk with your child about the results of our “Healthy Hands” investigation and visit our classroom to see our investigation display.